
Recommended
More Related Content
What's hot
What's hot (20)
Viewers also liked
Viewers also liked (16)
Similar to Mutual fund
Similar to Mutual fund (20)
More from Abhishek Bansal
Recently uploaded
Recently uploaded (20)
Mutual fund
- 1. INTRODUCTION OF THE COMPANY RELIANCE INDUSTRIES LIMITED Reliance Group Holdings has grown from a small office data-processing equipment firm in 1961 into a major insurance and financial-services group in one generation under one chief. Reliance's insurance operations constitute the nation's 27th-largest property and casualty operation. The parent company also includes a development subsidiary in commercial real estate. Reliance's international consulting group contains several subsidiaries in energy, environment, and natural resources consulting. A financial arm invests in other businesses, primarily television stations. Reliance Insurance started as the Fire Association of Philadelphia in 1817, organized by 5 hose and 11 engine fire companies. It became the nation's first association of volunteer fire departments. Business got a boost as a result of the Great Chicago Fire of 1871.The association soon developed a field of agents to write policies across the country. For the first two years, shareholders received dividends twice a year of $5 a share, which increased gradually to $10 in 1876. In 1972, the Reliance insurance group divided its pool so that Reliance Insurance Company and its subsidiaries handled most standard lines, while United Pacific Insurance Company handled the nonstandard and other operations. In 1977, the company moved into real estate, forming Continental Cities Corporation, which became Reliance Development Group, Inc. This division handled all real estate operations of the parent company and other subsidiaries. Reliance Capital Group, L.P. constituted the investment branch of the Reliance conglomerate. In December 1989, Reliance Capital sold its investment, Days Corporation, parent company of Days Inn of America, the world's third-largest hotel chain; it had been purchased in 1984. Reliance Industries Limited. The Group's principal activity is to produce and distribute plastic and intermediates, polyester filament yarn, fibre intermediates, polymer intermediates, crackers, chemicals, textiles, oil and gas. The refining segment includes production and marketing operations of the Petroleum refinery. The petrochemicals segment includes production and marketing operations of petrochemical products namely, High and Low density Polyethylene.
- 2. "Growth has no limit at Reliance. I keep revising my vision. Only when you can dream it, you can do it." Dhirubhai Ambani founded Reliance as a textile company and led its evolution as a global leader in the materials and energy value chain businesses. He is credited to have brought about the equity cult in India in the late seventies and is regarded as an icon for enterprise in India. He epitomized the spirit 'dare to dream and learn to excel'. The Reliance Group is a living testimony to his indomitable will, single-minded dedication and an unrelenting commitment to his goals. RELIANCE MUTUAL FUND This group dominates this key area in the financial sector. This mega business houses show that it has assets under management of Rs.90,938 crore (US$ 22.73 billion) and an investor base of over6.6 million (Source:www.amfiindia.com). Reliance’s mutual fund schemes are managed by Reliance Capital Asset Management Limited (RCAM), a subsidiary of Reliance Capital Limited, which holds 93.37% of the paid up capital of RCAM. The company notchedup a healthy growth of Rs.16,354 crore (US$ 4.09 billion) in assets under management in February2008 and helped propel the total industry-wide AUM to Rs. 565,459 crore (US$ 141.36 billion) (Source: indiainvestments.com). A sharp rise infixed maturity plans (FMPs) and collection ofRs. 7000 crore (US$ 1.75 billion) through new fund offers (NFOs) created this surge. Reliance continues to be in the number one spot. India's Best Offering: Reliance Mutual Fund Investing has become global. Today, a lot of countries are waking up to the reality that in order to gain financial growth, they must encourage their citizens to not only save but also invest. Mutual funds are fast becoming the mode of investment in the world. In India, a mutual fund company called the Reliance Mutual Fund is making waves. Reliance is considered India's best when it comes to mutual funds. Its investors number to 4.6 billion people. Reliance Capital Asset Management Limited ranks in
- 3. the top 3 of India's banking companies and financial sector in terms of net value. The Anil Dhirubhai Ambani Group owns Reliance; they are the fastest growing investment company in India so far. To meet the erratic demand of the financial market, Reliance Mutual Fund designed a distinct portfolio that is sure to please potential investors. Reliance Capital Asset Management Limited manages RMF. Vision And Mission Reliance Mutual Fund is so popular because it is investor focused. They show their dedication by continually dishing out innovative offerings and unparalleled service initiatives. It is their goal to become respected globally for helping people achieve their financial dreams through excellent organization governance and customer care. Reliance Mutual fund wants a high performance environment that is geared at making investors happy. RMF aims to do business lawfully and without stepping on other people. They want to be able to create portfolios that will ensure the liquidity of the investment of people in India as well as abroad. Reliance Mutual Fund also wants to make sure that their shareholders realize reasonable profit, by deploying funds wisely. Taking appropriate risks to reach the company's potential is also one of Reliance Mutual Fund's objectives. SCHEMES To make their packages more attractive, Reliance Mutual Fund created proposals called The Equity/ Growth scheme, Debt/Income Scheme, and Sector Specific Scheme. i. Debt/Income Scheme, and Sector Specific Scheme. The Equity/ Growth scheme give medium to long term capital increase. The major part of the investment is on equities and they have fairly high risks. The scheme gives the investors varying options like, capital augmentation or dividend preference. The choices are not deadlocked because if you want you may change the options later on. Providing steady and regular income is one of the Debt/Income Scheme's primary goals. The Debt/Income scheme has in its portfolio government securities, corporate debentures fixed income securities, and bonds. returns on Sector Specific Scheme are dependent on the performance of the industry at which your money is invested upon. Compared to diversified funds this is a lot more risky and you will need to really give your time on observing the market.
- 4. Although RMF is gaining good ground in the financial market, remember that they are a risk taking bunch. They give higher profit because they take a lot of risks. So, if you are faint hearted, then Reliance Mutual Fund is not for you. GROWTH OF RELIANCE MONEY THROUGH RECOGNITION Growth through Recognition Reliance has merited a series of awards and recognitions for excellence for businesses and operations. Corporate Ranking and Ratings: • Reliance featured in the Fortune Global 500 list of ‘World’s Largest Corporations’ for the fourth consecutive year. • Ranked 269th in 2007 having moved up 73 places from the previous year. • Featured as one of the world’s Top 200 companies in terms of Profits. • Among the top 25 climbers for two years in a row. • Featured among top 50 companies with the biggest increase in Revenues. • Ranked 26th within the refining industry. • Reliance is ranked 182nd in the FT Global 500 (up from previous year’s 284th rank). • PetroFed, an apex hydrocarbon industry association, conferred the PetroFed 2007 awards in the categories of “Refinery of the Year” and “Exploration & Production - Company of the Year”. • Brand Reliance was conferred the “Bronze Award” at The Buzziest Brands Awards 2008, organized by agencyfaqs! • Institute of Economic Studies conferred the “Udyog Ratna” award in October 2007 for contributions to the industry. • Chemtech Foundation conferred the “Hall of Fame” in February 2008 for sterling contributions to the industry. • Chemtech Foundation conferred the “Outstanding Achievement - Oil Refining” for work at the Jamnagar Manufacturing Division. • Petroleum Federation of India conferred the “Refinery of the Year Award - 2007” to Jamnagar Manufacturing Division
- 5. • “The Plastics Export Promotion Council - PLEXCOUNCIL Export Award” in the category of Plastic Polymers for the year 2006-2007 was awarded to Reliance being the largest exporter in this category. HEALTH:- • Jamnagar Manufacturing Division was conferred the “Golden Peacock Award for Occupational Health & Safety - 2007” by Institute of Directors. • Jamnagar Manufacturing Division was conferred the “ICC Award for Water Resource Management in Chemical Industry”. • Jamnagar Manufacturing Division was conferred the “Good House Keeping Award” from Baroda Productivity Council. • Jamnagar Manufacturing Division was conferred the “BEL-IND” Award for the best scientific paper at the 58th National Conference of Occupational Health. • Naroda Manufacturing Division was conferred the “Safety Award and Certificate of Appreciation” presented by Gujarat Safety Council & Directorate of Industrial Safety & Health, Gujarat State for the recognition of safety performance at the 29th State Level Annual Safety Conference. • Dahej Manufacturing Division received “BSC 5-Star” rating from British Safety Council, UK. • Dhenkanal Manufacturing Division received the “2nd Prize for Longest Accident Free Period” from the Hon’ble Minister of Labour, State of Orissa. Hoshiarpur Manufacturing Division bagged the First Prize in “Safety in Punjab”, organized by Punjab Safety Council. • Patalganga Manufacturing Division won the “Gold Medal at CASHe (Change Agents for Safety, Health and Environment) Conference”. It also won the III Prize in Process Management category for Presentation on Safety through Design in chemical process industry in Petrosafe 2007 Conference. • Kurkumbh Manufacturing Division won the “Greentech Safety Award silver trophy” for • outstanding achievement in safety management in chemical sector.
- 6. • Hazira Manufacturing Division received the “TERI Corporate Environmental Award (Certificate of Appreciation)” for PET recycling project. Nagothane Manufacturing Division received the “Shrishti G-Cube Award for Good Green Governance” from Minister for Commerce and Industry, on World Earth Day.
- 7. QUALITY:- • For the first time ever, globally, a petrochemical company bagged the “Deming Prize for Management Quality”. “The Quality Control Award for Operations Business Unit 2007” was awarded to the Hazira Manufacturing Division for Outstanding Performance by Practicing Total Quality Management. • “QUALTECH PRIZE 2007”, which recognizes extraordinary results in improvement and innovation, was won by Hazira Manufacturing Division for its Small Group Activity Project. • Vadodara Manufacturing Division’s Polypropylene-IV (PP-IV) plant was conferred the “Spheripol Process Operability Award-2006” for the highest operability rate with an on stream factor 98.97% by M/s. BASELL, Italy. • Allahabad Manufacturing Division won the “Excellent Category Award” at National Convention of Quality Circle (NCQC) - 07. Six-Sigma:- • Lean Six sigma project on “Reducing retention time of caustic soda lye tankers at Jamnagar” won the 1st prize in the national level competition held by Indian Statistical Institute (ISI). • Patalganga Manufacturing Division’s Six Sigma Project on Improve Transfer Efficiency for Automatic winders in PFY won the 2nd Prize for “Best design for Six Sigma Project in International Six Sigma Competition” organized by IQPC (International Quality and Productivity center). • Barabanki Manufacturing Division won the 3rd prize in “All India Six Sigma case study contest 2008” for the Case study on “Reduction of waste of Plant 2 from 16% to 8%”. • Hoshiarpur Manufacturing Division won the 2nd prize in “Six Sigma competition at National Level” organized by ISI and Quality Council of India (in manufacturing category), while Dhenkanal and Barabanki Manufacturing Divisions won the 3rd prize. • Vadodara Manufacturing Division’s Six Sigma project won the 1st prize as the “Best Six Sigma project” at National level by CII.
- 8. PRODUCT S : RELIANCE MONEY The products on offer from Reliance Mutual Fund fall into four main categories: equity, debt, sector specific and ETF (Exchange Traded Fund).Each taps into a specific audience profile fulfilling their varying needs. Under the equity category, Reliance has118 SUPERBRANDS sixteen schemes with Reliance Growth Fund and Reliance Vision Fund as its flagship schemes. Reliance Equity Opportunities Fund is a scheme which operates in the multi-cap/multi sector segment; Reliance Equity Fund is a long-short fund, Reliance Quant Plus Fund is a quant fund. Reliance offers investments in banking, power, media, entertainment and pharmaceuticals; Reliance Tax Saver Fund and Reliance Equity-Linked Savings Fund – Series 1 are tax saving schemes; an NRI-dedicated equity scheme is tailored for non-resident Indians. Reliance Regular Savings Fund is an asset-allocation fund with three options. Under the debt and liquid categories, Reliance has liquid funds, liquid plus funds, income funds, an NRI-dedicated debt fund, gilt funds, fixed maturity plans and an interval fund. In the hybrid category, Reliance Monthly income Plan is a popular option Reliance understands that investments in mutual fund share a function of knowledge dissemination and awareness of products amongst potential investors. In building its own base of assets under management it will necessarily have to carry the entire mutual fund industry. Towards this end Reliance has launched at wopronged initiative. In the first pincer it has created aformidable network of 26,000 distributors including some of the biggest names in the banking sector. This who’s who of the financial industry comprises such giants as Citibank, Standard Chartered, HSBC,ICICI, AXIS, Bank of Baroda, Central Bank of India, Allahabad Bank and fund houses such as JM, DSP Merrill Lynch and Karvy in addition to a massive infrastructure of direct financial investment officers. This prodigious effort is supplemented by the brands’ captive network of 120 branch offices and 30 financial centres. In the second prong, Reliance has created a series of information packed presentations which help dispel misinformation Group. This mega business house dominates this key area in the financial sector. Figures for March 2008 show that it has emerged as the top Indian mutual fund with average assets under management of Rs.90,938 crore (US$ 22.73 billion) and an investor base of over 6.6 million (Source:www.amfiindia.com). Reliance’s mutual fund schemes are managed by Reliance Capital Asset Management Limited (RCAM), a subsidiary of Reliance Capital Limited, which holds 93.37% of the paid-
- 9. up capital of RCAM. The company notchedup a healthy growth ofRs.16,354 crore (US$ 4.09 billion) in assets under management in February 2008 and helped propel the total industry wide AUM to Rs. 565,459 crore(US$ 141.36 billion) (Source: indiainvestments.com). A sharp rise infixed maturity plans (FMPs) and collection of Rs.7000 crore (US$ 1.75 billion) through new fund offers (NFOs) created this surge. In AUM rankings, Reliance continues to be in the number one spot. Reliance was the first fund house to launch sector funds with flexibility to invest in a range of 0% to 100% in either equity or debt instruments Mutual fund investments linked to an ATM/debit card are a Reliance innovation India’s first long- short fund comes from Reliance Mutual Fund As at 31st May 2008, more than 6.6 million people had invested in Reliance Mutual Fund; the investments comprised 16% of the country’s entire mutual fund asset base. ACHIEVEMENTS In two successive joint surveys by The Economic Times’ Brand Equity and ACNielsen, Reliance was recognised as India’s Most Trusted Mutual Fund. The company also walked away with seven other scheme prizes – five of them being outright winners – in the Gulf 2007 Lipper Awards. These included the Fund House of the Year by Lipper GCC as well as ICRA Online and the Most Improved Fund House by Asia Asset Management. It also received the NDTV Business Leadership Award 2007 in the mutual fund category and runners’ up recognition as the Best Fund House in the Outlook Money-NDTV Profit Awards. In addition, the company received the coveted CNBC Web18 Genius of the Web distinction for the Best Mutual Fund Website in the country. RCAM was awarded the India Onshore Fund House 2008 instituted by the Asian Investor magazine. The company also won the India Equities award in the 5-yearPerformance category.
- 10. INTRODUCTION OF THE PROJECT HISTORY OF MUTUAL FUNDS It may seem hard to believe given its fairly recent appearance in the public consciousness, but mutual funds have actually been around for more than 70 years, when they were first made available in the United States. It was in March 21, 1924 that the first open-end mutual fund was founded in the country. Called the Massachusetts Investors Trust, it grew to about 200 shareholders and almost $400,000 in total assets only one year after beginning operations. The entire industry–including a few closed-ended funds–nevertheless had a fairly modest beginning, with less than $10 million total assets in 1924. Its growth proceeded steadily however, and by the end of December 1999 there were more than 8,000 mutual funds recorded with well over $6.8 trillion in combined assets. THE SLOW GROWTH YEARS As we mentioned earlier, the history of mutual funds has been that growth in the mutual funds industry was a bit sluggish after its introduction, particularly during its first 27 years. In 1951, the number of mutual funds barely reached the 100 mark, and the number of shareholders were recorded at just a little over one million. In 1954 however, it was clear that the stock market was on the upswing, and mutual funds exceeded its 1929 peak. By the end of the fifties there were just over 150 mutual funds in existence, with combined assets of nearly $16 billion. It was in 1967 when mutual funds hit their highest mark so far–or so it seemed. Figures of the earnings for one quarter showed at least 50%, representing an average return of 67%, but this was an artificial situation bolstered by the practice of borrowing money, and entailed risky options, as well as artificially boosting returns with letter stock. Nevertheless, the end of the 60s saw almost 300 mutual funds in existence, with total assets of nearly $50 billion.
- 11. MUTUAL FUNDS AFTER THE INTRODUCTION OF THE IRA The passing of the Individual Retirement Account by Congress in 1981 heralded a new period of intense growth in mutual funds and by the end of the decade, there were almost 3,000 mutual funds in existence, with well over $900 billion in combined assets. By December 1998, the total value of stock mutual funds was recorded at $2.981 trillion or almost 54% of the total assets of the mutual fund industry. CONCEPT OF MUTUAL FUND A Mutual Fund is a trust that pools the savings of a number of investors who share a common financial goal. The money thus collected is then invested in capital market instruments such as shares, debentures and other securities. The income earned through these investments and the capital appreciation realized is shared by its unit holders in proportion to the number of units owned by them. Thus a Mutual Fund is the most suitable investment for the common man as it offers an opportunity to invest in a diversified, professionally managed basket of securities at a relatively low cost. The flow chart below describes broadly the working of a mutual fund: ADVANTAGES OF MUTUAL FUNDS • Professional Management: Most mutual funds pay topflight professionals to manage their investments. These managers decide what securities the fund will buy and sell.
- 12. • Regulatory oversight: Mutual funds are subject to many government regulations that protect investors from fraud. • Liquidity: It's easy to get your money out of a mutual fund. Write a check, make a call, and you've got the cash. • Convenience: You can usually buy mutual fund shares by mail, phone, or over the Internet. • Low cost: Mutual fund expenses are often no more than 1.5 percent of your investment. DRAWBACKS OF MUTUAL FUNDS Mutual funds have their drawbacks and may not be for everyone: • No Guarantees: No investment is risk free. If the entire stock market declines in value, the value of mutual fund shares will go down as well, no matter how balanced the portfolio. Investors encounter fewer risks when they invest in mutual funds than when they buy and sell stocks on their own. However, anyone who invests through a mutual fund runs the risk of losing money. • Fees and commissions: All funds charge administrative fees to cover their day-to- day expenses. Some funds also charge sales commissions or "loads" to compensate brokers, financial consultants, or financial planners. Even if you don't use a broker or other financial adviser, you will pay a sales commission if you buy shares in a Load Fund. • Taxes: During a typical year, most actively managed mutual funds sell anywhere from 20 to 70 percent of the securities in their portfolios. If your fund makes a profit on its sales, you will pay taxes on the income you receive, even if you reinvest the money you made. • Management risk: When you invest in a mutual fund, you depend on the fund's manager to make the right decisions regarding the fund's portfolio. If the manager does not perform as well as you had hoped, you might not make as much money on your investment as you expected.
- 13. MUTUAL FUNDS IN INDIA The concept of mutual funds in India dates back to the year 1963. The era between 1963 and 1987 marked the existence of only one mutual fund company in India with Rs. 67bn assets under management (AUM), by the end of its monopoly era, the Unit Trust of India (UTI). By the end of the 80s decade, few other mutual fund companies in India took their position in Mutual fund market. The succeeding decade showed a new horizon in Indian mutual fund industry. By the end of 1993, the total AUM of the industry was Rs. 470.04 bn. The private sector funds started penetrating the fund families. In the same year the first Mutual Fund Regulations came into existence with re-registering all mutual funds except UTI. The regulations were further given a revised shape in 1996. Kothari Pioneer was the first private sector mutual fund company in India which has now merged with Franklin Templeton. Just after ten years with private sector player’s penetration, the total assets rose up to Rs. 1218.05 bn. Today there are 33 mutual fund companies in India. Some of them are as follows:- ABN AMRO MUTUAL FUND: ABN AMRO mutual fund was set up on April 15, 2004 with ABN AMRO Trustee (India) Pvt. Ltd. As the Trustee Company. The AMC, ABN AMRO Asset Management (India) Ltd. was incorporated on November 4, 2003. Deutsche Bank AG is the custodian of ABN AMRO Mutual Fund. ABN AMRO Asset Management is headquartered in London and Amsterdam with important units in Atlanta, Hong Kong, Chicago and Singapore. BIRLA SUN LIFE MUTUAL FUND: Birla Sun Life Mutual Fund is the joint venture of Aditya Birla Group and Sun Life Financial. Sun Life Financial is a global organization evolved in 1871 and is being represented in Canada and US. The AMC of Birla Sun Life Mutual Fund is Birla Sun Life Asset Management Company Limited which was incorporated on September 5, 1994. Recently Birla Mutual Fund crossed AUM of Rs. 10,000 crores. BANK OF BARODA MUTUAL FUND: Bank of Baroda Mutual Fund was set up on October 30, 1992 under the sponsorship of Bank of Baroda. BOB Asset
- 14. Management Company Ltd. Is the AMC of BOB Mutual Fund and was incorporated on November 5, 1992. Deutsche Bank is the custodian. HDFC MUTUAL FUND: HDFC Mutual Fund was set up on June 30, 2000 with two sponsors namely Housing Development Finance Corporation Limited and Standard Life Investment Limited. HSBC MUTUAL FUND: HSBC Mutual Fund was set up on May 27, 2002 with HSBC Securities and Capital Markets (India) Private Limited as the sponsor. Board of Trustees, HSBC Mutual Fund acts as the Trustee Company of HSBC Mutual Fund. PRUDENTIAL ICICI MUTUAL FUND: The mutual fund of ICICI is a joint venture with Prudential Plc. Of America, one of the largest life insurance companies in the US. Prudential ICICI mutual fund was set up on October 13, 1993 with two sponsors Prudential Plc. And ICICI Ltd. The Trustee Company formed is Prudential ICICI Trust Ltd. And the AMC id Prudential Asset Management Company Limited incorporated on June 22, 1993. The debt funds, the Pru ICICI equity funds like Power and Growth Plan have well performed in recent past. Prudential ICICI has a separate analyst who monitors the credit ratings of quality of assets which are given by the credit rating agencies. SAHARA MUTUAL FUND: Sahara Mutual Fund was set up on July 18, 1996 with Sahara India financial corporation ltd. As the sponsor. Sahara Asset Management Company Private Limited incorporated on August 31, 1995 works as the AMC of Sahara Mutual Fund. STATE BANK OF INDIA MUTUAL FUND: SBI mutual fund is the first bank sponsored mutual fund to launch offshore fund, the India magnum fund with a corpus of Rs. 225 crore approximately. Today it is the largest bank sponsored mutual fund in India. They have already launched 35 schemes out of which 15 have
- 15. already yielded handsome returns to investors. SBI mutual fund has mire than Rs. 5500 Crores as AUM. TATA MUTUAL FUND: Tata mutual fund is a trust under the Indian Trust Act, 1882. Tata Mutual Fund was setup on June 30, 1995. The Asset Management Company of Tata Mutual Fund is Tata Asset Management Limited, incorporated on March 15, 1994. The Trustee is Tata Trustee Company Private Limited Tata Asset Management Limited is one of the fastest growing fund management companies in India. UNIT TRUST OF INDIA MUTUAL FUND: UTI Asset Management Company Private Limited, established on January 14, 2003, manages the UTI mutual fund with the support of UTI Trustee Company Private Ltd. UTI Asset Management Company presently manages a corpus of over Rs. 20000 crore. The sponsors of UTI mutual fund are Bank of Baroda, Punjab National Bank, State Bank of India and Life Corporation of India. RELIANCE MUTUAL FUND: Reliance mutual fund was established as trust under Indian trusts act, 1882. The sponsor of RMF is Reliance Capital Limited and Reliance Capital Trustees Co. limited is the Trustee. It was registered on June 30, 1995 as Reliance Capital Mutual Fund which was changed on March 11, 2004. Reliance Mutual Fund was formed for launching of various schemes under which, units are issued to the Public with a view to contribute to the capital market and to provide investors the opportunities to make investments in diversified securities. Standard Chartered Mutual Fund: Standard Chartered Mutual Fund was set up on March 13, 2000 sponsored by Standard Chartered Bank. The Trustee is Standard Chartered Trustee Company Pvt. Ltd. Standard Chartered Asset Management Company Pvt. Ltd. is the AMC which was incorporated with SEBI on December 20,1999.
- 16. Franklin Templeton India Mutual Fund: The group, Franklin Templeton Investments is a California (USA) based company with a global AUM of US$ 409.2 bn. (as of April 30, 2005). It is one of the largest financial services groups in the world. Investors can buy or sell the Mutual Fund through their financial advisor or through mail or through their website. They have Open end Diversified Equity schemes, Open end Sector Equity schemes, Open end Hybrid schemes, Open end Tax Saving schemes, Open end Income and Liquid schemes, Closed end Income schemes and Open end Fund of Funds schemes to offer. Morgan Stanley Mutual Fund India: Morgan Stanley is a worldwide financial services company and its leading in the market in securities, investment management and credit services. Morgan Stanley Investment Management (MISM) was established in the year 1975. It provides customized asset management services and products to governments, corporations, pension funds and non-profit organizations. Its services are also extended to high net worth individuals and retail investors. In India it is known as Morgan Stanley Investment Management Private Limited (MSIM India) and its AMC is Morgan Stanley Mutual Fund (MSMF). This is the first close end diversified equity scheme serving the needs of Indian retail investors focusing on a long-term capital appreciation. Escorts Mutual Fund: Escorts Mutual Fund was setup on April 15, 1996 with Excorts Finance Limited as its sponsor. The Trustee Company is Escorts Investment Trust Limited. Its AMC was incorporated on December 1, 1995 with the name Escorts Asset Management Limited. Alliance Capital Mutual Fund: Alliance Capital Mutual Fund was setup on December 30, 1994 with Alliance Capital Management Corp. of Delaware (USA) as sponsorer. The Trustee is ACAM Trust Company Pvt. Ltd. and AMC, the Alliance Capital Asset Management India (Pvt) Ltd. with the corporate office in Mumbai.
- 17. Benchmark Mutual Fund: Benchmark Mutual Fund was setup on June 12, 2001 with Niche Financial Services Pvt. Ltd. as the sponsorer and Benchmark Trustee Company Pvt. Ltd. as the Trustee Company. Incorporated on October 16, 2000 and headquartered in Mumbai, Benchmark Asset Management Company Pvt. Ltd. is the AMC. Canbank Mutual Fund: Canbank Mutual Fund was setup on December 19, 1987 with Canara Bank acting as the sponsor. Canbank Investment Management Services Ltd. incorporated on March 2, 1993 is the AMC. The Corporate Office of the AMC is in Mumbai. Chola Mutual Fund: Chola Mutual Fund under the sponsorship of Cholamandalam Investment & Finance Company Ltd. was setup on January 3, 1997. Cholamandalam Trustee Co. Ltd. is the Trustee Company and AMC is Cholamandalam AMC Limited. LIC Mutual Fund: Life Insurance Corporation of India set up LIC Mutual Fund on 19th June 1989. It contributed Rs. 2 Crores towards the corpus of the Fund. LIC Mutual Fund was constituted as a Trust in accordance with the provisions of the Indian Trust Act, 1882. . The Company started its business on 29th April 1994. The Trustees of LIC Mutual Fund have appointed Jeevan Bima Sahayog Asset Management Company Ltd as the Investment Managers for LIC Mutual Fund. GIC Mutual Fund: GIC Mutual Fund, sponsored by General Insurance Corporation of India (GIC), a Government of India undertaking and the four Public Sector General Insurance Companies, viz. National Insurance Co. Ltd (NIC), The New India Assurance Co. Ltd. (NIA), The Oriental Insurance Co. Ltd (OIC) and United India Insurance Co. Ltd. (UII) and is constituted as a Trust in accordance with the provisions of the Indian Trusts Act, 1882.
- 18. MUTUAL FUND CLASSIFIACTIONS Wide variety of Mutual Fund Schemes exists to cater to the needs such as financial position, risk tolerance and return expectations etc. The table below gives an overview into the existing types of schemes in the Industry. TYPES OF MUTUAL FUND SCHEMES • By Structure o Open - Ended Schemes o Close - Ended Schemes o Interval Schemes • By Investment Objective o Growth Schemes o Income Schemes o Balanced Schemes o Money Market Schemes • Other Schemes o Tax Saving Schemes o Special Schemes Index Schemes Sector Specific Schemes OPEN ENDED An open-end mutual fund is a fund that does not have a set number of shares. It continues to sell shares to investors and will buy back shares when investors wish to sell. Units are bought and sold at their current net asset value. Open-end funds keep some portion of their assets in short-term and money market securities to provide available funds for redemptions. A large portion of most open mutual funds is invested in highly liquid securities, which enables the fund to raise money by selling securities at prices very close to those used for valuations.
- 19. CLOSED ENDED MUTUAL FUND A closed-end mutual fund has a set number of shares issued to the public through an initial public offering. These funds have a stipulated maturity period generally ranging from 3 to 15 years. The fund is open for subscription only during a specified period. Investors can invest in the scheme at the time of the initial public issue and thereafter they can buy or sell the units of the scheme on the stock exchanges where they are listed. once underwritten, closed- end funds trade on stock exchanges like stocks or bonds. The market price of closed-end funds is determined by supply and demand and not by net-asset value (NAV), as is the case in open-end funds. Usually closed mutual funds trade at discounts to their underlying asset value. INTERVAL SCHEMES These schemes combine the features of open ended and close ended schemes and are available for purchase or sale during a select period LARGE CAP FUNDS Large cap funds are those mutual funds, which seek capital appreciation by investing primarily in stocks of large blue chip companies with above-average prospects for earnings growth. Different mutual funds have different criteria for classifying companies as large cap. Generally, companies with a market capitalization in excess of Rs. 1000 crore are known large cap companies. Investing in large caps is a lower risk-lower return proposition (vis-à- vis mid cap stocks), because such companies are usually widely researched and information is widely available. MID CAP FUNDS Mid cap funds are those mutual funds, which invest in small / medium sized companies. As there is no standard definition classifying companies as small or medium, each mutual fund has its own classification for small and medium sized companies. Generally, companies with a market capitalization of up to Rs.500 crores are classified as
- 20. small. Those companies that have a market capitalization between Rs. 500 crores and Rs. 1,000 crores are classified as medium sized. Big investors like mutual funds and Foreign Institutional Investors are increasingly investing in mid caps nowadays because the price of large caps has increased substantially. Small / mid sized companies tend to be under researched thus they present an opportunity to invest in a company that is yet to be identified by the market. Such companies offer higher growth potential going forward and therefore an opportunity But mid cap funds are very volatile and tend to fall like a pack of cards in bad times. So, caution should be exercised while investing in mid cap mutual funds. EQUITY MUTUAL FUNDS Equity mutual funds are also known as stock mutual funds. Equity mutual funds invest pooled amounts of money in the stocks of public companies. Stocks represent part ownership, or equity, in companies, and the aim of stock ownership is to see the value of the companies increase over time. Stocks are often categorized by their market capitalization (or caps), and can be classified in three basic sizes: small, medium, and large. Many mutual funds invest primarily in companies of one of these sizes and are thus classified as large-cap, mid-cap or small-cap funds. Equity fund managers employ different styles of stock picking when they make investment decisions for their portfolios. Some fund managers use a value approach to stocks, searching for stocks that are undervalued when compared to other, similar companies. Another approach to picking is to look primarily at growth, trying to find stocks that are growing faster than their competitors, or the market as a whole. Some managers buy both kinds of stocks, building a portfolio of both growth and value stocks. BALANCED FUND Balanced fund is also known as hybrid fund. It is a type of mutual fund that buys a combination of common stock, preferred stock, bonds, and short-term bonds, to provide both income and capital appreciation while avoiding excessive risk. Balanced funds provide investor with an option of single mutual fund that combines both growth and income objectives, by investing in both stocks (for growth) and bonds (for
- 21. income). Such diversified holdings ensure that these funds will manage downturns in the stock market without too much of a loss. But on the flip side, balanced funds will usually increase less than an all-stock fund during a bull market GROWTH FUNDS Growth funds are those mutual funds that aim to achieve capital appreciation by investing in growth stocks. They focus on those companies, which are experiencing significant earnings or revenue growth, rather than companies that pay out dividends. Growth funds tend to look for the fastest-growing companies in the market. Growth managers are willing to take more risk and pay a premium for their stocks in an effort to build a portfolio of companies with above-average earnings momentum or price appreciation. In general, growth funds are more volatile than other types of funds, rising more than other funds in bull markets and falling more in bear markets. Only aggressive investors, or those with enough time to make up for short-term market losses, should buy these funds. NO-LOAD MUTUAL FUNDS Mutual funds can be classified into two types - Load mutual funds and No-Load mutual funds. Load funds are those funds that charge commission at the time of purchase or redemption. They can be further subdivided into (1) Front-end load funds and (2) Back- end load funds. Front-end load funds charge commission at the time of purchase and back- end load funds charge commission at the time of redemption. On the other hand, no-load funds are those funds that can be purchased without commission. No load funds have several advantages over load funds. Firstly, funds with loads, on average, consistently under perform no-load funds when the load is taken into consideration in performance calculations. Secondly, loads understate the real commission charged because they reduce the total amount being invested. Finally, when a load fund is held over a long time period, the effect of the load, if paid up front, is not diminished because if the money paid for the load had invested, as in a no-load fund, it would have been compounding over the whole time period.
- 22. EXCHANGE TRADED FUNDS Exchange Traded Funds ( ETFs ) represent a basket of securities that are traded on an exchange. An exchange traded fund is similar to an index fund in that it will primarily invest in the securities of companies that are included in a selected market index. An ETF will invest in either all of the securities or a representative sample of the securities included in the index. The investment objective of an ETF is to achieve the same return as a particular market index. Exchange traded funds rely on an arbitrage mechanism to keep the prices at which they trade roughly in line with the net asset values of their underlying portfolios. VALUE FUNDS Value funds are those mutual funds that tend to focus on safety rather than growth, and often choose investments providing dividends as well as capital appreciation. They invest in companies that the market has overlooked, and stocks that have fallen out of favour with mainstream investors, either due to changing investor preferences, a poor quarterly earnings report, or hard times in a particular industry. Value stocks are often mature companies that have stopped growing and that use their earnings to pay dividends. Thus value funds produce current income (from the dividends) as well as long-term growth (from capital appreciation once the stocks become popular again). They tend to have more conservative and less volatile returns than growth funds. MONEY MARKET MUTUAL FUNDS A money market fund is a mutual fund that invests solely in money market instruments. Money market instruments are forms of debt that mature in less than one year and are very liquid. Treasury bills make up the bulk of the money market instruments. Securities in the money market are relatively risk-free. Money market funds are generally the safest and most secure of mutual fund investments. The goal of a money-market fund is to preserve principal while yielding a modest return. Money-market mutual fund is akin to a high-yield bank account but is not entirely risk free. When investing in a money-market fund, attention should be paid to the interest rate that is being offered.
- 23. INTERNATIONAL MUTUAL FUNDS International mutual funds are those funds that invest in non-domestic securities markets throughout the world. Investing in international markets provides greater portfolio diversification and let you capitalize on some of the world's best opportunities. If investments are chosen carefully, international mutual fund may be profitable when some markets are rising and others are declining. However, fund managers need to keep close watch on foreign currencies and world markets as profitable investments in a rising market can lose money if the foreign currency rises against the dollar SECTOR MUTUAL FUNDS Sector mutual funds are those mutual funds that restrict their investments to a particular segment or sector of the economy. These funds concentrate on one industry such as infrastructure, heath care, utilities, pharmaceuticals etc. The idea is to allow investors to place bets on specific industries or sectors, which have strong growth potential. These funds tend to be more volatile than funds holding a diversified portfolio of securities in many industries. Such concentrated portfolios can produce tremendous gains or losses, depending on whether the chosen sector is in or out of favour. INDEX FUNDS An index fund is a type of mutual fund that builds its portfolio by buying stock in all the companies of a particular index and thereby reproducing the performance of an entire section of the market. The most popular index of stock index funds is the Standard & Poor's 500. An S&P 500 stock index fund owns 500 stocks-all the companies that are included in the index. Investing in an index fund is a form of passive investing. Passive investing has two big advantages over active investing. First, a passive stock market mutual fund is much cheaper to run than an active fund. Second, a majority of mutual funds fail to beat broad indexes such as the S&P
- 24. FUND OF FUNDS A fund of funds is a type of mutual fund that invests in other mutual funds. Just as a mutual fund invests in a number of different securities, a fund of funds holds shares of many different mutual funds. Fund of funds are designed to achieve greater diversification than traditional mutual funds. But on the flipside, expense fees on fund of funds are typically higher than those on regular funds because they include part of the expense fees charged by the underlying funds.
- 25. REVIEW OF LITERATURE REVIEWS By Porter, Gary E, Trifts, Jack W (1998), This study examines the performance of 93 fund managers over the 10 year period 1986 through 1995 using relative percentile ranks based on quarterly compounded, annual total returns measured against funds with the same investment objective. On average, managers with 10-year track records at the same fund do not perform better than managers with shorter track records. Also, for these experienced managers, superior performance in one-five-year period is not predictive of superior performance over the next five years. However, inferior performance persists, particularly for funds with above average expense ratios. Grinblatt and Titman (1992) analyze performance of 279 funds over the period of 1975 to 1984 using a benchmark technique and find evidence that performance differences between funds persists over time. Hendricks, Patel, and Zeckhauser (1993) study 165 no-load growth-oriented funds over the period 1974 to 1988 and obtain similar results. In a study of 728 mutual fund returns over the period 1976 to 1988. Goetzman and Ibbotson (1994) find that two-year performance is predictive of performance over the successive two years. Volkman and Wohar (1995) extend this analysis to examine factors that impact performance persistence. Their data consists of 322 funds over the period 1980 to 1989, and shows performance persistence is negatively related to size and negatively related to levels of management fees. Carhart (1997) shows that expenses and common factors in stock returns such as beta, market capitalization, one-year return momentum, and whether the portfolio is value or growth oriented "almost completely" explain short term persistence in risk-adjusted returns. He concludes that his evidence does not "support the existence of skilled or informed mutual fund portfolio managers".
- 26. Kahn and Rudd 1995 study of 300 equity funds and 195 bond funds between 1983 and 1993, only the bond funds show evidence of persistence. Detzel and Weigand (1998) use a regression residual technique to control for the effects of investment style, size and expense ratios. They find, after controlling for these variables, no evidence of performance persistence. Dunn and Theisen (1983) rank the annual performance of 201 institutional portfolios for the period 1973 through 1982 without controlling for fund risk. They found no evidence that funds performed within the same quartile over the ten-year period. They also found that ranks of individual managers based on 5-year compound returns revealed no consistency. Bauman and Miller (1995) studied the persistence of pension and investment fund performance by type of investment organization and investment style. They employed a quartile ranking technique because they noted that "investors pay particular attention to consultants' and financial periodicals' investment performance rankings of mutual funds and pension funds". They found that portfolios managed by investment advisors showed more consistent performance (measured by quartile rankings) over market cycles and that funds managed by banks and insurance companies showed the least consistency. They suggest that this result may be caused by a higher turnover in the decision-making structure in these less consistent funds. This study controls for the effects of turnover of key decision makers by restricting the sample to those funds with the same manager for the entire period of study. Laurie Prather, William J. Bertin and Thomas Henker (2004), This study provides a comprehensive examination of recent mutual fund performance by analyzing a large set of both mutual funds and fund attributes in an effort to link performance to fund-specific characteristics. The results indicate that the hypothesized relationships between performance and the explanatory variables are generally upheld. After taking into consideration general market conditions and fund investment objective, the characteristic variables that relate to fund popularity, growth, cost, and management also explain performance. Finally, after
- 27. controlling for survivorship and benchmark error as well as fund-specific factors, the results refute the performance persistence phenomenon. Crystal, Mary (1997) On bank marketing suggests more direct interaction with customers by direct mail or personal contact. Doing it pro-actively and by alternative methods: call centers, PC-banking, internet banking and supermarket banking. Using branding and other retail marketing skills. Bankers have tried to cut down on personal contact and may have alienated their customers. Milligan, John (1996) First Long Island Bank prospers because it serves a small niche of small privately owned companies and upscale consumers that it coddles by being available both in person/ phone and online. Carrow Kenneth A., the study investigates whether the announcement of a merger between Citicorp and Travelers abnormally impacted stock prices of financial and insurance companies. Analysis of abnormal returns surrounding the merger show that life insurance companies and large banks experienced significant stock price increases, while the returns of stocks of smaller banks, health insurers, and property remain relatively unchanged. The Bobroff-Mack (2003), The authors study a sample of funds from 55 fund families with at least $10 billion in assets. They identify the chair’s independence for each fund from (at least) the most current Statement of Additional Information (SAI) filed with the Commission, but do not provide information about how many documents were examined and over how many years. First, they report that the relative and absolute Morningstar rankings of funds with independent chairs are significantly lower than the rankings of management-affiliated chaired funds over the past three, five and ten years. Second, they report that the average alpha for management-chaired funds is higher than for independent-chaired funds. Third, they report no reliable relation between chair independence and expenses, noting that the inference depends on how expenses are measured and the relative weight of each fund considered.
- 28. The Ferris-Yan Study (2002), This study uses a larger sample of mutual fund families in 2002 to address whether board and chair independence are related to fund fees and whether independence is related to the probability of a fund family being identified as under investigation for market timing or late trading activity. The analysis covers almost 450 fund families with over 97% of industry total net assets. The study does not address the question of whether board or chair independence is associated with differences in performance. The Meschke Study (2006), Meschke assesses the impact of board and chair independence for a sample of 400 randomly chosen mutual funds for the period from 1995 through 2004. He documents increases in the percentage of boards with independent chairs as well as increases in the average percentage of director independence over the decade. Meschke examines whether this increase in independence can be ascribed to an evolution of boards generally or whether it is associated with a clientele effect – that is, boards add governance features in response to an increased set of investors who are attracted to funds with those characteristics. NEED OF THE STUDY
- 29. OBJECTIVES OF THE STUDY The present study has also been taken up to fulfill some objectives. Thus the objectives of the present study have been identified as follows:- 1. To give a brief idea about the benefits available from mutual Fund investment. 2. To know about the performance of Mutual Funds in Reliance Mutual Fund. 3. To know about the fund management of different schemes. 4. To study the feedback of different investors of Reliance mutual fund. 5. To give an idea about the regulations of mutual funds. 6. To make the study of Mutual Fund in the present scenario.
- 30. RESEARCH METHODOLOGY “All progress for born of inquiry. Doubt is often better than over confidence for it leads to inquiry and inquiry leads invention”. Research has its significance in solving various operational and planning problems of business and industry. Operational Research and Market research along with Motivational Research are considered crucial and their results exist in more that one way in taking business decisions. Market Research is the investigation of the structure and development of market for the purpose of formulating efficient policies for the purchasing, production and sales. Operational research refers to the application of mathematical, logical and analytical techniques to the solution of business problems for cost minimization or maximization for the profit, which can be termed as optimization problems. Motivational Research of defining why people behave as they do is mainly concerned with the determination of motivations underlying their consumer behavior. As these are of great help to people in business and industry who are responsible for taking business decisions. The present study, which attempts to know about the awareness and performance of mutual fund of the different companies, plays a very crucial role. For a good research and for proper and authentic results research methodology plays a crucial role. Research Methodology is a way to systematically solve the research problem, which is a science of studying how research is done scientifically. Thus research methodology encompasses the research methods or techniques research results are capable at being evaluated either by the researcher himself or by others. The project also covers Descriptive Research which includes surveys and fact findings from various inquiries. The relationship between the customers and the market players must be established and explored to make the marketing effort fruitful and profitable. Thus, it is reflected in the above wording that the present study shall be useful in meeting and exploring the proposed objectives. Therefore to make the present study meaningful the data shall be collected from
- 31. various sources such as questionnaire, journals, newspapers and Internet etc. that will serve as the base for the primary and secondary data and for interacting with the respective users of the insurance/mutual fund. Research design In the present study the exploratory-cum-descriptive research design will be followed which help in exploring the answers to the specified objectives of the present study. A research design is an arrangement of condition for collection and analysis of data in a manner that aims to combine relevance to research purpose with economy in procedure. In fact the research design is the conceptual structure with in which the research is conducted. Research design is needed because it facilitates the smooth sailing of the various research operations. Thereby making research as efficient as possible yielding maximal information with minimal expenditure of efforts, time and money. Research Design, in fact, has a great bearing on the reliability of the results arrived at and as such constitutes the firm foundation of the entire evidence of the research work. In the other words we can say that research design is advance planning of research. A good research design should be flexible, appropriate, and efficient and so on. It should try to minimize biases and maximize reliability of the data collected and analyzed is considered a good design. The design must give the smallest experimental error and it should yield maximum information. The present study is an attempt of descriptive in nature, which defines method to measure and find a method of measuring it along with a clear-cut definition of population. Hence it is an endeavour to obtain complete and accurate information and it is a rigid specially paying attention on these points: • Objectives of the study • Designing the methods of data collection • Selecting the sample • Collecting the data • Processing the data • Reporting the findings
- 32. STEPS OF METHODOLOGY Collection of Data Organisation of Data Presentation of Data Analysis of Data Interpretation of Data RESEARCH INSTRUMENTS The proposed study is based on both primary and secondary data. For the primary data the customers has been contacted with the questionnaire designed to gather the data relevant with objective of the study. Data is collected through newspapers, magazines, journals, published reports of the industry players and the internet. SAMPLING Sampling may be defined as the selection of some part of an aggregate or totality on the basic of which a judgment or inference about the aggregate and totality is made. Sampling is used in practice for various reasons. All items in any field of inquiry constitute a universe or population complete enumeration of all items in the population is known as census inquiry. It can be presumed that in such an inquiry, when all items are covered, element of chance is left and highest accuracy is obtain. But in practice this may be not true. Even the slightest element of bias in such an inquiry will get larger and as the numbers of observations increased more over there is no way checking the element of bias or it extend except through a survey or used sample checks besides this type of inquiry involves a great deal of time, money and energy. Therefore when the field of inquiry is large this method becomes difficult to adopt because of the resources involve. On the other hand the sample survey has the followings advantages:- Sampling can save time and money: A sample study is usually a less expensive than a census study and produces results at a relatively a faster speed.
- 33. . Sampling may enable more accurate measurement for trained and experienced investigator generally conducts a sample study. . Sampling remains the only way when population contains infinitely may member. . Sampling remains the only choice when a test involves the destruction of the item under study. . Sampling usually enables to estimate the sampling errors and thus assists in obtaining information concerning same characteristics of the population. SAMPLING UNIT: - Every researcher has to take a decision regarding a sample unit before selecting sample. Sampling unit may be a geographical one such as district, state and village etc or a social unit such as family, club, school, etc or it may be an individual. In my study the sampling units are individuals who are the users of the Mutual Fund. SAMPLE SIZE: - Size of samples refers to the numbers of items to be selected from the universe to constitute a sample. This is a major problem before every researcher. The size of sample should neither be excessively large, nor too small. It should be optimum. An optimum sample is one, which fulfills the requirements of efficiency representatives, reliability and flexibility. While deciding the size of sample researcher must determine the desired precision as also an expectable confidence liable for the estimate, the size of population variance needs to be consider as in case of large variance usually a bigger sample is needed. The size of population must be kept in view for this also limits the sample size. As such budgetary constraints must invariable to taken into consideration when researcher decide the sample size 100 respondents looking at the above consideration. In this case, stratified random sampling was done. SAMPLING PLAN For the purpose of gathering the primary data the respondents numbering not more than 100 shall be contacted with the help of a questionnaire. The sampling has been random and discrete.
- 34. AREA FOR SAMPLING The areas, which has been considered for the purpose of present study is Chandigarh, Derabasi & Zirakpur. Equal number of respondents is contacted for the purpose of uniformity in results without a place for biasness in area or location. DATA COLLECTION The task of data collection begins after the research program has been defined and research design plan checked out. The data collection is and important part of the research. DATA COLLECTION METHOD In the data collection method different methods are adopted for primary data collection and secondary data collection. Primary Data Collection: - Primary data collection, which is collected through observation or direct communication with the respondent in one form or another. These are several methods for primary data collection. • Observation Method • Interview Method • Through Questionnaire But as the time was limited I used the Questionnaire method for data collection Secondary Data: - Secondary data is also collected by me various documents of the company from the Internet. DATA COLLECTION INSTRUMENTS The data collection instruments used in the study are following: - QUESTIONNAIRE: - This method of data collection is quiet popular, particularly in care of inquiries. As we know Questionnaire should be comparatively short and simple in the size of the questionnaire should be kept to minimum questions should proceed in logical sequence moving from easy to more difficult. Hence questionnaire made by me is structured. Structured questionnaire is that in which these are define concrete and predetermine
- 35. questions. The questions were presented with exactly with same wording and in the same order to all respondents. Structured questionnaire are simple to administer and relatively inexpensive to analyze. The provision of alternatives replies at times helps to understand the meaning of question clearly but such questionnaire have limitations too for instance, wide range of data and that too in respondents own words can’t be obtained with structured questionnaire. The sequence is the next important aspect in order to make the effective questionnaire to ensure quality. A researcher should pay attention to the questions sequence in preparing the questionnaire. A proper sequence of questions reduces considerably the chances of individual questions being misunderstood. The following type of question should be avoided. Questions that put too much strain on the memory or intellectual of the respondent. • Questions of a personal characters • Questions related to personal wealth Question sequence must be clear and smoothly moving, meaning thereby that the relation of one question to another question should be reading apparent to the respondent. Concerning the form of questions we can talk about two principles forms: • Multiple Choice Questions • Open Ended Questions Multiple choice or close questions have been the advantages of easy handling, simple to answer quick and relatively inexpensive to analyze. They are most amendable to a statistical analysis some time the open questions are difficult to analyze but as they provide large information so close ended and multiple choice questions are chosen by me in my study.
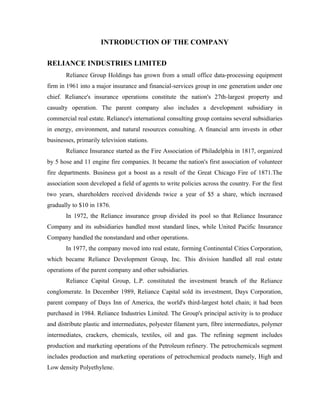
- 36. FUND MANAGEMENT OF DIFFERENT SCHEMES OF RELIANCE MUTUAL FUND 1. DYNAMIC PLAN It is diversified equity fund that could be your ideal choice to make the most of dynamic changes in the market. It has the ability to capture upside opportunities across value and growth, large and midcap, index and non-index stocks. On the flip-side it also has ability to move into cash as markets get overvalued. Its objective is to generate capital appreciation by actively investing in equity related securities for defensive considerations; the scheme may invest in debt, money market instruments and derivatives. Table 3.1 Years %age 2009 -3.11 2008 -44.79 2007 40.78 2006 58.31 2005 58.51 2004 15.70
- 37. 58.31 58.51 60.00 40.78 40.00 Dynamic Plan %age 15.70 20.00 -3.11 0.00 -20.00 -40.00 -44.79 -60.00 2009 2008 2007 2006 2005 2004 Years As the diagram depicts that the annual return from Reliance Mutual Fund dynamic plan was 15.70% in 2004 and increased in 2005 and 2006 but it declines in 2007 due to the entry of new firms in the market and it became negative in 2008 due to recession in the whole economy of the country and is still facing the same situation. 2. FMCG PLAN Reliance Mutual FMCG fund is a diversified sector fund that invests in companies which are benefiting from the consumption boom in the Indian economy. It is an open ended equity fund. The portfolio is made up of a few number of scrip chosen to reflect the prospects of FMCG sector. With in the broad definition of the sector scrips are held across sub-sectors like food, retail distribution and consumables. A smaller allocation to other sectors is permitted purely for defensive considerations. Table 3.2 Years %age 2009 -1.79 2008 -44.92 2007 42.75 2006 24.60
- 38. 2005 94.26 2004 30.12 94.26 100.00 FMCG Fund Return %age 80.00 60.00 42.75 30.12 40.00 24.60 20.00 -1.79 0.00 -20.00 -40.00 -44.92 -60.00 2009 2008 2007 2006 2005 2004 Years The annual return from Reliance Mutual FMCG fund was 30.12 in 2004 and increased to 94.26 in 2005 due to recruitment of trained personnel in the organization and heavy expenditure on promotion. But it decreased in 2006 due to entry of competitors in the market. But it again increases and becomes negative in 2008 due the problem of recession and is still facing the same problem. 3. MONTHLY INCOME PLAN It is that kind of product seeking to generate regular income with stability and lower risk. It is a conservatively managed fund that invest predominately in debt securities, it invest with the view of generating regular income from debt securities.
- 39. Table 3.3 Years %age 2009 -6.15 2008 25.40 2007 9.15 2006 6.23 2005 4.24 2004 -0.10 Monthly Income Return %age 30.00 25.40 25.00 20.00 15.00 9.15 10.00 6.23 4.24 5.00 -0.10 0.00 -5.00 -6.15 -10.00 2009 2008 2007 2006 2005 2004 Years The annual return from Reliance Mutual monthly income plan was negative in 2004 due to improper knowledge to the consumers but with heavy promotional expenditure it increases upto the year of 2008 and becomes negative in the year of 2009 due to the effect of recession. 4. INCOME MULTIPLIER FUND It is that type of fund which adds a flavor of equity to the debt portfolio so that investors are able to benefit from the equity market without taking on substantial risks. It predominantly invests in a debt portfolio that is conservatively managed with a focus on generating regular income. The objective is to keep interest rate risks and credit risks low.
- 40. Table 3.4 Years %age 2009 -0.47 2008 -12.08 2007 16.09 2006 14.74 2005 15.74 2004 -8.76 20.00 16.09 14.74 15.74 Income Multiplier Fund Return 15.00 10.00 5.00 %age -0.47 0.00 -5.00 -10.00 -8.76 -12.08 -15.00 2009 2008 2007 2006 2005 2004 The annual return from Reliance Mutual income multiplier plan was negative in 2004 due to improper knowledge to the customers but with the introduction of it through advertisements it increases and becomes negative in 2008 due to economic recession and is still facing the same. 5. BALANCED FUND Asset allocation is the key to investing success. It helps the investors to reduce the volatility of returns. A balanced fund takes care of this assets allocation by investing in equity for capital appreciation and debt for stable returns. It focuses on reducing volatility of returns by increasing/decreasing equity exposure based on market outlook and using a core
- 41. debt portfolio to do the rebalancing. It is an open-ended fund that allocates to both equity and debt markets, reflects this wisdom. Table 3.5 Years %age 2009 -0.72 2008 -43.83 2007 36.59 2006 29.36 2005 38.70 2004 16.69 38.70 40.00 36.59 29.36 30.00 Balance Fund Return %age 16.69 20.00 10.00 -0.72 0.00 -10.00 -20.00 -30.00 -40.00 -43.83 -50.00 2009 2008 2007 2006 2005 2004 Years The annual return from Reliance Mutual balanced fund was 16.69% in 2004 and it increased in 2005 due to training and development of employees and again decreased in 2006 due to increase in competition and it increases in 2007 and negative in 2008 due to recession and is still facing the same. 6. CHILD CARE (GIFT PLAN) It is an investment instrument specially designed to help you give your child a head start in life. It is suitable if your child is in age-group of 1-13 years. Table 3.6
- 42. Years %age 2009 -3.44 2008 -6.60 2007 17.04 2006 13.48 2005 14.61 2004 6.36 20.00 17.04 14.61 13.48 Child Care Plan Return %age 15.00 10.00 6.36 5.00 0.00 -3.44 -5.00 -6.60 -10.00 2009 2008 2007 2006 2005 2004 Years The annual return from Reliance Mutual child care plan (gift) was 17.1% in 2004 and increased in 2005 due to emotional appeals used by the advertiser and decreased in 2006 due to increase in the competition and in 2007 it again increases due to training and development of employees and becomes negative in 2008 due to recession in the economy and is still facing the same. 7. CHILD CARE (STUDY) PLAN It is an investment specially designed to help you give your child a head start in life. It is suitable if your child is in age group of 13-17 years. Table 3.7
- 43. Years %age 2009 -3.44 2008 -6.60 2007 17.04 2006 13.48 2005 14.61 2004 6.36 20.00 17.04 14.61 Child Care Plan Return %age 13.48 15.00 10.00 6.36 5.00 0.00 -3.44 -5.00 -6.60 -10.00 2009 2008 2007 2006 2005 2004 Years The annual return from Reliance Mutual child care plan (study) was 6.36% in 2004 and due to increase in promotion expenses it increased and becomes negative in 2008 due to recession situation in the economy and is still facing the same. 8. INDEX FUND There are two approaches to mange an investor’s portfolio. One is active management which involves choosing sectors and stocks that represent the views of the fund managers, as best suited to meet the portfolio objective. The other is passive management which simply means buying into a market index. Reliance Mutual Index fund offers a passive choice to investors. Table 3.8
- 44. Years %age 2009 2.30 2008 -50.36 2007 56.46 2006 41.94 2005 39.98 2004 9.32 56.46 60.00 41.94 39.98 40.00 Index Fund Return %age 20.00 9.32 2.30 0.00 -20.00 -40.00 -50.36 -60.00 2009 2008 2007 2006 2005 2004 Years The annual return from Reliance Mutual index fund was 9.32% in 2004 and is increased up to 2007 due to heavy promotional expenses spent on advertisements and becomes negative in 2008 due to recession situation in the economy and its position now has been improved. 9. GROWTH PLAN It seeks to invest in large, profitable and well known companies, and aims to benefit from the best long terms investments that the market has to offer in large cap space. The investments are spread across sectors to ensure risk diversification and stocks are selected through rigorous fundamental bottom up analysis. Table 3.9
- 45. Years %age 2009 3.53 2008 -47.74 2007 44.40 2006 42.77 2005 49.53 2004 13.35 49.53 50.00 44.40 42.77 40.00 30.00 Growth Plan %age 20.00 13.35 10.00 3.53 0.00 -10.00 -20.00 -30.00 -40.00 -47.74 -50.00 2009 2008 2007 2006 2005 2004 Years The annual return from Reliance Mutual growth plan was 13.35% in 2004 and it increased to 49.53% in 2005 due to heavy promotional expenditure and due to recruitment of able and trained employees in the organization but it declined in 2006 and became negative in 2008 due to recession period and its position is now improving day by day. 10. TAX PLAN It allows the investors to harness the benefits of long term equity investing in addition to helping you save tax. It is an open-ended equity linked saving scheme. It is suited for patient investors who have a long term investing horizon of 3-5 years and at the same time are looking at tax saving. Table 3.10
- 46. Years %age 2009 69.5 2008 -56.4 2007 39.1 2006 23.5 2005 67.7 2004 35.9 80 69.5 67.7 60 Tax Plan Retrun (In %age) 39.1 35.9 40 23.5 20 0 -20 -40 -56.4 -60 2009 2008 2007 2006 2005 2004 Years The annual return from Reliance Mutual tax plan was 35.9% in 2004 but it increased suddenly to 67.7% in 2005 due to heavy expenditure on the promotional tools. This plan helps to save tax. But it decreased in 2006 due to the increase in the competition in the market but it became negative in 2008 due to economic recession and is still facing the same problem. 11. EMERGING S.T.A.R. (Stocks Targeted At Returns) PLAN It identifies and focuses on those stocks that not only hold promise but can also weather adversity in their path to becoming big and seeks to bring you the benefit of investing in the leaders of tomorrow, today. It is an open-ended equity fund that is focused on mid-cap sector. It provides the opportunity to take part in and gain from the growth stories of lesser known, smaller stocks. Table 3.11
- 47. Years %age 2009 -10.30 2008 -68.40 2007 59.40 2006 38.50 2005 68.90 2004 19.30 80.00 68.90 59.40 Emerging S.T.A.R. %age 60.00 38.50 40.00 19.30 20.00 0.00 -10.30 -20.00 -40.00 -60.00 -68.40 -80.00 The annual return from Reliance Mutual emerging S.T.A.R. fund2004 19.3% in 2004 2009 2008 2007 2006 2005 was Years and increased in 2005 due to increase in the advertisements and decreased in 2006 due to increase in the competition and lack of able manpower in the organization but it increased in 2007 due to heavy expenditure on training and development of employees and became negative in 2008 due to recession situation in the economy and is still facing the same situation. 12. DISCOVERY FUND It offers an alternative value investing style that helps in truly balancing the equity portfolio. The value Philosophy focuses on discovering stocks that have high potential but are currently lying low at a discount to their inherent value. It seeks to invest in companies that are well managed and fundamentally strong, picked based on in depth research. As these companies are brought at discount to their fair value, there is a margin of safety in the value portfolio. Table 3.12
- 48. Years %age 2009 -3.43 2008 -54.56 2007 39.65 2006 28.69 2005 63.74 2004 24.93 Discovery Fund Return %age 80.00 63.74 60.00 39.65 40.00 28.69 24.93 20.00 0.00 -3.43 -20.00 -40.00 -54.56 -60.00 2009 2008 2007 2006 2005 2004 Years The annual return from Reliance Mutual discovery fund was 24.93% in 2004 and it increased in 2005 due to promotional expenses and decreased in 2006 due to lack of able manpower and it again increased in 2007 due to training and development and became negative in 2008 due to recession period in the whole economy and is trying to move out from the worst situation. 13. TECHNOLOGY FUND It is a concentrated sector fund that focuses predominantly on information Technology. The fund can enhance exposure of an investor’s Portfolio to this sector, if investor is convinced about the prospects. Table 3.13 Years %age 2009 -4.91 2008 -62.76 2007 10.92 2006 51.64
- 49. 2005 53.34 2004 17.08 51.64 53.34 60.00 Technology Fund Return %age 40.00 10.92 17.08 20.00 -4.91 0.00 -20.00 -40.00 -60.00 -62.76 -80.00 2009 2008 2007 2006 2005 2004 The annual return from Reliance Mutual Years technology fund was 17.08% in 2004 and increased in 2005 due to heavy promotional expenses and it decreased in 2006 and 2007 due to entry of new firms in the market and becomes negative in 2008 due to recession in the economy and is still facing the same. 14. POWER It is an open-ended equity fund. The port folio is made up of large cap and mid-cap Stocks and is aimed at capturing the growth opportunities across multiple sectors in the market. It seeks to optimize risk adjusted return. Table 3.14 Years %age 60.00 51.47 50.55 2009 1.54 2008 -54.78 Power Fund Return %age 40.00 2007 51.47 2006 20.00 1.54 50.55 0.00 -20.00 -40.00 -54.78 -60.00 2009 2008 2007 2006 Years
- 50. The annual return of Reliance Mutual power plan was 50.55% in 2006 and it increased in 2007 due to increase in the promotional expenses and becomes negative in 2008 due to recession situation in the economy and its situation is now improving day by day.
- 51. ANALYSIS AND INTERPRETATION Table 4.1 Classification of the Respondents on the basis of their Occupation Occupation No. of Respondents %age Businessman 26 26% Govt. Employee 36 36% Students 10 10% Professional 15 15% Any Other 13 13% 40 36 35 No.of Respondents 30 26 25 20 15 13 15 10 10 5 0 Professional Businessm an Any Other Em ployee Students Govt. Occupation The above diagram shows that 36 respondents are govt. employees, 26 respondents are businessman, 15 respondents are professionals, 13 respondents belongs to any other category i.e. farmers and small shopkeepers and 10 respondents are students, has been taken as sample size for the research study by the researcher.