Understanding Uganda's Trade Competitiveness in East Africa
•
1 like•78 views

UGANDA Trade Competitiveness in EAC

Recommended
Recommended
More Related Content
What's hot
What's hot (20)
Similar to Understanding Uganda's Trade Competitiveness in East Africa
Similar to Understanding Uganda's Trade Competitiveness in East Africa (20)
Recently uploaded
Recently uploaded (20)
Understanding Uganda's Trade Competitiveness in East Africa
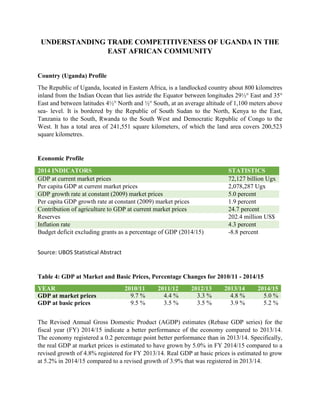
- 1. UNDERSTANDING TRADE COMPETITIVENESS OF UGANDA IN THE EAST AFRICAN COMMUNITY Country (Uganda) Profile The Republic of Uganda, located in Eastern Africa, is a landlocked country about 800 kilometres inland from the Indian Ocean that lies astride the Equator between longitudes 29½° East and 35° East and between latitudes 4½° North and ½° South, at an average altitude of 1,100 meters above sea- level. It is bordered by the Republic of South Sudan to the North, Kenya to the East, Tanzania to the South, Rwanda to the South West and Democratic Republic of Congo to the West. It has a total area of 241,551 square kilometers, of which the land area covers 200,523 square kilometres. Economic Profile 2014 INDICATORS STATISTICS GDP at current market prices 72,127 billion Ugx Per capita GDP at current market prices 2,078,287 Ugx GDP growth rate at constant (2009) market prices 5.0 percent Per capita GDP growth rate at constant (2009) market prices 1.9 percent Contribution of agriculture to GDP at current market prices 24.7 percent Reserves 202.4 million US$ Inflation rate 4.3 percent Budget deficit excluding grants as a percentage of GDP (2014/15) -8.8 percent Source: UBOS Statistical Abstract Table 4: GDP at Market and Basic Prices, Percentage Changes for 2010/11 - 2014/15 YEAR 2010/11 2011/12 2012/13 2013/14 2014/15 GDP at market prices 9.7 % 4.4 % 3.3 % 4.8 % 5.0 % GDP at basic prices 9.5 % 3.5 % 3.5 % 3.9 % 5.2 % The Revised Annual Gross Domestic Product (AGDP) estimates (Rebase GDP series) for the fiscal year (FY) 2014/15 indicate a better performance of the economy compared to 2013/14. The economy registered a 0.2 percentage point better performance than in 2013/14. Specifically, the real GDP at market prices is estimated to have grown by 5.0% in FY 2014/15 compared to a revised growth of 4.8% registered for FY 2013/14. Real GDP at basic prices is estimated to grow at 5.2% in 2014/15 compared to a revised growth of 3.9% that was registered in 2013/14.
- 2. Population Density by District Source: UBOS Census 2014
- 3. Description of the Manufacturing Sector in Uganda Manufacturing in Uganda consists predominantly of last-stage (end-product) assembly and raw materials processing of which a high share is food processing, for foreign exchange earnings. Both of these are low value added activities with are very few capital goods industries hence increasing manufacturing exports is a direct means of diversifying Uganda's export structure and reducing its vulnerability to global market volatilities. Agro-processing firms account for about 39% of manufacturing establishments in Uganda (UBOS 2012). In addition, manufacturing firms in Uganda are high-cost producers and are characterized by high excess capacity, with capacity utilisation of the installed capacity averaging 50%. The challenge relating to manufacturing being dominated by end product assembly is underscored by the rising value and share of manufacturing products in total merchandise exports and in industrial GDP. Manufacturing (both formal and informal) is one of the sub-sectors of the country's industrial sector. Other sub-sectors are construction, mining and quarrying, electricity generation, and water services. While the focus here is on manufacturing, it is worth briely highlighting the performance of other industrial sub-sectors. Construction has dominated Uganda's industrial output, contributing between 10% and 16% to GDP since 2000, followed by manufacturing, averaging 7% of the country's GDP over the past decade. Regional Integration, East African Community (EAC) EAC is the intergovernmental organization comprising Kenya, Uganda, the United Republic of Tanzania, Rwanda and Burundi, whose mission is “to widen and deepen Economic, Political, Social and Culture integration in order to improve the quality of life of the people of East Africa through increased competitiveness, value added production, trade and investments” (EAC website). It was first established in 1967 with the cooperation of Kenya, Tanzania and Uganda. Following its dissolution in 1977, it took around 20 years to establish the Permanent Tripartite Commission for East African Cooperation and for the new treaty to enter into force. Between 2005 and 2010, the EAC implemented a customs union and a Common External Tariff on imports from third countries, duty-free trade between the Partner States and common customs procedures. In 2007, Rwanda and Burundi became full members of the EAC and joined the EAC Customs Union in 2009. On 2nd March, 2016 at the Heads of states Summit, South Sudan was declared a member of the Community will full integration expected to be completed late this year (2016). In 2010, the EAC Partner States signed a Common Market Protocol that seeks to “accelerate regional economic growth and development by introducing the free movement of goods, persons and labor, the right of establishment and residence, and the free movement of services and capital”. It is also expected that the Protocol will strengthen, coordinate and regulate the economic and trade relations among the Partner States.
- 4. Industrialisation in the EAC The overall objective with regard to industry, according to the East African Community Industrialisation Policy 2012-2032, is to create a market-driven competitive industrial sector based on the comparative and competitive advantages of the EAC region, and to accelerate the structural transformation of the Partner States’ economies. The specific policy targets are diversifying the manufacturing base and raising the valued added content of resource-based exports from 8.62% to 40% by 2032; strengthening national and regional institutional frameworks and capabilities for industrial policy design and implementation; strengthening research & development technology and innovation capabilities; increasing the contribution of intraregional manufacturing exports relative to total manufactured imports; and transforming micro, small and medium enterprises so they can increase contributions in manufacturing GDP from currently 20 percent to 50 percent by 2032. EAC intra-regional manufactured trade rose from 373 million USD in 2000 to 1.7 billion USD in 2010, an average annual growth rate of more than 16 percent for the decade. Yet this only accounts for 35 percent of the EAC’s total manufactured trade in 2010, down from 50 percent in 2000. A similar trend is observed in sophisticated industries (medium and high-tech exports) and less complex manufactures (resource-based and low-tech exports). The Competitiveness Industrial Performance (CIP) Index United Nations Industrial Development Organisation (UNIDO) approach on competitiveness means/measures the ability to compete with firms at the international frontier of best practice. It must be recognised that it is firms that compete not nations. Firms have their own strategies for lowering cost, improving product quality and finding marketing networks. However, due to the intrinsic failure of markets in critical areas, government support for firms has in some contexts proved to be an important component of the process of attaining competitiveness. Trade expansion has been at the centre of globalisation, with manufactures making up the bulk of global trade, consistently accounting for more than 80% of exports since 1990 (UNIDO 2011c). While developed countries have traditionally dominated world manufactures trade, developing countries' share has been steadily rising. National industrial performance in this analysis is assessed using the Competitive Industrial Performance (CIP) index developed and modified by UNIDO in 2003 and 2011, respectively. Intuitively, the CIP assesses the country's industrial performance, using indicators of an economy's ability to produce and export manufactured goods competitively.
- 5. The essence of a competitiveness strategy is to: promote in-firm learning, skill development and technological effort; improve the supply of information, skills and technology from surrounding markets and institutions; and coordinate collective learning processes that involve different firms in the same industry, or across related industries popularly known as clusters, geographical or activity wise. Firms develop their capabilities within different markets, using the term broadly, for example those relating to physical infrastructure, human capital, finance, technology and cluster effects. The need for a competitiveness policy arises when any of these markets fails to function efficiently. The experience of the Tigers of East Asia indicates that coherent and carefully crafted policies can accelerate shifts in competitiveness and promote entry into very complex and high technology activities. Methodology of the CIP Indicators at Macro Level DIMENSIONS TRADE INDICATORS Capacity Manufactured Exports ÷ Population Ability to export Impact Manufactured Exports (Country) ÷ Manufactured Exports (World) Relative performance Structural Change Manufactured Exports ÷ Total Exports Structure of industry Industrial Deepening Medium and High Tech Manufactured Exports Manufactured Exports EXPORT CAPACITY This Competitiveness Industry Performance (CIP) index dimension measures the ability of the country to export manufactured products, taking into consideration country size. In otherwards, it shows the ability of the country’s population to manufacture for export. The manufacturing export capacity of Kenya in 2014 is higher than other EAC countries at 57.4 USD, Tanzania follows at 45.9 USD, Rwanda at 25.7 USD, Uganda at 17.9 USD, and Burundi at 4.1 USD as shown in Figure 1 below. Although there is steeper growth for almost all countries since 2004/5, the trends of the years since 2012 seem a little worrying for Uganda, Tanzania and Kenya. Therefore there is need to closely track this developments i.e. need to understand which products exported have caused this (one product group, or all manufactured export?), or whether it was a particular destination market that stopped importing from these countries.
- 6. The Manufactured Export (Mnf Exp) per capita of Kenya is 46.8 USD on average in the period 2000-2014, Tanzania at the average of 21.6 USD, Uganda at the average of 12.0 USD, Rwanda at the average 10.7 USD, and Burundi at the average of 2.3 USD in that given period. The manufacturing export capacity is fluctuating for all countries except Burundi (2000-2014) which can be explained by the resource based nature of products produced by the countries. However, subsector analysis would help to better explain these trends. Figure 1; Shows Export Manufacturing Capacity of the East African Community (EAC) Partner Countries Source: UN Comtrade EXPORTS IMPACT It shows the relative performance of the EAC Countries’ Manufactured Exports (Mnf Exp) on the global perspective. Gains in world market shares reflect improved competitiveness while losses signal a deterioration of a country’s competitive position. The share in World Mnf Exp for Kenya is far higher than other partner countries just like how it is with export capacity. Burundi also has the lowest export impact in the region. This perhaps indicates that Kenya is more competitive in terms of exports than other EAC countries since its capacity and impact dimensions are above others. However, more indication can be obtained from the structural change.
- 7. A steady increase of the share in World Mnf Exp was identified in the region, and more particularly Tanzania and Rwanda have been doubling their impact to the world of the given period i.e. 2000, 2007, 2014 as shown by Figure 2. This means that the growth rate of Mnf Exp of the EAC was faster than the world average growth rate. While all countries have increased their shares when comparing 2000 and 2014 values, only Tanzania, Uganda and Rwanda were able to increase their presence globally between 2007 and 2013. Kenya and Burundi have been falling behind in between 2007 and 2014. That’s also why there is a shrinking of the gap between Kenya and Tanzania, in the rest years. Despite the above achievement, the average contribution to the World Mnf Exp for the selected countries is still very minimal (about 0.006%) according to the period considered. Figure 2; Shows the Share of Manufactured Exports to the World Manufactured Exports Source: UN Comtrade EXPORT STRUCTURAL CHANGE This dimension is able to access the changes in the country’s share of Manufactured Exports (Mnf Exp) in relation to the total exports as well as the technology applied. It captures the change in the role of manufacturing in export activity. As shown on Figure 3, there has been improvement in the role of manufacturing in export activity for all the countries depicted by the movements to the right except for Kenya, between
- 8. 2005 and 2014. This indication shows a difference in trade competitiveness because in the previous analysis (capacity and impact), Kenya is above other EAC partner countries. This means Kenya’s prioritisation of Mnf Exp in their total exports for the period under consideration has decreased but this does not mean a decrease in the volume. Hence Kenya may be concentrating on other sectors of the Economy. Also note that Kenya has an average share of Mnf Exp in total exports of 50.6%, Rwanda 50.0%, Tanzania 36.7%, Uganda 37.2% and Burundi 19.0% for the period observed. The technological complexity of products in Mnf Exp registered a minor improvement between 2005 and 2014 for the EAC countries except Uganda and Burundi. This is a common tendency for small and low income countries because the opening or closing of one big firm will have a large impact on the industrial deepening. Also note that Burundi presented higher share of Medium and High-Tech (MHT) products in Mnf Exp of 33.4% on average, followed by Uganda (21.4%), Kenya (21.2%), Tanzania (16.4%), and Rwanda with the lowest of 9.3% on average for the period under consideration. Burundi’s share of MHT products in Mnf Exp depicts a better trade industrial deepening in the EAC region. EAC’s annual average growth of manufactured exports in the total exports is approximately 8.1% between 2005 and 2014 with Uganda, Tanzania, Burundi and Rwanda moving on target except for Kenya which has a decrease, hence partner states are giving manufacturing due priority in the export process. On the other hand, the share of MHT Mnf Exp in manufactured exports of EAC stands at an average performance of 20.3% in that period which demonstrates a low level of technology sophistication of manufactured exports, hence implying there is a risk of attracting low prices on world markets, demand fluctuations since they are easy to manufacture (low-tech), etc. Figure 3; Shows the Change in Trade Structure of Manufactured Exports
- 9. Source: UN Comtrade Market Distribution in EAC There are a number of reasons for this lack of manufacturing activities both on the supply as well as on the demand side. This section will explore the demand side factors, namely the market potentials for EAC and or Ugandan firms as well as existing threats by foreign competition. The exploitation of market potentials is the key to success for any manufacturing enterprise that aims to increase its sales and achieve a sustainable competitive advantage. Even more so, profit seeking entrepreneurs who consider investing in industry will only do so if an attractive market attracts their attention. Accordingly, market demand can be considered a key driving force for the emergence of a competitive manufacturing. Comparing EAC Intra-Regional Manufactured Trade with Other Regions…
- 10. Source: UN Comtrade Analysis of Individual Member Countries’ Performance in the EAC’s Contribution 2000 2014 00-10 10-14 00-14 2000 2014 00-10 10-14 00-14 2000 2014 00-10 10-14 00-14 Kenya 343,984 1,095,133 13% -2% 9% 109,658 541,330 19% -4% 12% 132,421 939,314 18% 8% 15% Tanzania 20,370 326,116 33% -1% 22% 16,880 844,055 35% 25% 32% 91,974 1,206,212 29% 0% 20% Uganda 6,870 297,948 39% 13% 31% 7,356 107,384 36% -9% 21% 15,936 269,677 15% 44% 22% Rwanda 3,718 156,007 7% 114% 31% 6,496 50,428 10% 33% 16% 12,248 85,204 19% 4% 15% Burundi 2,343 8,706 11% 6% 10% 49 26,876 65% 37% 57% 318 8,778 29% 20% 27% ManufacturedExportstodestination(1,000USD) Growthrate(CAGR) Growthrate(CAGR) Growthrate(CAGR)EAC SSA(exclEAC) RestofWorld N.B: EAC as a Regional Market; Is the EAC working as a market for manufactured products? Growth of Uganda’s Export to the Regional Bloc (2005/06 – 2014/15)
- 11. Source: Bank of Uganda The COMESA regional bloc remained as the main destination for Uganda’s exports during the period under review (2005/06 – 2014/15) with the share in total export earnings increasing on average throughout the financial years (26.58% in 2005/06 to 53.71% in 2014/15). The trend for COMESA has increased and more than doubled as compared to other regions in the period as shown above. The EU market ranked the second highest destination for Uganda’s products although the share in total export earnings has been reducing to 21.87% (US$ 502.99 million) for 2014/15. The decline has been on since dropping from 26.50% in 2010/11 to 24.16% in 2011/12, 22.97% in 2012/13, 22.01% in 2013/14 and 21.87% in 2014/15. Middle East bloc followed accounting for 9.29% (US$ 213.76 million) of the total market share in 2014/15 compared to 5.90% in 2013/14. Asia, Rest of Africa, Rest of Europe, The Americas followed respectively as shown above. Uganda’s Trade with COMESA
- 12. Source: Bank of Uganda Among the COMESA partner states that contributed significantly to export earnings were Kenya, South Sudan, Rwanda, D.R. Congo, accounting for US$ 374.75 million, US$ 309.66 million, US$ 253.54 million and US$ 160.16 million in 2014/15 respectively (88.89% composition of Uganda – COMESA trade) as shown above. South Sudan registered the highest growth rate in market share of export from Uganda to COMESA (75.94%) between 2005/06 and 2014/15 hence meaning it’s an attractive market for the future. The growth rate figure is both above the regional growth rate (20.94%) and Uganda export trade growth rate (11.85%). The other countries with similar partners are Madagascar, Namibia, Rwanda, and Kenya in that order. The COMESA partner states that are below Uganda to COMESA growth rate but above Uganda export trade growth rate are Ethiopia, D.R. Congo and Zambia, while the others are below Uganda export trade growth rate as shown in the figure below.
- 13. Source: Bank of Uganda Uganda's exports are largely destined for regional markets, particularly in neighbouring countries like South Sudan, the Democratic Republic of Congo (DRC), and Rwanda.
- 14. Top 10 Formal Export Destinations, 201`5 (US$ million) COUNTRY Value (US$ mil.) Main Products Kenya 448.19 Tea, tobacco, dairy products South Sudan 253.92 Oil products, beer, sugar, vegetable oils Rwanda 214.68 Iron/steel products, confectionery, cosmetics, grains (maize, beans) UAE 205.99 Fish fillets, fruits and vegetables DR Congo 143.05 Cereals Sudan 77.16 Coffee, tea The Netherlands 75.01 Flowers, fruits and vegetables, fish China 57.64 Hides/Skins, oil seeds, Coffee, Sim Sim Tanzania 62.23 Iron/steel, re-exports Burundi 43.62 Cement, iron/steel, animal/vegetable oils and fats Import Substitution as an Opportunity in the Domestic Market Starting from the assumption that national firms should be in a better position to identify opportunities and meet the demand in their home market, a strong import dependency is difficult to comprehend at first glance. However, with globalisation progressing rapidly and trade liberalisation spreading across most developing regions, the new “rules of the game” enable multinational firms to easily exploit market potentials on a global scale. Consequently, the strong presence of foreign products is sometimes perceived as a threat for local manufacturers in Africa. Yet, if domestic firms do not shy away from serious investments in productive capacities and simultaneously benefit from a conducive policy environment, the chances for national competitors to emerge are high. The bottom line is that while large trade deficits can be deemed a serious threat from the macro-economic perspective, they also point to significant unused market opportunities for domestic producers. However, not all manufactured products have the same characteristics, and it is therefore necessary to identify the most attractive domestic markets which are likely to be more suitable for an import-substitution strategy. While the listed product categories are rather diverse, the following common characteristics deserve attention: There is substantial demand for all these product categories in the domestic market which is currently being met by goods produced outside EAC. Domestic demand for each product category is growing by more than 18 percent annually, offering plenty of future opportunities for local producers of these goods. With one exception (wheat), all categories are manufactured products and ten of the twenty categories are medium-technology manufactures.
- 15. In addition, there have been concerns regarding the stiff competition of imported manufactured goods (new and second-hand items) to similar manufactures produced locally. In this regard, there have been calls from local manufacturers for a policy to shield them from cheap and (most likely) better imported products, given that they are still infant manufacturing firms (the infant industry protection/import substitution argument). However, Uganda's manufacturing sector seems to be more competitive relative to other countries in East African Community individually and the region as a whole. Main Imports by Regions (2005/06 – 2015/16) Source: Bank of Uganda The Asian Continent kept its place as the main source of Uganda’s imports throughout the period under review(2005/06 – 2015/16) although its market share in Uganda’s import bill declined slightly from 53.29% (US$ 2,703.52 million) in 2013/14 to 51.09% (US$ 2,256.02 million) in 2015/16 as shown above. The African Continent came second, with an import bill of US$ 971.93 million in 2015/16, representing an estimate of 22.01% of the market share in Uganda’s imports. Of these, the COMESA regional bloc alone accounted for 15.50% (US$ 684.33 million) of the total imports expenditure, of which again, Kenya recorded the highest share (12.73%) in that period of 2015/16. Among the countries in the rest of Africa, South Africa accounted for the highest share of 4.63% (US$ 204.57 million) of the total imports bill in the period.
- 16. The Middle East ranked third, with a slight increase in the Uganda imports expenditure of the recent periods from US$ 546.17 million (10.95% share) in 2014/15 to US$ 549.28 (12.44% share) in 2015/16. The increase is mainly due to increases in expenditures from United Arab Emirates and Saudi Arabia of 69.64% (from US$ 196.38 in 2005/06 to 333.14 million in 2015/16) and 431.36% (from US$ 30.67 in 2005/06 to 162.97 million in 2015/16) respectively. However, the import bill from the Middle East countries tremendously reduced in 2011/12 from US$ 848.49 million to US$ 590.95 million in the next financial year (2012/13) representing a reduction of 43.58%. The European Union (EU) bloc in the European Continent was the main source of imports whose share significantly declined according to the years under review, from 20.11% in 2005/06 to 10.28% in 2015/16. Its loss of market share of Uganda import bill is attributed to the persistent increases realised by Asia which had a similar share of 26.90% in 2005/06 but was able to almost double it through the period to 51.09% in 2015/16. It’s also partly due to a significant decline in the import bill for France from US$ 159.70 million (3.93%) in 2008/09 to US$ 35.64 million (0.81%) in 2015/16 and United Kingdom from US$ 139.04 million (33.80%) in 2009/10 to US$ 65.39 million (1.48%) in 2015/16. Source: Bank of Uganda According to the figure above, Uganda decreased its import expenditure bill from the top 4 Asian Countries except those of China from the financial year 2014/15 to 2015/16. That perhaps also justifies the overall deduction in of Asia imports into the country which is a good step forward as
- 17. we try to address the issue of the trade deficit as well as implementing the import substitution strategy. For instance, Indian’s expenditure share on Uganda – Asia import bills decreased from 42.96% in 2014/15 to 37.15% in 2015/16. NOTE: Overall, the country continued to export low valued products (largely-unprocessed, primary products) as compared to the high value imported manufactured goods leading to widening trade deficit. This should be a major concern, given that agricultural practices in Uganda remain overwhelmingly subsistence-focused, providing little impetus for stimulating the growth of value added manufacturing. Does Import Dependency Pose a Threat to Domestic Manufacturers Today? In many cases, developing countries do not possess the required capacities in the industrial sector to satisfy the increasing demand for manufactures resulting from their economic and social progress and the emergence of a middle class. Accordingly, consumers as well as businesses will look abroad to purchase the required goods from other countries. Following a rapid increase in the last decade, the sectoral trade balance for manufactures accumulated to roughly 5.6 billion USD in 2010. Although the widely discussed effect of the rapidly growing demand for oil is indeed substantial, it is rather surprising to see that this only accounts for less than 40% of the current trade deficit in manufactured products. Moreover, high-technology as well as low technology manufactures also show a considerable trade deficit, while resource-based manufacturing is the only sub- category that managed to change course and generate a trade surplus along with the primary commodity sector. GROUP NAME GROUP DESCRIPTION EU27 European Union 27 Members SSA Sub-Saharan Africa COMESA Common Market for Eastern and Southern Africa EAP East Asia Pacific LAC Latin America and Caribbean MENA Middle East and North Africa NA North America SA South Asia SADC Southern African Development Community SSA Sub-Saharan Africa ECOWAS Economic Commission for West African Country