1. Measuring Adulteration of Olive Oil on GC-MS
Tim Akers: Department of Chemistry at Northern Michigan University
CH435 Gas & Liquid Chromatography
II.
The objective of thislabwasto measure the adulterationof olive oil onaGC-MS. Many companies
producingolive oil are beingexposedbyscientistsforthe lackof purityintheirproducts.Our mission
was to take differentoliveoil samplestotesttheiradulterationorlackof. In orderto do so,an optimum
methodisneededtoachieve maximumseparation of methylpalmate,methyllinoleate,methyl
lenolenate,methyl oleate,andmethyl stearate,fiveof the mainanalytesfoundinoliveoil.Byfindingan
optimummethodinseparation,derivingthe fattyacidsinthe olive oil,andanalyzingthemonaGC-MS,
the adulterationof these oilscanbe identifiedusinginformationfromtheirseparation.
Gas chromatographymassspectrometryisthe technique usedtoseparate componentsina
mixture,preparingthese componentstobe fragmentedbymassspecinorderto obtainuseful
informationsuchasthe molecularmassandbond breaksor fragmentationpatternsof those
components.Gaschromatographywasexplainedindetail inthe priorlab.Thislabincludesthe use of a
mass spectrometermachine.MSisa technique usedtoionize chemical compoundsbyintroducingthem
to a streamof electronsbyhardor soft impactthat breaksthe molecule upintodifferentfragments
basesoff theirinitial molecularmass,orby patternswhere the bondsonthe molecule are mostlikely to
break.All massspecshave an inletsystem, andionsource,amass analyzer,anda detector.The inletis
responsible forenteringthe sample intothe ionsource.A gas-phase ionsource will vaporize the sample
thenionize it,whileadesorptionsource will convertamoleculeusuallywithahighmolecularweight
directlyintogasions.Electricimpactionizationisanintense ionizationmethodusedtobreakup
componentsintosmallerfragmentstoidentifythe structure ora molecule ordifferentfunctional groups
within.Chemicalionizationisasofterionizationmethodusuallyleavingapeakthatrepresentsthe
molarmass of the compound.These ionizationmethodscanbe usedbasedoff of the type of analysis
desiredonthe analyte. The ionizedanalytes are thensenttoa mass analyzerthatseparatesthe
componentsaccordingtotheirmassto charge ratio.Ionswill follow aspecificpathbasedontheir
kineticenergyandcharge.The massanalyzerusedinthislabis a quadrupole.Thisactsbyhavingfour
parallel cylinderseachpairacrosshavingthe same charge.One pair has positive chargeswhile the other
has negative charges.Thiscreatesamagneticfieldthatcanbe alteredtoallow the passingof specific
ionsbasedoncharge and size throughthe analyzer.Ionsthatare notdesiredtobe measuredcanbe
directedtowardsthe rodsbasedoncharge and size tobe neutralized.The ionsthenare detectedand
amplifiedontoasignal to be analyzedbytheirfragmentationpatternormassto charge ratios.
The main componentsfoundinmanyoil productsare fattyacids.For the purpose of thislab,the
differentfattyacidsfoundinoilscanbe separatedandanalyzedtotestthe purityof the oils.The main
problemthatisfacedin analyzingthese fattyacidsinthe oil isthattheyhave veryhighboilingpoints.
The methodof separatingthese fattyacidsisthroughthe use of gas chromatography.The columnthat
isusedfor thislabis an RTX-Wax columnthathas a temperature thresholdof 250ᵒC. Most of the fatty
acidsfoundinolive oil have boilingpointsfarbeyondthattemperature.These analytesneedtobe
vaporizedintoagas inorder to elute throughthe column.Inorderto analyze these oils,theseanalytes
needtobe transesterfiedintofattyacidmethyl esters.Thisiscrucial todo because byaddinga methyl
2. esterontoto the fatty acids,itdecreasesthe boilingpointsmakingitpossible toperformaseparationat
the temperature thatthe columnallows.Transesterificationof fattyacidsare derivedby reactingthe
fattyacid withmethanol inthe presence of abase (sodiumhydroxide),thatresultsinthe formationof a
fattyacid methyl esterandtridecanoate.
The firstpart of thislab wasto developamethodinorderto separate the FAME mixture as
adequate aspossible. The FAME mix waspreparedbymixingitwithaninternal standardof methyl
tridecanoate.The internal standardwasmade byadding23.1µL of the standard to 976.9µL of hexane in
orderto accomplishthe same concentrationof the FAME mix.A 100µL aliquotof the internal standard
was addedto100µL of the FAME mix with800µL of hexane foratotal sample volumeof 1000µL. If the
concentrationsof the internal standard,the FAMEmix,andhexane are notthe same,it islikelythatthe
area ratiosbetweenthe sampleandthe internal standardare notthe true standardsleadingtofalse
informationregardingthe identificationandadulterationamountof the sample. The methodwas
developedbyfollowingasimilarprotocol fromThe Determination of FattyAcidMethyl Esters(FAMEs)
inMilk Matrix Using an Agilent5977E GC/MS byHaifengSun.A blankof hexane wasranto make sure
there wasno residual analytesorcompoundsleftof the column.The FAME mix wasthenseparated
accordingto the developedmethod.Itwaspredictedthatthismethodwouldbe agoodstartingpoint
for the separationof the FAME’sbecause the refrence paperwasalsoseparatingaFAME mix witha
similarCarbowax/DB-wax/opentubularcolumn.Five analyte peakswere visible along withapeakfor
the internal standard. The methodwastweakedbychangingthe flow rate toincrease separation.
The nextpart was to derive the fattyacidmethyl estersfromthe fattyacidsinthe olive oil. The
three olive oil brandsusedinthislabwere Bertolli extravirginoliveoil,Greatvalue extravirginoliveoil,
and Hysonextravirginolive oil. Inacentrifuge tube,50µLof the olive oil sample wascombinedwith
50µL of the internal standard.Anamountof 0.7 mL of 0.4 M sodiumhydroxide and methanolsolution
was reacted andmixedinanultrasonicbath.The methyl esterswerethenextractedbymixingwith0.5
mL of hexane.The methyl estersshouldhave ahigheraffinityforthe hexane.The methyl estersinthe
hexane were transferredandextractedin0.5mL portionsuntil 2mLwasextracted.Thiswasperformed
for eachof the oils.Itwas veryimportanttonot letany watergetintothe sample tubesbecause water
will cause the fattyacidsto go througha hydrolysisreactionthatwill preventthe esterificationof the
fattyacids.It is predictedthat6 peakswill resultinthe separation.A reasonthatwouldoffer
explanationtonotseeingpeaksinthe separationwouldbe thatwaterleakedintothe sample causinga
hydrolysisreaction.Thiswouldstopthe esterificationhence nofattyacidmethyl esterwouldbe
produced.Afterall the sampleswere prepared,the sampleswereseparatedonthe GC-MS accordingto
the modifiedseparationmethod.
III.
1. What is the optimum methodfor the separationof methyl palmate, methyl linoleate,methyl
linolenate,methyl oleate,andmethyl stearate on a Carbowax/DB-wax/RT-wax opentubular
column?
In optimizingamethodtoseparate these compoundsinamixture,itrequiredthe alterationof
manydifferentmethods inordertoachieve the bestseparation.The injectortemperature wasset
to 220ᵒC and the inlettemperature to250ᵒC. These temperatureswere chosenbecause the highest
3. boilingpointof the 5 analytesinthe mixture was218.5ᵒC. When the sample isfirstintroducedto
the column,a temperature iswantedthatwill transformthe samplerightintothe gasphase.With
the temperature chosen,all of the analytesinthe mix willimmediatelyvaporize uponenteringthe
column.A columntemperature of 120ᵒC waschosenbecause the lowestboilingpointof the
analytesis135ᵒC. Thisallowsall of the analytestotransformbetween the mobile andstationary
phases. The ovenstartedat a temperature of 50ᵒC, thenrampedup 25ᵒC everyminute until 200ᵒC.
Thenrampedat 3ᵒ everyminute until 230ᵒC. Thismethodwasbasedoff of:Determinationof Fatty
AcidMethyl Esters(FAMEs) inMilk Matrix Using an Agilent5977E GC/MS by HaifengSun.This
methodwassuccessful inthe separationof the FAME’sina milkmatrix.Rampingup25ᵒC every
minute until 200ᵒC will give the some of the compoundsachance to separate.Rampingitupto a
final temperature of 230ᵒC wouldallow the otheranalytestoelute.Aninitial injectionvolume of
1µL was injected,butsplit10:1. Thiswouldreduce the amountof sample enteringthe column,
expectingafasterandmore complete separation.The flowrate withthe above parameterswasset
to 1.5 mL/minto geta linearvelocityof 44.63 cm/sec.Thisresultedina complete separationof the
FAME mixtures. Toadjustthe methodtooptimize the separationbetweenthe analytesthe flow rate
was changed.Accordingtothe HETP vs.linearflow rate plot,the optimumvelocityandplate height
occurs around20 cm/sec.A flowrate of 0.67 mL/minwascalculatedto optimize the flow.Thiswas
roundedto0.70 mL/minbecause endinguponthe lowerendof the curve couldresultina more
dramaticrise in theoretical plate heightcomparedtothe rightside of the curve. Thisnew and
improvedmethodchangedresolutionfrom 1.5to 2.07. Overall,thismethodprovedtobe the bestin
separatingthe fattyacidmethyl estermix.
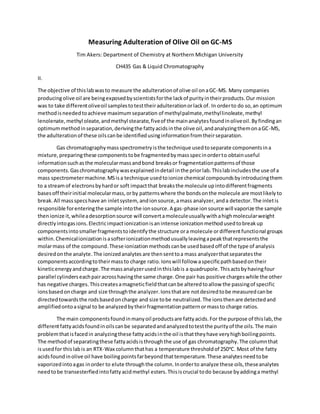
4. Figure 1. Method2 of the separationof the standardFAME mix
2. What are the retentionfactors (k) for all 5 analyte compoundsunder the optimum method?
Methyl Palmate: 𝑘 =
9.99−2.05
2.05
= 3.87
Methyl Stearate: 𝑘 =
12.16−2.05
2.05
= 4.93 𝑘 =
(𝑡 𝑅−𝑡 𝑀)
𝑡 𝑀
Methyl Oleate: 𝑘 =
12.44−2.05
2.05
= 5.07
Methyl Linoleate: 𝑘 =
13.06−2.05
2.05
= 5.37
Methyl Linolenate: 𝑘 =
13.98−2.05
2.05
= 5.82
5. 3. What is the resolution(Rs) and selectivityfactor(α) for the pair of least separatedanalyte
compounds?
LeastSeparatedpeaksare Methyl Stearate & Methyl Oleate.
𝛼 =
𝑡 𝑅4
− 𝑡 𝑀
𝑡 𝑅3
− 𝑡 𝑀
𝛼 =
12.44− 2.05
12.16− 2.05
= 1.03
𝑅 𝑠=(
√𝑁
4
)(
𝛼−1
𝛼
)(
𝑘
( 𝑘+1)
)
𝑅 𝑠=(
√166447
4
)(
1.03−1
1.03
) − (
5.0
(5.0+1)
) =2.47
4. What is the average numberof theoretical plates(N) and what is the height-equivalentof
those theoretical plates (HETP) for the pair ofleast separatedanalyte compounds usingthe
optimum method?What isthe average numberof theoretical plates(N) and what is the
height-equivalentofthose theoretical plates(HETP) for the entire separationon the column
usingthe optimum method?Are theythe same?Different?Why?
The average of the plate numberbetweenthe leastseparatedandall of the analyteswas
different.Itwasexpectedthatthe average plate numberforthe leastseparatedwouldbe lower
than the groupas a whole.The higherthe plate numberintheory,the higherthe separationand
resolutionwouldbe.The overall platenumberaverage of all the analyte plateswassignificantly
higherthanthat of the leastseparateddue toa betterseparationbetweencompoundsasa
whole thanbetweenthe leastseparated.The theoretical plate heightforthe analyte separation
as whole wasalsolower.The lowerthe theoretical plate heightis,the more the mixture is
separatedandthe higherthe resolutionwill be.Thisshouldbe differentbecause if the restof
the analyteshada decentseparation,itwill decrease the plate heightcomparedtothe least
separatedtwopeaks.
Leastseparated:
𝑁 = 16( 𝑡 𝑅/𝑤)
2
𝐻 =
𝐿
𝑁
Methyl Stearate:
𝑁 = 16 (
12.16
0.145
)
2
= 112,526
𝐻 =
29.19𝑚
112,526
= 2.59𝑒−4 𝑚
Methyl Oleate:
𝑁 = 16 (
12.44
0.106
)
2
= 220,368
6. 𝐻 =
29.19𝑚
220,368
= 1.32𝑒−4 𝑚
Average of leastseparated:
112,526 + 220,368
2
= 116,447
2.59𝑒−4 𝑚 + 1.32𝑒−4
2
= 1.96𝑒−4 𝑚
Average of all analytes:
𝑁 𝑎𝑣𝑔 =
249550 + 112526 + 220368 + 166566 + 142761
5
= 178,354
𝐻 𝑎𝑣𝑔 =
1.17𝑒−4 + 2.59𝑒−4 + 1.32𝑒−4 + 1.75𝑒−4 + 2.04𝑒−4
5
= 1.77𝑒−4
5. What are the peak areas for any of the 5 compounds identifiedinyourolive oil samples,
normalizedto the internal standard?
The peak areasof the Bertolli, Hyson,andGreatValue OliveOilsnormalizedtothe internal standard:
6. To what degree do you thinkyour olive oil is adulterated?
Bertolli Great Value Hyson
Methyl Palmate 1.6002 1.6783 0.9331
Methyl Stearate 0.0886 0.0932 0.1905
Methyl Oleate 0.3792 0.3256 0.5402
Methyl Lenoleate 4.7778 4.5557 3.3283
Methyl Lenolenate 0.6405 0.5488 0.4558
Area
7. Accordingto the ratiosof the fattyacid methyl estersof the pure olive oil tothe olive oil
samplestested,the adulteration onthe oilsseemslikelybutnottothe extentthatwas originally
predicted.Inthe ratioof the linoleicacidtothe linolenic acid,the areawouldhave tofall
between6.5433 and 9.4775 to show verylittle adulteration.Outof all of the olive oil samples
tested,fell intothe range of the pure olive oil,meaningthatthe ratiobetweenthese
componentsof the oil testedtobe prettypure. In orderfor the ratiosbetweenoleicacidand
linoleicacidtobe pure,the area range wouldneedtofall between11.1843 and 17.7387. The
Bertolli andGreatValue samplesfall intothatrange.The Hysonoil sample hada ratioof 6.1612
that doesnotcome close tothe FAME ratiorange.An explanationforthiscouldbe thaton the
bottle of the Hysonolive oil itsaysthat itis a blendof oils. Overall,accordingtothe datathe
Bertolli andGreatValue oil samplesare relativelypure compared tothe pure olive oil sample.
The Hyson olive oil samplewasnotso pure comparedtothe otheroilsandthe pure olive oil.
7. Whichcompounds correspondto which peaks in the standard mix?
Thispeakcorrespondstomethyl palmate.The peakat270.22 correspondsto the 270.45 g/mol
molarmass of methyl palmate.
Pure Bertolli Great Value Hyson
linoleic acid/linolenic acid 8.0104 ± 1.4671 7.4595 8.3012 7.3021
oleic acid/linoleic acid 14.4615 ± 3.2772 12.5997 13.9917 6.1612
Area ratios compared to internal standard
9. Thispeakcorrespondstomethyl linoleate.The peakat294.21 correspondsto the 294.47 g/mol
molarmass of methyl linoleate.
Thispeakcorrespondstomethyl linolenate.The peakat292.19 correspondstothe 292.45
g/mol molarmass of methyl linolenate.
10. 8. Identifyas many of the major peaks in your oil samplesas possible.
The followingpeakswereidentifiedinthe Hysonoil sample:
Methyl palmate: Methyl Stearate:
Methyl Oleate: Methyl Linoleate:
12. If the liquid-liquidextractionwasperformedcorrectlythe concentrationsof the internal standard
and the oil mix shouldbe the same.Incomparingthe areas of the internal standardacrossthe
differentsamplestheyall have areasbetween1.28e7
and8.89e7
. This showsconsistencybetween
the concentrationsof the internal standardcomparedtothe concentrationsof the oil sample.Also,
each oil extractionyielded6peaksinthe separation.One peakforthe internal standardandthe
otherfive peaksforthe FAMEs. Thismeansthat the extractionwentwell.If notall of these peaks
were visible,thiscouldmeanthatwatergotintothe vialsduringthe reactionandall the fattyacids
weren’testerfied.If the concentrationswere notthe same thiscouldalsomeanthatnot enoughof
sodiumhydroxidewasaddedtothe methanol,whichwouldleadtoproblemsinthe extraction.
IV.
One majorproblemthatwas encounteredinthe labistryingtomodifythe separationmethod
inorder to maximize the separationof the mixture.Inthe firstmethod,the flow wassetto1.5
mL/min.Thisresultedinseparationof all 5 analytesinthe mixture butneededtobe improved. In
orderto get to an optimal flowrate,the HETPvs. linearvelocitygraphwasusedtocalculate a
properflowrate to use that wouldresultina betterresolution.The flow rate thatwascalculated
was 0.67 mL/mincomparedtothe 1.5 mL/min. Itwas decidedthatthe flow rate shouldbe rounded
up to 0.70 mL/minto avoidhavingaflow that istoo low that will have adirecteffectonthe plate
heightandresolution.If aflowrate ischosenthat fallsonthe leftside of the optimumlinearvelocity
graph,there is a higherprobabilityitwill change the plate heightdrastically.If thismistakewas
made,an un-fitflowrate wouldleadtoanincrease of the theoretical plate height,whichcouldhave
a significantdecreaseonthe resolutionof the separation.
As mentionedabove,the concentrationsof eachcomponenttothe mixture mustmatchinorder
to properly geta solutionthatwill separate.Althoughthisdidnothappeninthislab,itisa
detrimental problemthatwouldleadtoafailure of separation.Inthe extractionstep,acalculation
error indeterminingthe amountof sodiumhydroxide todissolve inmethanol wouldleadtoafaulty
extraction.If there the methanol lacksenoughsodiumhydroxide,duringthe esterificationof the
fattyacids,not all of the fattyacids wouldgetconvertedtoa FAME. Thiswouldhave adirectresult
inthe separationbecause if there werefattyacidsleftoverinthe sample the GC-MSwouldnotbe
able to properlyconvertthe samplesintoagasto be separated.ThiswouldresultinnoFAME peaks
detectedonthe GC-MS. Anotherpotentialproblemwithanimbalancedconcentration wouldbe
fromthe ratiosof the peaksnormalizedtothe internal standard.If there wasadifference in
concentrationof the sample tothe internal standard,the ratioswouldnotmatchto those of the
literature values.A biginternal standardareadue to concentrationwoulddecrease the ratioleading
to a false sense of adulterationamongthe sample.
Overall,there were verylittleproblemsencounteredinperformingthe GC-MSanalysisof olive
oils.The resultsdemonstratethatthe Bertolli andGreatValue oil samplescontainpure oliveoil
while the Hysonsample hassome degree of adulteration.Future andrepeattestingshouldbe
performedonthese brandstoshowconsistencyinthe results.