

Recommended
More Related Content
What's hot
What's hot (16)
Similar to predator prey: Worksheet
Similar to predator prey: Worksheet (8)
More from Syed Lokman
More from Syed Lokman (20)
Recently uploaded
Recently uploaded (20)
predator prey: Worksheet
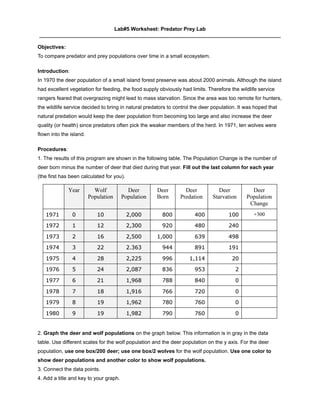
- 1. Lab#5 Worksheet: Predator Prey Lab ___________________________________________________________________________________ Objectives: To compare predator and prey populations over time in a small ecosystem. Introduction: In 1970 the deer population of a small island forest preserve was about 2000 animals. Although the island had excellent vegetation for feeding, the food supply obviously had limits. Therefore the wildlife service rangers feared that overgrazing might lead to mass starvation. Since the area was too remote for hunters, the wildlife service decided to bring in natural predators to control the deer population. It was hoped that natural predation would keep the deer population from becoming too large and also increase the deer quality (or health) since predators often pick the weaker members of the herd. In 1971, ten wolves were flown into the island. Procedures: 1. The results of this program are shown in the following table. The Population Change is the number of deer born minus the number of deer that died during that year. Fill out the last column for each year (the first has been calculated for you). 2. Graph the deer and wolf populations on the graph below. This information is in gray in the data table. Use different scales for the wolf population and the deer population on the y axis. For the deer population, use one box/200 deer; use one box/2 wolves for the wolf population. Use one color to show deer populations and another color to show wolf populations. 3. Connect the data points. 4. Add a title and key to your graph.
- 2. 5. Predator Prey Lab Exercise Date: _________________ Name :____________________________________ ID: ___________________ Graph: Questions (Graded Quiz): 1. Look at your graph. Describe the changes to the deer and wolf populations between 1971 and 1980 (years 0 and 9). Deer population: …………………………………………………………………………………………… ………………………………………………………………………………………………………………… ………………………………………………………………………………………………………………… …………………………………………………………………………………………………………….. Wolf population: …………………………………………………………………………………………… ………………………………………………………………………………………………………………… ………………………………………………………………………………………………………………… ………………………………………………………………………………………………………………..
- 3. 2. Between what years did ● the deer population have the greatest increase? ..................................... ● the deer population have the greatest decrease? ..................................... ● the wolf population have the greatest increase? ..................................... ● the wolf population have the greatest decrease? ..................................... 3. What do you think would have happened to the deer population on the island between 1971 and 1980 (years 0 and 9) if wolves had NOT been introduced? ………………………………………………………………………………………………………………………… ………………………………………………………………………………………………………………………… ………………………………………………………………………………………………………………………… ………………………………………………………………………………………………………………………… ………………………………………………………………………………………………………………………… ………………………………………………………………………………………………………………………. 4. Predict what happened to the size of the deer population after 1980 (year 9). Explain your prediction. ………………………………………………………………………………………………………………………… ………………………………………………………………………………………………………………………… ………………………………………………………………………………………………………………………… ………………………………………………………………………………………………………………………… ………………………………………………………………………………………………………………………… ……………………………………………………………………………………………………………………….. 5. Predict what your graph would look like when the ecosystem reached carrying capacity. Recall that carrying capacity is the maximum population of a given species that can survive indefinitely in a given environment. ………………………………………………………………………………………………………………………… ………………………………………………………………………………………………………………………… ………………………………………………………………………………………………………………………… ………………………………………………………………………………………………………………………… ………………………………………………………………………………………………………………………… ……………………………………………………………………………………………………………………….