SlideShare a Scribd company logo
1 of 4
Download to read offline
A Brief Report on REITs and the Indian Connect 2016
1 Sources: NAREIT website and reports, and other publically available sources
Real Estate Investment Trusts (REITs)
Real estate investment trusts (‘REITs’) have been
around for more than fifty years. REITs were first
created when President Eisenhower signed into law
the REIT Act in 1960, to allow individual investors to
invest in large-scale, income-producing real estate.
What is a REIT?
A REIT is a company that owns – and typically
operates – income-producing real estate or real
estate-related assets. The difference between REITs
and other real estate companies is that a REIT must
acquire and develop its real estate properties primarily
to operate them as part of its own investment portfolio,
as opposed to reselling those properties after they
have been developed.
The Three Categories of REITs: Equity,
Mortgage, and Hybrid
 Equity REITs typically own and operate
income-producing real estate
 Mortgage REITs provide money to real estate
owners and operators either directly in the
form of mortgages or other types of real estate
loans, or indirectly through the acquisition of
mortgage-backed securities
 Hybrid REITs generally are companies that
use the investment strategies of both equity
REITs and mortgage REITs
Publicly Traded REITs and Non-Traded
REITs
Many REITs (whether equity or mortgage) are
registered with the SEC and are publicly traded on a
stock exchange. These are known as publicly traded
REITs. In addition, there are REITs that are registered
with the SEC, but are not publicly traded. These are
known as non-traded REITs (also known as Public
Non-Listed REITs (PNLRs)). Such REITs do file
reports with the SEC but there is no independent
information about the share value available. The
company may provide and estimated share value 18
months after the offering has closed.
Advantages of REITs
Evolution of REITs
1960
Introduction
of REITs
1965-1975
Dominance
of Mortgage
REITs
1976
Tax Reform Act
authorized REITs to be
established as
corporations in addition
to business trusts
1986
Tax Reform Act
made equity
REITs popular
1997-2007
Numerous
REITs offerings
2014
Paramount
launched IPO to
raised $2.3bn
Factors Driving REIT Earnings
The key demand drivers for revenue generation for
REITs are:
 An uptick in economic fundamentals
positively affects REITs by increasing
business growth
 The strength of job market fuels the demand
for the housing, office, and hotel industry
 Rising population results in greater demand
for apartments, hotels, and warehouses units
 Higher occupancy rates leads to higher
income
 With higher mortgage rates, renting an
apartment becomes more appealing, further
leading to a rise in occupancy rates
 Rising interest rates can hurt REITs in many
ways
A Brief Report on REITs and the Indian Connect 2016
2 Sources: NAREIT website and reports, and other publically available sources
REITs Valuation Techniques
Traditional valuation methods don’t apply to REITs
because their operations are different from traditional
companies. REITs are valued based on three main
techniques namely:
 Net Asset Value (NAV) is one of the most
important valuation metrics for REITs. NAV is
the market value of all the assets, including
cash and indirect property assets, net of
liabilities and deliberated dividends or
distributions. A high NAV indicates that REITS
have strong earning potential and good
management
 Fund from Operations (FFOs) is a measure
to evaluate the cash generated from their
operations. It is calculated as net income +
depreciation and amortization + impairment
charges + losses from sale of property – gains
from sale of property
 Adjusted Fund From Operations (AFFOs)
further deducts the capital expenditures
required to maintain the existing portfolio of
properties
How is the Global Listed Property Market
Configured?
As earlier stated, REITs were introduced in the US in
1960. For the next 30 years, REITs were largely
confined to the US and Australia. The major growth of
REITs happened only after 2000 when some of the
key Asian countries introduced REITs. Japan adopted
REITs in 2000. It was followed by Singapore in 2002
and Hong Kong in 2003. While France was the first
major European country to launch REITs in 2003, the
United Kingdom & Germany introduced REITs in 2007.
REIT Indexes
The most common index for the REIT and global listed
property market is the FTSE EPRA/NAREIT Global
Real Estate Index Series. It constitutes of both REITs
and non-REIT listed property companies. The Global
Index Series contains the Developed Markets indices
and the Emerging Markets indices.
Industry Snapshot
(Monthly data for
February 2016)
FTSE NAREIT All
REITs
FTSE NAREIT All
Equity REITs
Equity Market
Capitalization
$901bn $846bn
Yield Comparison
4.51% 4.05%
Leverage &
Coverage Ratios
Debt Ratio 46.4% 36.0%
Coverage Ratio 4.0x 4.3x
Fixed Charge
Ratio
3.7x 3.9x
Investment Grade 46 (67% by M.Cap.) 46 (67% by M.Cap.)
(Balance sheet data as of Q3 2015)
S&P 500: 2.24%
 221 REITs are in the FTSE NAREIT All REITs
Index
 196 REITs trade on the NYSE
 NYSE listed REITs equity market
capitalization = $853bn
 Stock exchange-listed REITs paid out
approximately $42bn and PNLRs paid out
approximately $4bn in dividends during 2014
Capital Offerings:
(2016: YTD)
Capital
Raised (mm)
Number of
Offerings
IPOs 0 0
Secondary Common $2,764 8
Secondary Preferred $300 1
Secondary Debt $7,700 13
Total $10,764 22
A Brief Report on REITs and the Indian Connect 2016
3 Sources: NAREIT website and reports, and other publically available sources
Overview of US REITS
By the end of 2014 REITs in the US owned nearly $3
trillion of gross real estate assets. Public listed REITs
saw their combined equity market capitalization grow
from the end of 1990 at a 21% compound annual rate,
from $9bn to nearly $950bn at the end of 2015.
Public listed equity REITs constitute the bulk of today’s
REIT market. As of year-end 2014, equity REITs
accounted for more than 70% of all US public listed
REIT gross assets and more than 90% of the
approximately $950bn of equity market capitalization.
Economic contribution of REITs in the US
An EY study (commissioned by the NAREIT) to
estimate the economic impact of REITs on the US
economy for 2014 revealed:
 Their total economic contribution in 2014 was
an estimated 1.8mm full-time equivalent (FTE)
jobs and $107.5bn of labor income
 REIT activities also resulted in the payment of
an estimated $44bn of interest income and the
distribution of $81.6bn of dividends in 2014
 REITs invested $55.9bn in new construction
and routine capital expenditures to maintain
existing property in 2014
US REIT Merger and Acquisition Activity
Between 2004 and 2016, US REIT Industry saw M&A
deals to the tune of US$293bn, with Public to public
deals making 64% of the total deals.
$14
$6
$47
$11
$5 $6
$24
$13
$30
$16 $16
$0
$9
$35
$87
$0 $0
$5
$1
$29
2004 2005 2006 2007 2008 2010 2011 2012 2013 2014 2016
Public to Public (in bn) Public to Private (in bn)
(YE March 31st)
US Real Estate Indicators
Even though the US economy appears to have
entered into a “goldilocks” environment, in which its
growth trajectory remains solid and inflation remains
low against continued global economic concerns, one
would never know it based on the REIT stock price
roller coaster. Along with the broader stock market, as
represented by the S&P 500 Index, REITs had
declined substantially for 2016 through mid-February,
only to roar back over the intervening six weeks. This
volatility occurred even though property fundamentals
and REIT earnings remain solid and are still growing.
Listed Real Estate Market Performance
 REITs and the S&P 500 Index increased by
10.0% and 6.8%, respectively in March 2016
 In possibly another indication of the industry
being in the later innings of the cycle, with the
exception of the apartments sector (with
expectations of 6% NOI growth), the other
core sectors (industrials, regional mall, office,
community retail, hotel, and health care) are
expecting property performance in a fairly
narrow band between 2.5% and 4.0%.
 With annualized three-month volume of
$535bn, property transactions are still at fairly
high levels, but are now pacing even with last
year rather than showing year-over-year
increases
 REITs now trade in line to NAV, which is
slightly below the sector’s long-term 3%
average premium
 REITs are trading at an approximately 17.9
P/FFO multiple, which is 1.6 above the
sector’s long-term average of 16.3
US Real Estate Market Returns
(%cumulative) All REITs Equity REITs REIT Preferred S&P500
1 Month 10.0% 10.2% 3.3% 6.8%
YTD 5.9% 5.8% 2.7% 1.3%
1 Year 4.1% 4.7% 5.6% 1.8%
3 Years 30.2% 32.6% 19.8% 39.8%
5 Years 71.5% 72.8% 45.6% 72.9%
(As of March 31, 2016)
A Brief Report on REITs and the Indian Connect 2016
4 Sources: NAREIT website and reports, and other publically available sources
Opening Doors to REITs in India and China
While institutional and retail investors have had a
sampling of Asian real estate through REITs, in a
sense they still have been shut out of the continent’s
most significant economies, China and India.
As of mid-2014, China had a population of 1.4bn, and
India, 1.2bn, according to the CIA World Factbook.
These countries have witnessed growth in GDP much
greater than their developed counterparts.
However, for now, India has a head start on China.
While the guidelines were issued by the Securities and
Exchange Board of India (SEBI) last year on REITs
and so-called infrastructure investment trusts (InvITs),
it is only in February this year, that Budget 2016
cleared Dividend Distribution Tax (DDT) hurdle in
making REITs reality in India.
Importance of REITs in Indian Context
A REIT could:
 Provide an attractive alternative investment
instrument in the Indian financial markets
 Help in bringing the much required
professionalism and transparency in the
real estate sector in India
 Provide developers and large investors of
commercial real estate to tap into the REITs
for investment in the real estate assets
Conducive Investment Environment
 Growing economy could be a key driver for
growth of the REIT regime in the Indian
market
 Increasing working age population will push
the demand and promote the development of
commercial real estate
 Housing and urban infrastructure
requirement will be needed to support the
increasing population
 Disposable income and retirement savings
gives individuals flexibility to invest in long-
term investment options for future savings
 India is one of the countries globally offering
affordable prime spaces, with high growth
potential
The Potential
 The top seven cities of India together have
more than 400mm sqft of operational office
space, according to Mr. Raheja of K Raheja
Corp. This is expected to grow by approx.
25mm to 30mm sqft annually. Of this, more
than 150mm sqft will be ready for REIT listing
 Embassy Office Parks, a joint venture
between Embassy Group and Blackstone,
holds 22 mm sqft of space in three cities,
including Bangalore
 Mr. Anuj Puri, JJL Chairman, adds that
currently, approx. 229mm sqft of office space
in India can be seen as REIT-compliant, and
assuming even 50% of these get listed, we are
looking at a total REITs listing worth $18.5bn
 India needs to develop almost 45mm to 50mm
housing units by 2028
Key Regulations relating to Indian REIT
Initially proposed in December 2008 by the SEBI, the
2014 SEBI REIT Regulations have been notified.
 Offer and listing: Initial offer of units through
public issue to third parties, with mandatory
listing
 Minimum subscription: INR 2lakh (primary
market)
 Trading lot size: INR 1lakh (secondary
market)
 Dividend income: At least 90% of the
distributable cash flow must be distributed and
at least twice a year
 Transparency: REIT, through a valuer, will
undertake full valuation on a yearly basis and
update the same on a half-yearly basis and
declare NAV within 15 days from the date of
such valuation / updation
 Diversification: REITs will have to invest in at
least two projects. Not more than 60% value of
assets will be in one project
 Property concentration: Not less than 80%
of the assets should be invested in completed
and revenue generating properties
 Sponsor commitment: Sponsors must hold
25% of the units for first three years and 15%
thereafter

More Related Content

What's hot

Quarterly Market Review: Second Quarter 2017
Quarterly Market Review: Second Quarter 2017Quarterly Market Review: Second Quarter 2017
Quarterly Market Review: Second Quarter 2017Joseph Anderson
 
2020.Q3 - Quarterly Market Review
2020.Q3 - Quarterly Market Review2020.Q3 - Quarterly Market Review
2020.Q3 - Quarterly Market ReviewMark Beal, CFP®
 
Baer Wealth - 2019 market review
Baer Wealth - 2019 market reviewBaer Wealth - 2019 market review
Baer Wealth - 2019 market reviewMark Beal, CFP®
 
Quarterly market review q3 2018
Quarterly market review   q3 2018Quarterly market review   q3 2018
Quarterly market review q3 2018Mark Beal, CFP®
 
Annual market review - 2018
Annual market review - 2018Annual market review - 2018
Annual market review - 2018Mark Beal, CFP®
 
2018 Q3 Quarterly Market Commentary
2018 Q3 Quarterly Market Commentary2018 Q3 Quarterly Market Commentary
2018 Q3 Quarterly Market CommentarySusan Langdon
 
Baer Wealth - Quarterly Market Review - Q3 2019
Baer Wealth - Quarterly Market Review - Q3 2019Baer Wealth - Quarterly Market Review - Q3 2019
Baer Wealth - Quarterly Market Review - Q3 2019Mark Beal, CFP®
 
2020.Q1 - Quarterly Market Review
2020.Q1 - Quarterly Market Review2020.Q1 - Quarterly Market Review
2020.Q1 - Quarterly Market ReviewMark Beal, CFP®
 
Griffon monthly February 2018
Griffon monthly February 2018Griffon monthly February 2018
Griffon monthly February 2018Griffon Capital
 
Quarterly Market Review - Q2 2021
Quarterly Market Review - Q2 2021Quarterly Market Review - Q2 2021
Quarterly Market Review - Q2 2021Mark Beal, CFP®
 
Quarterly market review - Q4 2018
Quarterly market review - Q4 2018Quarterly market review - Q4 2018
Quarterly market review - Q4 2018Mark Beal, CFP®
 
Baer Wealth Management Q3
Baer Wealth Management Q3Baer Wealth Management Q3
Baer Wealth Management Q3Mikol McMeen
 
Wealth X billionaire census 2018
Wealth X billionaire census 2018Wealth X billionaire census 2018
Wealth X billionaire census 2018Manny Fernandez
 
2021.Q3 - Quarterly Market Review
2021.Q3 - Quarterly Market Review2021.Q3 - Quarterly Market Review
2021.Q3 - Quarterly Market ReviewMark Beal, CFP®
 
Quarterly market review (qmr) q4 2017 (rr)
Quarterly market review (qmr)   q4 2017 (rr)Quarterly market review (qmr)   q4 2017 (rr)
Quarterly market review (qmr) q4 2017 (rr)mclean8200
 

What's hot (20)

Q4 2011 Report
Q4 2011 ReportQ4 2011 Report
Q4 2011 Report
 
Quarterly Market Review: Second Quarter 2017
Quarterly Market Review: Second Quarter 2017Quarterly Market Review: Second Quarter 2017
Quarterly Market Review: Second Quarter 2017
 
2020.Q3 - Quarterly Market Review
2020.Q3 - Quarterly Market Review2020.Q3 - Quarterly Market Review
2020.Q3 - Quarterly Market Review
 
Baer Wealth - 2019 market review
Baer Wealth - 2019 market reviewBaer Wealth - 2019 market review
Baer Wealth - 2019 market review
 
Q3 2020 Market Review
Q3 2020 Market Review Q3 2020 Market Review
Q3 2020 Market Review
 
Quarterly market review q3 2018
Quarterly market review   q3 2018Quarterly market review   q3 2018
Quarterly market review q3 2018
 
Annual market review - 2018
Annual market review - 2018Annual market review - 2018
Annual market review - 2018
 
2018 Q3 Quarterly Market Commentary
2018 Q3 Quarterly Market Commentary2018 Q3 Quarterly Market Commentary
2018 Q3 Quarterly Market Commentary
 
Baer Wealth - Quarterly Market Review - Q3 2019
Baer Wealth - Quarterly Market Review - Q3 2019Baer Wealth - Quarterly Market Review - Q3 2019
Baer Wealth - Quarterly Market Review - Q3 2019
 
Annual market review 2017
Annual market review 2017Annual market review 2017
Annual market review 2017
 
2020.Q1 - Quarterly Market Review
2020.Q1 - Quarterly Market Review2020.Q1 - Quarterly Market Review
2020.Q1 - Quarterly Market Review
 
Financial Synergies | Q3 2020 Quarterly Market Review
Financial Synergies | Q3 2020 Quarterly Market ReviewFinancial Synergies | Q3 2020 Quarterly Market Review
Financial Synergies | Q3 2020 Quarterly Market Review
 
Griffon monthly February 2018
Griffon monthly February 2018Griffon monthly February 2018
Griffon monthly February 2018
 
Quarterly Market Review - Q2 2021
Quarterly Market Review - Q2 2021Quarterly Market Review - Q2 2021
Quarterly Market Review - Q2 2021
 
Quarterly market review - Q4 2018
Quarterly market review - Q4 2018Quarterly market review - Q4 2018
Quarterly market review - Q4 2018
 
Baer Wealth Management Q3
Baer Wealth Management Q3Baer Wealth Management Q3
Baer Wealth Management Q3
 
Wealth X billionaire census 2018
Wealth X billionaire census 2018Wealth X billionaire census 2018
Wealth X billionaire census 2018
 
2021.Q3 - Quarterly Market Review
2021.Q3 - Quarterly Market Review2021.Q3 - Quarterly Market Review
2021.Q3 - Quarterly Market Review
 
Quarterly market review (qmr) q4 2017 (rr)
Quarterly market review (qmr)   q4 2017 (rr)Quarterly market review (qmr)   q4 2017 (rr)
Quarterly market review (qmr) q4 2017 (rr)
 
Financial Synergies | Q2 2018 Quarterly Market Review
Financial Synergies | Q2 2018 Quarterly Market ReviewFinancial Synergies | Q2 2018 Quarterly Market Review
Financial Synergies | Q2 2018 Quarterly Market Review
 

Viewers also liked

TripleClicks.com
TripleClicks.comTripleClicks.com
TripleClicks.comBasri Mukri
 
A brief report on ret is and the indian connect (1)
A brief report on ret is and the indian connect (1)A brief report on ret is and the indian connect (1)
A brief report on ret is and the indian connect (1)Sharansh Maheshwary
 
Parental control windows_7[1]
Parental control windows_7[1]Parental control windows_7[1]
Parental control windows_7[1]Ekky Risky
 
Liberalism, law and the state (Philo101)
Liberalism, law and the state (Philo101)Liberalism, law and the state (Philo101)
Liberalism, law and the state (Philo101)Google
 
Solid and Hazardous Waste
Solid and Hazardous WasteSolid and Hazardous Waste
Solid and Hazardous WasteGoogle
 
Lichens
LichensLichens
LichensGoogle
 
goBellaVita - Key in New Enrollment
goBellaVita - Key in New Enrollment goBellaVita - Key in New Enrollment
goBellaVita - Key in New Enrollment BellaVita Malaysia
 
Jbptitbpp gdl-jemmigumil-30922-3-2008ta-2
Jbptitbpp gdl-jemmigumil-30922-3-2008ta-2Jbptitbpp gdl-jemmigumil-30922-3-2008ta-2
Jbptitbpp gdl-jemmigumil-30922-3-2008ta-2Yoel Begal
 

Viewers also liked (14)

cv
cvcv
cv
 
TripleClicks.com
TripleClicks.comTripleClicks.com
TripleClicks.com
 
A brief report on ret is and the indian connect (1)
A brief report on ret is and the indian connect (1)A brief report on ret is and the indian connect (1)
A brief report on ret is and the indian connect (1)
 
Parental control windows_7[1]
Parental control windows_7[1]Parental control windows_7[1]
Parental control windows_7[1]
 
SFI
SFISFI
SFI
 
Liberalism, law and the state (Philo101)
Liberalism, law and the state (Philo101)Liberalism, law and the state (Philo101)
Liberalism, law and the state (Philo101)
 
Minit mesy. linus
Minit mesy. linusMinit mesy. linus
Minit mesy. linus
 
Solid and Hazardous Waste
Solid and Hazardous WasteSolid and Hazardous Waste
Solid and Hazardous Waste
 
Lichens
LichensLichens
Lichens
 
Deming’s 14 points
Deming’s 14 pointsDeming’s 14 points
Deming’s 14 points
 
goBellaVita - Key in New Enrollment
goBellaVita - Key in New Enrollment goBellaVita - Key in New Enrollment
goBellaVita - Key in New Enrollment
 
empowr
empowrempowr
empowr
 
Jbptitbpp gdl-jemmigumil-30922-3-2008ta-2
Jbptitbpp gdl-jemmigumil-30922-3-2008ta-2Jbptitbpp gdl-jemmigumil-30922-3-2008ta-2
Jbptitbpp gdl-jemmigumil-30922-3-2008ta-2
 
Just Dial PPT
Just Dial PPTJust Dial PPT
Just Dial PPT
 

Similar to A brief report on REITs and the Indian connect

Debunking Reit Yields (CCC)
Debunking Reit Yields (CCC)Debunking Reit Yields (CCC)
Debunking Reit Yields (CCC)Jon Beckett
 
Need of REIT and its prospective implication in india- phoenix mall case study
Need of REIT and its prospective implication in india- phoenix mall case studyNeed of REIT and its prospective implication in india- phoenix mall case study
Need of REIT and its prospective implication in india- phoenix mall case studyAjinkya jagtap
 
May 2015 real estate securities funds monitor
May  2015  real estate securities funds monitorMay  2015  real estate securities funds monitor
May 2015 real estate securities funds monitorConsiliacapital
 
India macroeconomic indicators
India macroeconomic indicatorsIndia macroeconomic indicators
India macroeconomic indicatorsSoham Pablo
 
Pitch book 2017_unicorn_report
Pitch book 2017_unicorn_reportPitch book 2017_unicorn_report
Pitch book 2017_unicorn_reportLudwig Preller
 
Venture Capital Investment Q3 '06 - MoneyTree
 	Venture Capital Investment Q3 '06 - MoneyTree  	Venture Capital Investment Q3 '06 - MoneyTree
Venture Capital Investment Q3 '06 - MoneyTree mensa25
 
Weltweiter IPO-Markt schwächelt
Weltweiter IPO-Markt schwächeltWeltweiter IPO-Markt schwächelt
Weltweiter IPO-Markt schwächeltEY
 
Investing in US core real estate
Investing in US core real estateInvesting in US core real estate
Investing in US core real estatecutmytaxes
 
study_id71266_reits-market-worldwide.pptx
study_id71266_reits-market-worldwide.pptxstudy_id71266_reits-market-worldwide.pptx
study_id71266_reits-market-worldwide.pptxOualidAmadide
 
REIT Returns and Interest Rates: Correcting an "Urban Legend"
REIT Returns and Interest Rates: Correcting an "Urban Legend"REIT Returns and Interest Rates: Correcting an "Urban Legend"
REIT Returns and Interest Rates: Correcting an "Urban Legend"Brad Case, PhD, CFA, CAIA
 
2018 Q1 Quarterly Market Review
2018 Q1 Quarterly Market Review 2018 Q1 Quarterly Market Review
2018 Q1 Quarterly Market Review Susan Langdon
 
Pursuing_a_Better_Investment_Experience_Slides
Pursuing_a_Better_Investment_Experience_SlidesPursuing_a_Better_Investment_Experience_Slides
Pursuing_a_Better_Investment_Experience_SlidesEddy Mejlholm
 
Equity Update - November 2018
Equity Update - November 2018Equity Update - November 2018
Equity Update - November 2018iciciprumf
 
Q1 2019 Quarterly Market Review
Q1 2019 Quarterly Market ReviewQ1 2019 Quarterly Market Review
Q1 2019 Quarterly Market ReviewSusan Langdon
 
2014 ULI Emerging Trends in Real Estate
2014 ULI Emerging Trends in Real Estate2014 ULI Emerging Trends in Real Estate
2014 ULI Emerging Trends in Real EstateDylan Simon
 

Similar to A brief report on REITs and the Indian connect (20)

Debunking Reit Yields (CCC)
Debunking Reit Yields (CCC)Debunking Reit Yields (CCC)
Debunking Reit Yields (CCC)
 
Need of REIT and its prospective implication in india- phoenix mall case study
Need of REIT and its prospective implication in india- phoenix mall case studyNeed of REIT and its prospective implication in india- phoenix mall case study
Need of REIT and its prospective implication in india- phoenix mall case study
 
Need of REIT and its prospective implication in india- phoenix mall case study
Need of REIT and its prospective implication in india- phoenix mall case studyNeed of REIT and its prospective implication in india- phoenix mall case study
Need of REIT and its prospective implication in india- phoenix mall case study
 
May 2015 real estate securities funds monitor
May  2015  real estate securities funds monitorMay  2015  real estate securities funds monitor
May 2015 real estate securities funds monitor
 
India macroeconomic indicators
India macroeconomic indicatorsIndia macroeconomic indicators
India macroeconomic indicators
 
Pitch book 2017_unicorn_report
Pitch book 2017_unicorn_reportPitch book 2017_unicorn_report
Pitch book 2017_unicorn_report
 
Venture Capital Investment Q3 '06 - MoneyTree
 	Venture Capital Investment Q3 '06 - MoneyTree  	Venture Capital Investment Q3 '06 - MoneyTree
Venture Capital Investment Q3 '06 - MoneyTree
 
WFE 2018 IOMA Derivatives Report
WFE 2018 IOMA Derivatives Report WFE 2018 IOMA Derivatives Report
WFE 2018 IOMA Derivatives Report
 
Weltweiter IPO-Markt schwächelt
Weltweiter IPO-Markt schwächeltWeltweiter IPO-Markt schwächelt
Weltweiter IPO-Markt schwächelt
 
Investing in US core real estate
Investing in US core real estateInvesting in US core real estate
Investing in US core real estate
 
study_id71266_reits-market-worldwide.pptx
study_id71266_reits-market-worldwide.pptxstudy_id71266_reits-market-worldwide.pptx
study_id71266_reits-market-worldwide.pptx
 
REIT Returns and Interest Rates: Correcting an "Urban Legend"
REIT Returns and Interest Rates: Correcting an "Urban Legend"REIT Returns and Interest Rates: Correcting an "Urban Legend"
REIT Returns and Interest Rates: Correcting an "Urban Legend"
 
2018 Q1 Quarterly Market Review
2018 Q1 Quarterly Market Review 2018 Q1 Quarterly Market Review
2018 Q1 Quarterly Market Review
 
Pursuing_a_Better_Investment_Experience_Slides
Pursuing_a_Better_Investment_Experience_SlidesPursuing_a_Better_Investment_Experience_Slides
Pursuing_a_Better_Investment_Experience_Slides
 
Equity Update - November 2018
Equity Update - November 2018Equity Update - November 2018
Equity Update - November 2018
 
Q1 2019 Quarterly Market Review
Q1 2019 Quarterly Market ReviewQ1 2019 Quarterly Market Review
Q1 2019 Quarterly Market Review
 
ListedLeads
ListedLeadsListedLeads
ListedLeads
 
Investment Insights June 2017
Investment Insights June 2017Investment Insights June 2017
Investment Insights June 2017
 
2014 ULI Emerging Trends in Real Estate
2014 ULI Emerging Trends in Real Estate2014 ULI Emerging Trends in Real Estate
2014 ULI Emerging Trends in Real Estate
 
Real Estate trends in 2014
Real Estate trends in 2014Real Estate trends in 2014
Real Estate trends in 2014
 

Recently uploaded

Machine learning classification ppt.ppt
Machine learning classification  ppt.pptMachine learning classification  ppt.ppt
Machine learning classification ppt.pptamreenkhanum0307
 
办理学位证纽约大学毕业证(NYU毕业证书)原版一比一
办理学位证纽约大学毕业证(NYU毕业证书)原版一比一办理学位证纽约大学毕业证(NYU毕业证书)原版一比一
办理学位证纽约大学毕业证(NYU毕业证书)原版一比一fhwihughh
 
Defining Constituents, Data Vizzes and Telling a Data Story
Defining Constituents, Data Vizzes and Telling a Data StoryDefining Constituents, Data Vizzes and Telling a Data Story
Defining Constituents, Data Vizzes and Telling a Data StoryJeremy Anderson
 
Multiple time frame trading analysis -brianshannon.pdf
Multiple time frame trading analysis -brianshannon.pdfMultiple time frame trading analysis -brianshannon.pdf
Multiple time frame trading analysis -brianshannon.pdfchwongval
 
专业一比一美国俄亥俄大学毕业证成绩单pdf电子版制作修改
专业一比一美国俄亥俄大学毕业证成绩单pdf电子版制作修改专业一比一美国俄亥俄大学毕业证成绩单pdf电子版制作修改
专业一比一美国俄亥俄大学毕业证成绩单pdf电子版制作修改yuu sss
 
DBA Basics: Getting Started with Performance Tuning.pdf
DBA Basics: Getting Started with Performance Tuning.pdfDBA Basics: Getting Started with Performance Tuning.pdf
DBA Basics: Getting Started with Performance Tuning.pdfJohn Sterrett
 
Consent & Privacy Signals on Google *Pixels* - MeasureCamp Amsterdam 2024
Consent & Privacy Signals on Google *Pixels* - MeasureCamp Amsterdam 2024Consent & Privacy Signals on Google *Pixels* - MeasureCamp Amsterdam 2024
Consent & Privacy Signals on Google *Pixels* - MeasureCamp Amsterdam 2024thyngster
 
2006_GasProcessing_HB (1).pdf HYDROCARBON PROCESSING
2006_GasProcessing_HB (1).pdf HYDROCARBON PROCESSING2006_GasProcessing_HB (1).pdf HYDROCARBON PROCESSING
2006_GasProcessing_HB (1).pdf HYDROCARBON PROCESSINGmarianagonzalez07
 
Predictive Analysis for Loan Default Presentation : Data Analysis Project PPT
Predictive Analysis for Loan Default  Presentation : Data Analysis Project PPTPredictive Analysis for Loan Default  Presentation : Data Analysis Project PPT
Predictive Analysis for Loan Default Presentation : Data Analysis Project PPTBoston Institute of Analytics
 
科罗拉多大学波尔得分校毕业证学位证成绩单-可办理
科罗拉多大学波尔得分校毕业证学位证成绩单-可办理科罗拉多大学波尔得分校毕业证学位证成绩单-可办理
科罗拉多大学波尔得分校毕业证学位证成绩单-可办理e4aez8ss
 
原版1:1定制南十字星大学毕业证(SCU毕业证)#文凭成绩单#真实留信学历认证永久存档
原版1:1定制南十字星大学毕业证(SCU毕业证)#文凭成绩单#真实留信学历认证永久存档原版1:1定制南十字星大学毕业证(SCU毕业证)#文凭成绩单#真实留信学历认证永久存档
原版1:1定制南十字星大学毕业证(SCU毕业证)#文凭成绩单#真实留信学历认证永久存档208367051
 
While-For-loop in python used in college
While-For-loop in python used in collegeWhile-For-loop in python used in college
While-For-loop in python used in collegessuser7a7cd61
 
20240419 - Measurecamp Amsterdam - SAM.pdf
20240419 - Measurecamp Amsterdam - SAM.pdf20240419 - Measurecamp Amsterdam - SAM.pdf
20240419 - Measurecamp Amsterdam - SAM.pdfHuman37
 
Student Profile Sample report on improving academic performance by uniting gr...
Student Profile Sample report on improving academic performance by uniting gr...Student Profile Sample report on improving academic performance by uniting gr...
Student Profile Sample report on improving academic performance by uniting gr...Seán Kennedy
 
Easter Eggs From Star Wars and in cars 1 and 2
Easter Eggs From Star Wars and in cars 1 and 2Easter Eggs From Star Wars and in cars 1 and 2
Easter Eggs From Star Wars and in cars 1 and 217djon017
 
Identifying Appropriate Test Statistics Involving Population Mean
Identifying Appropriate Test Statistics Involving Population MeanIdentifying Appropriate Test Statistics Involving Population Mean
Identifying Appropriate Test Statistics Involving Population MeanMYRABACSAFRA2
 
PKS-TGC-1084-630 - Stage 1 Proposal.pptx
PKS-TGC-1084-630 - Stage 1 Proposal.pptxPKS-TGC-1084-630 - Stage 1 Proposal.pptx
PKS-TGC-1084-630 - Stage 1 Proposal.pptxPramod Kumar Srivastava
 
Call Girls In Dwarka 9654467111 Escorts Service
Call Girls In Dwarka 9654467111 Escorts ServiceCall Girls In Dwarka 9654467111 Escorts Service
Call Girls In Dwarka 9654467111 Escorts ServiceSapana Sha
 
Effects of Smartphone Addiction on the Academic Performances of Grades 9 to 1...
Effects of Smartphone Addiction on the Academic Performances of Grades 9 to 1...Effects of Smartphone Addiction on the Academic Performances of Grades 9 to 1...
Effects of Smartphone Addiction on the Academic Performances of Grades 9 to 1...limedy534
 

Recently uploaded (20)

Machine learning classification ppt.ppt
Machine learning classification  ppt.pptMachine learning classification  ppt.ppt
Machine learning classification ppt.ppt
 
办理学位证纽约大学毕业证(NYU毕业证书)原版一比一
办理学位证纽约大学毕业证(NYU毕业证书)原版一比一办理学位证纽约大学毕业证(NYU毕业证书)原版一比一
办理学位证纽约大学毕业证(NYU毕业证书)原版一比一
 
Defining Constituents, Data Vizzes and Telling a Data Story
Defining Constituents, Data Vizzes and Telling a Data StoryDefining Constituents, Data Vizzes and Telling a Data Story
Defining Constituents, Data Vizzes and Telling a Data Story
 
Multiple time frame trading analysis -brianshannon.pdf
Multiple time frame trading analysis -brianshannon.pdfMultiple time frame trading analysis -brianshannon.pdf
Multiple time frame trading analysis -brianshannon.pdf
 
专业一比一美国俄亥俄大学毕业证成绩单pdf电子版制作修改
专业一比一美国俄亥俄大学毕业证成绩单pdf电子版制作修改专业一比一美国俄亥俄大学毕业证成绩单pdf电子版制作修改
专业一比一美国俄亥俄大学毕业证成绩单pdf电子版制作修改
 
Call Girls in Saket 99530🔝 56974 Escort Service
Call Girls in Saket 99530🔝 56974 Escort ServiceCall Girls in Saket 99530🔝 56974 Escort Service
Call Girls in Saket 99530🔝 56974 Escort Service
 
DBA Basics: Getting Started with Performance Tuning.pdf
DBA Basics: Getting Started with Performance Tuning.pdfDBA Basics: Getting Started with Performance Tuning.pdf
DBA Basics: Getting Started with Performance Tuning.pdf
 
Consent & Privacy Signals on Google *Pixels* - MeasureCamp Amsterdam 2024
Consent & Privacy Signals on Google *Pixels* - MeasureCamp Amsterdam 2024Consent & Privacy Signals on Google *Pixels* - MeasureCamp Amsterdam 2024
Consent & Privacy Signals on Google *Pixels* - MeasureCamp Amsterdam 2024
 
2006_GasProcessing_HB (1).pdf HYDROCARBON PROCESSING
2006_GasProcessing_HB (1).pdf HYDROCARBON PROCESSING2006_GasProcessing_HB (1).pdf HYDROCARBON PROCESSING
2006_GasProcessing_HB (1).pdf HYDROCARBON PROCESSING
 
Predictive Analysis for Loan Default Presentation : Data Analysis Project PPT
Predictive Analysis for Loan Default  Presentation : Data Analysis Project PPTPredictive Analysis for Loan Default  Presentation : Data Analysis Project PPT
Predictive Analysis for Loan Default Presentation : Data Analysis Project PPT
 
科罗拉多大学波尔得分校毕业证学位证成绩单-可办理
科罗拉多大学波尔得分校毕业证学位证成绩单-可办理科罗拉多大学波尔得分校毕业证学位证成绩单-可办理
科罗拉多大学波尔得分校毕业证学位证成绩单-可办理
 
原版1:1定制南十字星大学毕业证(SCU毕业证)#文凭成绩单#真实留信学历认证永久存档
原版1:1定制南十字星大学毕业证(SCU毕业证)#文凭成绩单#真实留信学历认证永久存档原版1:1定制南十字星大学毕业证(SCU毕业证)#文凭成绩单#真实留信学历认证永久存档
原版1:1定制南十字星大学毕业证(SCU毕业证)#文凭成绩单#真实留信学历认证永久存档
 
While-For-loop in python used in college
While-For-loop in python used in collegeWhile-For-loop in python used in college
While-For-loop in python used in college
 
20240419 - Measurecamp Amsterdam - SAM.pdf
20240419 - Measurecamp Amsterdam - SAM.pdf20240419 - Measurecamp Amsterdam - SAM.pdf
20240419 - Measurecamp Amsterdam - SAM.pdf
 
Student Profile Sample report on improving academic performance by uniting gr...
Student Profile Sample report on improving academic performance by uniting gr...Student Profile Sample report on improving academic performance by uniting gr...
Student Profile Sample report on improving academic performance by uniting gr...
 
Easter Eggs From Star Wars and in cars 1 and 2
Easter Eggs From Star Wars and in cars 1 and 2Easter Eggs From Star Wars and in cars 1 and 2
Easter Eggs From Star Wars and in cars 1 and 2
 
Identifying Appropriate Test Statistics Involving Population Mean
Identifying Appropriate Test Statistics Involving Population MeanIdentifying Appropriate Test Statistics Involving Population Mean
Identifying Appropriate Test Statistics Involving Population Mean
 
PKS-TGC-1084-630 - Stage 1 Proposal.pptx
PKS-TGC-1084-630 - Stage 1 Proposal.pptxPKS-TGC-1084-630 - Stage 1 Proposal.pptx
PKS-TGC-1084-630 - Stage 1 Proposal.pptx
 
Call Girls In Dwarka 9654467111 Escorts Service
Call Girls In Dwarka 9654467111 Escorts ServiceCall Girls In Dwarka 9654467111 Escorts Service
Call Girls In Dwarka 9654467111 Escorts Service
 
Effects of Smartphone Addiction on the Academic Performances of Grades 9 to 1...
Effects of Smartphone Addiction on the Academic Performances of Grades 9 to 1...Effects of Smartphone Addiction on the Academic Performances of Grades 9 to 1...
Effects of Smartphone Addiction on the Academic Performances of Grades 9 to 1...
 

A brief report on REITs and the Indian connect

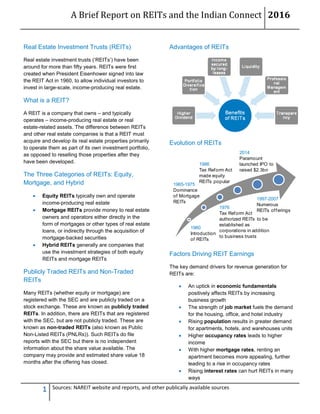
  • 1. A Brief Report on REITs and the Indian Connect 2016 1 Sources: NAREIT website and reports, and other publically available sources Real Estate Investment Trusts (REITs) Real estate investment trusts (‘REITs’) have been around for more than fifty years. REITs were first created when President Eisenhower signed into law the REIT Act in 1960, to allow individual investors to invest in large-scale, income-producing real estate. What is a REIT? A REIT is a company that owns – and typically operates – income-producing real estate or real estate-related assets. The difference between REITs and other real estate companies is that a REIT must acquire and develop its real estate properties primarily to operate them as part of its own investment portfolio, as opposed to reselling those properties after they have been developed. The Three Categories of REITs: Equity, Mortgage, and Hybrid  Equity REITs typically own and operate income-producing real estate  Mortgage REITs provide money to real estate owners and operators either directly in the form of mortgages or other types of real estate loans, or indirectly through the acquisition of mortgage-backed securities  Hybrid REITs generally are companies that use the investment strategies of both equity REITs and mortgage REITs Publicly Traded REITs and Non-Traded REITs Many REITs (whether equity or mortgage) are registered with the SEC and are publicly traded on a stock exchange. These are known as publicly traded REITs. In addition, there are REITs that are registered with the SEC, but are not publicly traded. These are known as non-traded REITs (also known as Public Non-Listed REITs (PNLRs)). Such REITs do file reports with the SEC but there is no independent information about the share value available. The company may provide and estimated share value 18 months after the offering has closed. Advantages of REITs Evolution of REITs 1960 Introduction of REITs 1965-1975 Dominance of Mortgage REITs 1976 Tax Reform Act authorized REITs to be established as corporations in addition to business trusts 1986 Tax Reform Act made equity REITs popular 1997-2007 Numerous REITs offerings 2014 Paramount launched IPO to raised $2.3bn Factors Driving REIT Earnings The key demand drivers for revenue generation for REITs are:  An uptick in economic fundamentals positively affects REITs by increasing business growth  The strength of job market fuels the demand for the housing, office, and hotel industry  Rising population results in greater demand for apartments, hotels, and warehouses units  Higher occupancy rates leads to higher income  With higher mortgage rates, renting an apartment becomes more appealing, further leading to a rise in occupancy rates  Rising interest rates can hurt REITs in many ways
  • 2. A Brief Report on REITs and the Indian Connect 2016 2 Sources: NAREIT website and reports, and other publically available sources REITs Valuation Techniques Traditional valuation methods don’t apply to REITs because their operations are different from traditional companies. REITs are valued based on three main techniques namely:  Net Asset Value (NAV) is one of the most important valuation metrics for REITs. NAV is the market value of all the assets, including cash and indirect property assets, net of liabilities and deliberated dividends or distributions. A high NAV indicates that REITS have strong earning potential and good management  Fund from Operations (FFOs) is a measure to evaluate the cash generated from their operations. It is calculated as net income + depreciation and amortization + impairment charges + losses from sale of property – gains from sale of property  Adjusted Fund From Operations (AFFOs) further deducts the capital expenditures required to maintain the existing portfolio of properties How is the Global Listed Property Market Configured? As earlier stated, REITs were introduced in the US in 1960. For the next 30 years, REITs were largely confined to the US and Australia. The major growth of REITs happened only after 2000 when some of the key Asian countries introduced REITs. Japan adopted REITs in 2000. It was followed by Singapore in 2002 and Hong Kong in 2003. While France was the first major European country to launch REITs in 2003, the United Kingdom & Germany introduced REITs in 2007. REIT Indexes The most common index for the REIT and global listed property market is the FTSE EPRA/NAREIT Global Real Estate Index Series. It constitutes of both REITs and non-REIT listed property companies. The Global Index Series contains the Developed Markets indices and the Emerging Markets indices. Industry Snapshot (Monthly data for February 2016) FTSE NAREIT All REITs FTSE NAREIT All Equity REITs Equity Market Capitalization $901bn $846bn Yield Comparison 4.51% 4.05% Leverage & Coverage Ratios Debt Ratio 46.4% 36.0% Coverage Ratio 4.0x 4.3x Fixed Charge Ratio 3.7x 3.9x Investment Grade 46 (67% by M.Cap.) 46 (67% by M.Cap.) (Balance sheet data as of Q3 2015) S&P 500: 2.24%  221 REITs are in the FTSE NAREIT All REITs Index  196 REITs trade on the NYSE  NYSE listed REITs equity market capitalization = $853bn  Stock exchange-listed REITs paid out approximately $42bn and PNLRs paid out approximately $4bn in dividends during 2014 Capital Offerings: (2016: YTD) Capital Raised (mm) Number of Offerings IPOs 0 0 Secondary Common $2,764 8 Secondary Preferred $300 1 Secondary Debt $7,700 13 Total $10,764 22
  • 3. A Brief Report on REITs and the Indian Connect 2016 3 Sources: NAREIT website and reports, and other publically available sources Overview of US REITS By the end of 2014 REITs in the US owned nearly $3 trillion of gross real estate assets. Public listed REITs saw their combined equity market capitalization grow from the end of 1990 at a 21% compound annual rate, from $9bn to nearly $950bn at the end of 2015. Public listed equity REITs constitute the bulk of today’s REIT market. As of year-end 2014, equity REITs accounted for more than 70% of all US public listed REIT gross assets and more than 90% of the approximately $950bn of equity market capitalization. Economic contribution of REITs in the US An EY study (commissioned by the NAREIT) to estimate the economic impact of REITs on the US economy for 2014 revealed:  Their total economic contribution in 2014 was an estimated 1.8mm full-time equivalent (FTE) jobs and $107.5bn of labor income  REIT activities also resulted in the payment of an estimated $44bn of interest income and the distribution of $81.6bn of dividends in 2014  REITs invested $55.9bn in new construction and routine capital expenditures to maintain existing property in 2014 US REIT Merger and Acquisition Activity Between 2004 and 2016, US REIT Industry saw M&A deals to the tune of US$293bn, with Public to public deals making 64% of the total deals. $14 $6 $47 $11 $5 $6 $24 $13 $30 $16 $16 $0 $9 $35 $87 $0 $0 $5 $1 $29 2004 2005 2006 2007 2008 2010 2011 2012 2013 2014 2016 Public to Public (in bn) Public to Private (in bn) (YE March 31st) US Real Estate Indicators Even though the US economy appears to have entered into a “goldilocks” environment, in which its growth trajectory remains solid and inflation remains low against continued global economic concerns, one would never know it based on the REIT stock price roller coaster. Along with the broader stock market, as represented by the S&P 500 Index, REITs had declined substantially for 2016 through mid-February, only to roar back over the intervening six weeks. This volatility occurred even though property fundamentals and REIT earnings remain solid and are still growing. Listed Real Estate Market Performance  REITs and the S&P 500 Index increased by 10.0% and 6.8%, respectively in March 2016  In possibly another indication of the industry being in the later innings of the cycle, with the exception of the apartments sector (with expectations of 6% NOI growth), the other core sectors (industrials, regional mall, office, community retail, hotel, and health care) are expecting property performance in a fairly narrow band between 2.5% and 4.0%.  With annualized three-month volume of $535bn, property transactions are still at fairly high levels, but are now pacing even with last year rather than showing year-over-year increases  REITs now trade in line to NAV, which is slightly below the sector’s long-term 3% average premium  REITs are trading at an approximately 17.9 P/FFO multiple, which is 1.6 above the sector’s long-term average of 16.3 US Real Estate Market Returns (%cumulative) All REITs Equity REITs REIT Preferred S&P500 1 Month 10.0% 10.2% 3.3% 6.8% YTD 5.9% 5.8% 2.7% 1.3% 1 Year 4.1% 4.7% 5.6% 1.8% 3 Years 30.2% 32.6% 19.8% 39.8% 5 Years 71.5% 72.8% 45.6% 72.9% (As of March 31, 2016)
  • 4. A Brief Report on REITs and the Indian Connect 2016 4 Sources: NAREIT website and reports, and other publically available sources Opening Doors to REITs in India and China While institutional and retail investors have had a sampling of Asian real estate through REITs, in a sense they still have been shut out of the continent’s most significant economies, China and India. As of mid-2014, China had a population of 1.4bn, and India, 1.2bn, according to the CIA World Factbook. These countries have witnessed growth in GDP much greater than their developed counterparts. However, for now, India has a head start on China. While the guidelines were issued by the Securities and Exchange Board of India (SEBI) last year on REITs and so-called infrastructure investment trusts (InvITs), it is only in February this year, that Budget 2016 cleared Dividend Distribution Tax (DDT) hurdle in making REITs reality in India. Importance of REITs in Indian Context A REIT could:  Provide an attractive alternative investment instrument in the Indian financial markets  Help in bringing the much required professionalism and transparency in the real estate sector in India  Provide developers and large investors of commercial real estate to tap into the REITs for investment in the real estate assets Conducive Investment Environment  Growing economy could be a key driver for growth of the REIT regime in the Indian market  Increasing working age population will push the demand and promote the development of commercial real estate  Housing and urban infrastructure requirement will be needed to support the increasing population  Disposable income and retirement savings gives individuals flexibility to invest in long- term investment options for future savings  India is one of the countries globally offering affordable prime spaces, with high growth potential The Potential  The top seven cities of India together have more than 400mm sqft of operational office space, according to Mr. Raheja of K Raheja Corp. This is expected to grow by approx. 25mm to 30mm sqft annually. Of this, more than 150mm sqft will be ready for REIT listing  Embassy Office Parks, a joint venture between Embassy Group and Blackstone, holds 22 mm sqft of space in three cities, including Bangalore  Mr. Anuj Puri, JJL Chairman, adds that currently, approx. 229mm sqft of office space in India can be seen as REIT-compliant, and assuming even 50% of these get listed, we are looking at a total REITs listing worth $18.5bn  India needs to develop almost 45mm to 50mm housing units by 2028 Key Regulations relating to Indian REIT Initially proposed in December 2008 by the SEBI, the 2014 SEBI REIT Regulations have been notified.  Offer and listing: Initial offer of units through public issue to third parties, with mandatory listing  Minimum subscription: INR 2lakh (primary market)  Trading lot size: INR 1lakh (secondary market)  Dividend income: At least 90% of the distributable cash flow must be distributed and at least twice a year  Transparency: REIT, through a valuer, will undertake full valuation on a yearly basis and update the same on a half-yearly basis and declare NAV within 15 days from the date of such valuation / updation  Diversification: REITs will have to invest in at least two projects. Not more than 60% value of assets will be in one project  Property concentration: Not less than 80% of the assets should be invested in completed and revenue generating properties  Sponsor commitment: Sponsors must hold 25% of the units for first three years and 15% thereafter