1. Pak J Commer Soc Sci
Pakistan Journal of Commerce and Social Sciences
2014, Vol. 8 (2), 426- 444
Relationship between Organizational Politics
Perceptions and Employees’ Performance;
Mediating Role of Social Exchange Perceptions
Mahmood A. Bodla
COMSATS Institute of Information Technology, Lahore, Pakistan
Email: director@ciitlahore.edu.pk
Talat Afza
COMSATS Institute of Information Technology, Lahore, Pakistan
Email: talatafza@ciitlahore.edu.pk
Rizwan Qaiser Danish
Hailey College of Commerce, University of the Punjab, Lahore, Pakistan
Email: rdanish2000@yahoo.co.uk
Abstract
Perceptions of Organizational politics are very important aspect of Organizational life
with respect to its members as these influence various processes which ultimately affect
performance of employees. Previous studies have investigated impact of political
perceptions either on extra role performance of employees (exhibited through
organizational citizenship behaviors) or various other attitudes and behaviors. This study
investigates the relationship of perceptions of organizational politics with
multidimensional performance of employees which is measured through organizational
citizenship behavior-individual as well as organizational and in role performance of
employees simultaneously. Moreover the process through which these perceptions
operate is also investigated in the light of social exchange theory and reciprocity norms.
The data was collected through self-administered questionnaires from employees
working in different organizations at national level and was used as aggregate. Overall
1360 surveys were distributed among which 1163 useable questionnaires (for a response
rate of 85.51%) were returned filled and were entered into SPSS 20 for analysis. AMOS
20 was used for developing structural and measurement model in structural equation
modeling and for testing mediation through bootstrap strategy. The standardized indirect
effect revealed that perceptions of social exchange fully mediate the relationship between
perceptions of organizational politics and employees’ performance. The implications,
limitations and future directions are also provided.
Keywords: perceptions, organizational politics, social exchange, employee’s
performance
1. Introduction
There are two streams along which studies on Organizational politics embellish (Ferris et
al., 2002). The first one is political influence tactics and behaviors which is older (for
2. Bodla et al
427
critical review, see Bodla & Danish, 2013) and the other is employees perceptions of
Organizational politics in their working environment. Perceptions are important as people
behave according to their perceptions not on the basis of reality. Although discussion on
Organizational politics started in early 1900s (Farrel and Patterson, 1982) but the topic
gained its scientific foundations from the work of Burns (Burns & Stalker, 1961) who
discussed politics in the process of Organizational change (Ferris et al., 2002). In 1970s,
many researchers attracted to this area within the framework of power, influence tactics
and decision making (Pettigrew & Pettigrew, 1973; Porter, 1976; Porter, Allen & Angle
1983). Since then the interest in this area is increasing and many studies along different
streams are now available. The stream of perceptions of Organizational politics focuses
on evaluation of employees which is subjective and related to work, decision making
process and resource allocation (Ferris et al., 2002). It involves the mechanism that was
explained by attribution theory in which we perceive or understand the behaviors of
others sometimes through intentions of actors which may be self-serving and different
feelings arouse in the minds of employees regarding any political occurrences in the
workplace (Ferris, Harrel-Cook & Dulebohn, 2000; Ferris et al., 2002). Although many
studies were conducted to broaden the concept and find its relationship with various
Organizational and employee level outcomes, the processes through which this
phenomenon effects on performance of employees remained unexplored. Hence this
study is an effort to investigate how politics perceptions impact on employees’
multidimensional performance in the presence of exchange relationship.
2. Literature Review
Organizational politics is an important ingredient of the life of organization, which refers
to behavior in which personal interests are safeguarded rather than organizational
interests. The concept of organizational politics, well established now, has been well-
defined by Kacmar and Ferris (1991) and they viewed it as “it is the amount to which
employees observe their work setting as political in nature which result to make them feel
their environment unfair and unjust”. The nature of behavior of employees working
within an organization is frequently considered as political and this political environment
(Durbin, 1991) is so spread that nobody can escape from it. Organizational politics
perceptions in worksites have been viewed as and empirically evident of its negative
relationship with job satisfaction (Kacmar, Bozeman, Carlson & Anthony, 1999),
organizational commitment (Maslyn & Fedor (1998) and job performance (Anderson
(1994). Folger, Konovsky and Cropanzano (1992) concluded that these negative
perceptions about organizational politics make employees feel as they are working in
unjust and unfair environment which make them dissatisfied and as a result they are
compelled either to quit from department or Organization. When there is unfair
environment, reciprocating does not pay equitable rewards anymore. As an outcome of
organizational politics (Vigoda, 2002), employees visualizes that while they are putting
great deal of efforts working in organization, such type of efforts or investment expecting
future returns are not fair so the likelihood of disharmonious exchange relationships
emerge. After the publication of Ferris et al.’s (1989) theoretical model of Organizational
politics, the research in this specific dimension grew attention of various researchers of
organizational behavior and but still now many hidden underpinnings and mechanisms
are unexplored. Most of the literature in this area is steadily working on finding for
relationship of organizational politics with attitudes like attitudes related to job a,
3. Organizational Politics Perceptions and Employees
428
commitment towards organization and various behaviors like citizenship, absenteeism
etc. A latest study by Bodla and Danish (2009) has reported adverse reactions of OP with
different variables at work like job satisfaction, organizational commitment and job
involvement.
Perceptions of politics in organizations have various negative outcomes which include
wastage of time, damaging information sharing of critical factors, creating
communication (Eisenhardt & Bourgeois, 1988) barriers and ultimately affecting
exchange relationship among parties. Political perceptions are more important than
political behavior as employees react not on the basis of reality but on the basis of their
perceptions of political phenomenon (Vredenburgh & Maurer, 1984). Mixed results of
employee outcomes or performance and perceptions of Organizational politics
(Cropanzano, Howes, Grandey & Toth, 1997; Randall, Cropanzano, Borman, & Birjulin,
1999) lay foundations for further research on this area. In a recent study by Kane-Frieder,
Hochwarter, Hampton and Ferris (2014), it was established that when there is high
supervisor political support the employees are able to survive and cope with this situation
more effectively. They argued that in the presence of politics perceptions and supervisors
political support simultaneously, job satisfaction, anxiety, work engagement and
Organizational citizenship behaviors are at favorable level. This support is the result of
exchange relationship in which both parties have some expectation from other.
Employee’s behaviors at work are very important to understand as these affect
performance and productivity of employees. Reciprocity norms (Gouldner, 1960) and
social exchange (Blau, 1964) are such important outcomes of employees interactions that
flourish within organizations and expectations of reward motivate or demotivate the
workers. Some sorts of obligations and bindings between employees and organization are
produced on account of exchange relationship on the basis of which they enjoy mutual
benefits and support on another. However quality and strength of such relationship
depends upon the very nature of relationship entered into as well as perceptions of
employees. The behaviors based on social exchange are voluntary in nature which has
some consequences like future obligation, repaying back, reciprocity or group norms. But
returns or exchange are hidden sometimes in future (Blau, 1964), in unknown time, the
binding force behind is only the trust and expectations that every part will complete his
part of obligation. These types of relations are not like every day routine working
relationship based on organizational polices or economic activities, instead such are
based on surroundings, working environment and what employees perceive. If such type
of relationships are very strong and of high quality in the eyes of employees, the
existence of perceptions of politics makes it disharmonious which results in adverse
effects on performance.
As a whole, individual’s perceptions of the organizational market place are reinforced by
the organizational politics and organizational support (Cropanzano et al., 1997). A range
of important work consequences are related with the politics and support. Similarly two
field studies by Drory (1990) and Drory and Romm (1988) investigated that on the
attitudes of high status individuals there was a less deterious impact while on the attitudes
of low status employees there was more deterious impact due to politics. To shape and
benefit from decision-making process Drory (1990) posited that this occurred because the
higher status individuals were in a better position. Relationships of employees in
Organizations are based on give and take of economic, social or sentimental terms as
4. Bodla et al
429
suggested by social exchange theory (West & Turner, 2000) and employees match the
cost of this relationship with perceived compensations. According to Foa and Foa (1974),
many of the interpersonal behaviors are manifest of resource seeking. But resources and
budget allocation in such social interactions is influenced by favoritism and power
demonstration which results in politicking of Organizational environment. Cropanzano et
al. (1997) and West and Turner (2000) used the expression marketplace for Organizations
where employees have to pay something for gaining something and cost or rewards are
exchanged. Manipulation and unequal distribution of resources may create imbalance.
There are many studies Theoretical as well as empirical which demonstrated that
perceptions of politics have negative effects on performance (Kacmar & Barron, 1999)
since few decades but these studies focused on bivariate relationships with various
outcomes thus leaving gap for understanding mechanism and processes through which
these perceptions operate. These processes are very necessary to understand its influence
on the attitudes and behaviors of employees. When employees view that they will not
receive exchange equivalent to their own social and economic investment, they hesitate
to take risk. In this way, perceptions of politics reduce productivity and performance of
employees, specifically voluntary behaviors (Organizational Citizenship Behaviors) and
task performance.
Hussain and Haque (2011) affirmed that organizational politics affect majority of the
middle and lower level employees and at very higher level. When employees have lower
level of qualification and illiterate due to poverty they also have les knowledge about
political tactics in work settings as a result their performance is affected. Poon (2006)
admitted that political sensitivity is the major force which determines trusting
relationship among employees and administrator and between colleagues. When
perceptions of organizational politics are higher workers trust less on coworkers as their
political beliefs are strong and they don’t help them. On the other hand in the presence of
trust political perceptions are neutralized. Vigoda (2007) confirmed that Organizational
politics perceptions moderately mediate the relationship among leadership in-role
performance and organizational citizenship behavior. Cropanzano et al. (1997) and
Randall et al. (1999) found no significant relationship between politics perceptions and
OCBs and task performance. The non-confirmation suggests that there is some
mechanism or mediators between the both through which performance is affected.
Moreover many studies have argued that relationship between politics and performance is
complex which indicates potentially existence of some mediators and moderators (Ferris
et al., 2000; Rosen, Levy & Hall, 2006; Kacmar & Barron, 1999). Rosen et al. (2006)
suggested that politics perceptions are related with employee outcomes through their
perceptions of exchange relationships.
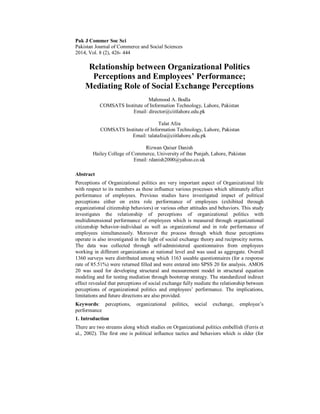
On the basis of above literature, following theoretical model and hypotheses emerged
(Figure 1).
H1: There is positive relationship between perceptions of Organizational politics
and social exchange perceptions
H2: There is positive relationship between social exchange perceptions and
employees’ performance
H3: There is negative relationship between perceived Organizational politics and
employees’ performance
5. Organizational Politics Perceptions and Employees
430
H4: Social exchange perceptions will partially mediate the relationship between
perceptions of Organizational politics and employees’ performance
Figure 1: Proposed model relating POP to Performance through Social Exchange Perceptions
3. Research Methodology
3.1 Population and sample
Population for this study consists of employees of different industrial compositions
working during day time and studying in business management programs at master level
in Pakistan. The experience of job was the basic requirement for inclusion in survey. Data
was collected through self-administered questionnaires in which participation was
voluntary and anonymity was ensured. There were total 36 institutes all over the Pakistan
and list was obtained from National Business Education Accreditation Council (NBEAC)
of Higher Education Commission of Pakistan. The nationwide sample in the study of
organizational politics is in itself the extension of previous researches that are only
confined to either MBA students of one institute or respondents of only one organization.
Such study setting was used by many researchers in their researches, e.g., Gandz and
Murray (1980); Cropanzano et al. (1997); Poon (2003); Vigoda and Kapun (2005); Bodla
and Danish (2009). Data were collected through self-administered questionnaires. 1360
questionnaires were distributed among which 1163 filled filled useable responses were
returned for a response rate of 85.51%.
3.2 Measurement of Variables
Each scale used in this study was measured on five anchored Likert scale (1 for strongly
disagree to 5 for strongly agree) through self-administered questionnaire. Reverse
questions were also included for cross validation.
3.3 Perception of Organizational Politics; Perception of organizational politics is the
degree to which respondents view their work environment as political and therefore
unjust and unfair (Ferris, Russ & Fandit, 1989). A 9 items revised version of POPS was
used which was developed by Kacmar and Carlson (1997) and has three subscales.
Social Exchange Perceptions; Employees’ perceptions of their organizational exchange
relationship was measured using Shore et al.(2006) eight item Social Exchange
Perceptions Scale which asses the employees’ perceptions of the social exchange
Perceptions of
Organizational
Politics
Employees’
Performance
-OCB-Individual
-OCB-Organizational
-Task Performance
Social
Exchange
Perceptions
a
c
b
6. Bodla et al
431
relationships that they have with their organization.
3.4 Employee Performance
Multi-Dimensional Work Performance was measured through Organizational Citizenship
Behavior-Individual, Organizational Citizenship Behavior-Organizational and In-Role
performance Scales developed by Williams and Anderson (1991).
4. Results and Analysis
4.1 Demographic Profile of Participants
The final sample size consists of 1163 respondents out of which 1037 males (89.2%)
demonstrate the majority of the respondents and 126 females (10.8%) representing that
working women are in minority in Pakistan (Table 1). Most of the employees were
between the age group of 30 – 39 and these mid-career employees were 346 (29.8%). 21
(1.8%) were of the age 19 years, 182 (15.6%) between the age group of 20-24, 324
(27.9%) between the age group of 25-29, 200 (17.2%) between the age group of 40 – 49,
64 (5.5%) between the age group of 50-59 and 26 (2.2%) of respondents have age more
than 60 years. According to the marital status, majority of the respondents (711 making
61.1%) are married, while 452 (38.9%) respondents are single. 364 (31.3%) respondents
are working in public sectors while 799 (68.7%) respondents are working in private
sector. The largest group of respondents, 418 (35.9%) is working in financial services, 60
(5.2%) respondents are working in health sector, 250 (21.5%) respondents are working in
manufacturing sector, 70 (6.0%) respondents are working in energy sector, 142 (12.2%)
respondents are working in education sector, 55 (4.7%) respondents are working in
telecommunication sector, 158 (13.6%) are working in information technology sector,
and 10 (0.9%) are working in civil services. 83 (7.1%) of the respondents have only 1
year experience, 193 (16.6%) have 1-2 year experience, 250 (21.5%) respondents have 2-
3 years working experience, 243 (20.9%) respondents are working from 3-5 years, 196
(16.9%) respondents are working from 5-10 years and 198 (17.0%) respondents have
been working from more than 10 years. According to the position of respondents 823
(70.8%) respondents are working on non-managerial position/technical staff and 340
(29.2%) respondents are working on managerial position.
4.2 Descriptive Analysis
The descriptive statistics show the characteristics of the data set in Table 2. It includes
number of observations, smallest and largest value, average value and dispersion in the
data set of each variable. There are 1163 total observations. Perceptions of Organizational
Politics have 5 and 1 greatest and lowest values respectively. The average value of
Perception of Organizational Politics is 3.28 and its standard deviation is 0.65. Social
Exchange Perceptions has 5 and 1.57 greatest and lowest value respectively. The average
value of Social Exchange Perceptions is 3.59 and its standard deviation is 0.61. OCB-
Individual has 5 and 1.57 greatest and lowest value respectively. The average value of
OCB-Individual is 3.55 and its standard deviation is 0.58. OCB-Organization has 5 and
1.57 greatest and lowest value respectively. The average value of OCB-organization is
3.34 and its standard deviation is 0.50. Task Performance has 5 and 1.20 greatest and
lowest value respectively. The average value of Task Performance is 3.67 and its
standard deviation is 0.62.
7. Organizational Politics Perceptions and Employees
432
Table 1: Descriptive Analysis of Demographic Variables
Variable Frequency Percent
(%)
Gender
Male
Female
1037
126
89.2
10.8
Age
19 or less 21 1.8
20-24 182 15.6
25-29 324 27.9
30-39 346 29.8
40-49 200 17.2
50-59 64 5.5
60 and above 26 2.2
Marital Status
Married
Single
711
452
61.13
38.87
Sector
Public
Private
364
799
31.3
68.7
Industrial Composition
Health 60 5.2
Manufacturing 250 21.5
Energy 70 6.0
Financial Services 418 35.9
Education
Telecommunication
Information Technology
Civil Services
142
55
158
10
12.2
4.7
13.6
.9
Establishment Size
Less than 25 employees 359 30.9
25-99 325 27.9
100-199 137 11.8
200-499 106 9.1
500 and more 236 20.3
Job Tenure
Less than 1 year 83 7.1
1-2 years 193 16.6
2-3 years 250 21.5
3-5 years
5-10 years
243
196
20.9
16.9
More than 10 years 198 17.0
Position
Manager
Non- Manager
340
823
29.23
70.77
8. Bodla et al
433
Table 2: Mean and Standard Deviation of Variables
Variables Min Max Mean SD
Perceptions of Organizational Politics 1 5 3.28 0.65
Social Exchange Perceptions 1.57 5 3.59 0.61
OCB-Individual 1 5 3.55 0.58
OCB-Organizational 1 5 3.34 0.50
Task Performance 1 5 3.67 0.62
Table 3 shows the bivariate relationship among the variables. From this table we can
observe that all the variables significantly correlated with each other. All the relationships
are positive except relationship between perceptions of Organizational politics and OCB-
Organizational (r =-.231, p<.01). This reflects that prevalence of high level of politics
perceptions in Organization cause to reduce employees extra role behavior in such a way
that they don’t exhibit discretionary and voluntary behaviors that are necessary for the
wellbeing of employees and welfare of Organization. On the other hand, relationship
between POP and OCB-individual and Task Performance is positively and significantly
correlated (r =.265, p<.01 and r =.142, p<.01).
Table 3: Correlations among all the variables of study (N=1163)
Variables 1 2 3 4 5
Perceptions of Organizational Politics 1
Social Exchange Perceptions .155**
1
OCB-Individual .265**
.567**
1
OCB-Organizational -.231**
.308**
.290**
1
Task Performance .142**
.551**
.529**
.424**
1
** Correlation is significant at the 0.01 level (2-tailed). * Correlation is significant at the
0.05 level (2-tailed).
1=Perceptions of Organizational Politics, 2=Social Exchange Perceptions, 3=OCB-
Individual, 4= OCB-Organizational, 5=Task Performance
4.3 Structural Equation Modeling
Structural equation modeling was used in AMOS 18 for inferential statistics and
hypothesis testing. SEM was applied in two steps, measurement model and structural
model. Goodness of fit was tested in each step. As we used maximum likelihood method
of estimation, it was necessary to test all the assumptions of normality. Normality was
assessed through skewness and kurtosis and all the values were found within the range of
+ 1. There was adequate sample size and missing data were treated properly.
4.4 Measurement Model
In first step, a measurement model was developed and tested for conformance about
structures of factors and discriminant validity of the measures. Alternative models reveal
that models became worsen and bad fit when factor structures were altered from three
factors to two factors and one factor respectively. Factor loading is given in table 5 which
shows that each loading was significant at p<.001. This is represented through figure 2.
Goodness of fit measures are given in Table 4: Here we can see that all the values of
GOF indices are well above the threshold values for GFI, AGFI, CFI, PCLOSE, PGFI
and below the threshold values for RMR, CMIN/DF and RMSEA as suggested by Hu
9. Organizational Politics Perceptions and Employees
434
and Bentler (1995) and Haire et al. (2010). Thus our measurement model was good fit
and further structural model was developed for hypothesis testing.
Table 4: Model Fit Summary for Hypothesized Measurement Model
Model
CMIN/
DF
RMR
S
RMR
GFI AGFI PGFI CFI RMSEA PCLOSE
Hypothesized
Model
3.080 0.044 .0386 0.964 0.952 0.716 .906 0.042 0.996
Table 5: Standardized Regression Weights
Variables Estimate
POP1 <--- Perceptions of Org. Politics .321
POP4 <--- Perceptions of Org. Politics .614
POP5 <--- Perceptions of Org. Politics .421
POP7 <--- Perceptions of Org. Politics .377
EP1 <--- Social Exchange Perceptions .464
EP2 <--- Social Exchange Perceptions .536
EP7 <--- Social Exchange Perceptions .361
EP8 <--- Social Exchange Perceptions .461
OCBI1 <--- Employees’ Performance .385
OCBI2 <--- Employees’ Performance .410
OCBI3 <--- Employees’ Performance .476
OCBI4 <--- Employees’ Performance .452
OCBO1 <--- Employees’ Performance .476
OCBO2 <--- Employees’ Performance .400
OCBO6 <--- Employees’ Performance .577
p<.001 for all estimates
10. Bodla et al
435
Figure 2: Measurement Model
Reliabilities are given in table 6 construct wise and some items were dropped due to poor
factor loadings.
Table 6: Construct Wise Reliability Analysis
Cronbach's Alpha
Before
Items
Deleted
Cronbach's
Alpha
After
Perceptions of
Organizational Politics
.48 3 .60
Social Exchange Perceptions .58 1 .64
Employee Performance .71 3 .78
11. Organizational Politics Perceptions and Employees
436
4.5 Common Method Bias
As the data were collected through single source so the responses could have some
external influence among which common method bias is the most prominent thus leading
to both Type I and Type II errors. When much of the variance is explained by common
factor the common method bias can inflate or deflate the relationship between construct
(Podsakoff & Organ, 1986; Spector (1994). If a substantial amount of common method
variance is present, either (a) a single factor will emerge from the factor analysis, or (b)
one general factor will account for the majority of the covariance among the variables
(Krishnan, Martin & Noorderhaven, 2006; Tihanyi, Lyles & Dhanaraj, 2005).
Harman's single factor test was used to see if the majority of variance can be explained
by the use of single factor. Before going for Factor Analysis Kaiser-Meyer-Olkin
Measure of Sampling Adequacy and Bartlett's Test of Sphericity were performed to see
whether the data is suitable for CFA. According to Shukla, “Bartlett’s test of sphericity
tells us that the variables in the population are uncorrelated with each other in other
words we may say that each variable perfectly correlate with itself”. Thresholds for KMO
are as, above .90 excellent; admirable .80; moderate .70; not good .50 and undesirable <
.50 (Dziuban & Shirkey, 1974). KMO value of .878 and significant of Bartlett's Test
(p<.001) revealed that it is correct to proceed for CFA to check for CMB (Table 7). It
was observed that only 13.57% variance was explained when only one factor was
generated. It was concluded that CMB was not an issue in the data set (Table 8).
Table 7: KMO and Bartlett's Test of Sphericity
Kaiser-Meyer-Olkin Measure of Sampling Adequacy. 0.878
Bartlett's Test of Sphericity
Approx. Chi-Square 16050.830
df 1770
Sig. .000
Table 8: Total Variance Explained by Single Factor
Component
Initial Eigen values
Extraction Sums of Squared
Loadings
Total
Variance
%
Cumulative
%
Total
Variance
%
Cumulative
%
1 8.141 13.569 13.569 8.141 13.569 13.569
2 4.894 8.156 21.725
3 2.612 4.353 26.078
4 1.697 2.829 28.906
5 1.461 2.435 31.342
6 1.434 2.389 33.731
7 1.314 2.190 35.921
8 1.289 2.148 38.069
9 1.251 2.084 40.153
10 1.180 1.966 42.120
12. Bodla et al
437
4.6 Structural Model
After testing for measurement model and its fitness, a structural model was built based on
previous theoretical arguments. The fitness of the structural model was tested using
numerous indices of fit. The value of relative chi-square is 3.080 showing that model is
good fit (Table 9). The Comparative Fit Index (CFI), the AGFI (Adjusted Goodness of
Fit Index) and the Goodness of Fit Index (GFI) were within the acceptable range. These
indices show a value >0.90 for good fit model. The RMSEA (Root Mean Square Error of
Approximation) and the RMR (Root Mean-Squared Residual) were closer to zero and
indicate good fit. RMSEA value <0.08 shows a good fit, and value <0.05 indicates a very
good fit. One item of OCB Individual scale had standardized residuals error very high
with other items and was dropped which improved model fitness.
The Structural Model shows the relationship among Perceptions of Organizational
Politics, Social Exchange Perceptions and Employee’s Performance (Figure 3). Path
coefficients of model were significant for all the hypothesized relationships except for
path from Perceptions of Organizational Politics to Employee’s Performance. The
goodness of fit (GFI) indicates that the model was acceptable, with a CMIN/DF 3.080,
RMR of 0.044, a AGFI of 0.952, PGFI of 0.716, RMSEA of 0.042 and PCLOSE of 0.996
(Table 9). Overall, the model was acceptable. The path coefficients indicated that the
relationship among the Perceptions of Organizational Politics and Exchange was positive
and statistically significant. Perception of Organizational Politics also revealed positive
and significant effect on Stress and Performance, but the path coefficient among
Organizational Politics and Employee Morale was not significant although negative.
Stress also shows negative but significant effect on Employee’s Performance. This
structural model was used as baseline model for subsequent analysis and testing
hypotheses. Regression weights are presented in Table 10.
Table 9: Model Fit Summary for Hypothesized Measurement Model
Model
CMIN/
DF
RMR SRMR GFI AGFI PGFI CFI RMSEA PCLOSE
Hypothesized
Model
3.080 0.044 .0386 0.964 0.952 0.716 .906 0.042 0.996
14. Bodla et al
439
Table 10: Standardized Regression Weights
Variables Estimate S.E. C.R. p
SocExchPerc <--- Per_Politics .202 .083 3.240 .001
Emp_Perf <--- Per_Politics .021 .054 .420 .674
Emp_Perf <--- SocExchPerc .907 .084 8.989 ***
POP4 <--- Per_Politics .614 .278 6.176 ***
OCBO1 <--- Emp_Perf .476 .10610.476 ***
POP1 <--- Per_Politics .321
EP1 <--- SocExchPerc .464 .09610.303 ***
EP2 <--- SocExchPerc .536 .10211.133 ***
POP7 <--- Per_Politics .377 .174 6.042 ***
POP5 <--- Per_Politics .421 .189 6.274 ***
OCBI3 <--- Emp_Perf .476 .11310.453 ***
TP1 <--- Emp_Perf .548 .12711.205 ***
OCBI4 <--- Emp_Perf .452 .10310.186 ***
OCBO6 <--- Emp_Perf .577 .12411.460 ***
OCBO2 <--- Emp_Perf .400 .09610.247 ***
EP8 <--- SocExchPerc .461
EP7 <--- SocExchPerc .361 .076 8.765 ***
OCBI1 <--- Emp_Perf .385 .109 9.219 ***
OCBI2 <--- Emp_Perf .410 .109 9.533 ***
TP2 <--- Emp_Perf .515 .12510.734 ***
TP3 <--- Emp_Perf .433
4.7 Mediation Analysis
As recommended by Garson (2005), the value of CMIN/Degrees of Freedom 3.080 is
between 2 to 5 which indicates that above discussed model is statistically fit. According
to Byrne (2001), “the values of RMSEA <.08 indicate a good fit and <.05 a very good
fit”. The value of Root Mean Squared Error of Approximation (RMSEA) in model is .042
which can be considered as very good fit. MacCallum et al. (1996)., supported the values
of RMSEA in this way if the values are in the range of .08 to 0.10 then we can say model
is mediocre fit and if the value of RMSEA is above .10 then model is poor fit. According
to Hair et al. (2010), the value of RMSEA below 0.10 is considerable and accepted for
model. In the view of Joreskog and Sorbom (2008), Goodness of Fit Index (GFI) and
Adjusted Goodness of Fit Index (AGFI) values near to 1 considered as good model fit.
Table 9 demonstrated the values of GFI and AGFI .964 and .952 respectively which
were near to 1 but there is another criteria for GFI and AGFI which is that these values
should be greater than .90 for good model fit. According to Hooper, Coughlan and
Mullen (2008), the values of Normed Fit Index (NFI) and Comparative Fit Index (CFI)
should be greater than .90 for a good model fit but Hair et al (2010) denoted that values
greater than .80 are also permissible for acceptance of model. In our model this value is
0.906 indicating good fit.
Mediation analyses were performed in SEM through bootstrapping. Bootstrapping is a
resampling strategy which creates sampling distribution to estimate standard errors and
15. Organizational Politics Perceptions and Employees
440
create confidence intervals (Cheun & Lau, 2008). It is very important for mediation
analysis for the confirmation of true mediational effects. When the mediation effect is
non-zero it accurately calculates confidence intervals. Its power lies in its distribution
free methodology and it does not require the data to be normally distributed in SEM. The
significance of mediation effect is likely to be underestimated in the presence of
measurement errors. It allows researchers to assess the stability of parameter estimates
(MacKinnon, 2008; Byrne, 2001). Total, Direct and Indirect Effects of Hypothesized
Model were obtained by bootstrapping for testing mediation in SEM using Bollen &
Stine Bootstraps (N=3000) with 95% Bias Corrected Confidence Interval Method. For
testing mediation Bollen & Stine bootstraps samples were run (N=3000, CI=95%) and
standardized total, direct and indirect effects were obtained. It is clear from the table 11
that total effects of perceptions of Organizational politics on social exchange perceptions
and employees’ performance is β =.202, p<.01; β =.204, p<.01and β=.907, p<.01
respectively. But direct effect of politics perceptions on employees’ performance is not
significant while indirect effect is highly significant thus full mediation is evident.
Table 11: Results of total, direct and indirect effects (with 3000 bootstraps BCCI of 95%)
Variables
Standardized Total Effects
Standardized Direct
Effects
Standardized Indirect
Effects
Perceptions
of Org.
Politics
Social
Exchange
Perceptions
Perceptions
of Org.
Politics
Social
Exchange
Perceptions
Perceptions
of Org.
Politics
Social
Exchange
Perceptions
Social
Exchange
Perceptions
.202(.001) .000 .202(.001) .000 .000 .000
Employees’
Performance
.204(.002) .907(.001) .021(NS) .907(.001) .183(.001) .000
p value is given in brackets, NS=not significant
5. Conclusion
The basic objective of the study was to investigate how politics perceptions impact on
employees’ multidimensional performance in the presence of exchange relationship. On
the basis of literature, we developed theoretical model and four hypotheses. H1 was about
the relationship between perceptions of Organizational politics and social exchange
perceptions. This hypothesis was fully supported by the data (r = .155, p<.001, β =.202,
p<.001). H2 was about the positive relationship between social exchange perceptions and
employees’ performance which was also confirmed (β =.907, p<.001). H3 was about the
negative relationship between perceived Organizational politics and employees’
performance which was not fully supported. Although previous studies reported
inconsistent findings about this relationship as some researchers found evidence for
positive relationship and others as negative relationship. As we further investigated the
each dimension of performance (i. e., organizational citizenship behavior-individual,
organizational citizenship behavior-Organizational and task performance), correlation
analysis revealed that perceptions of politics have positive significant relationship with
OCB-individual and task performance but negative relationship with OCB-
Organizational (r = .265, p<.001, r = -.231, p<.001 and r =.142, p<.001 respectively).
Thus results supported our hypothesis partially and leaving theoretical foundations for the
presence of any mediator. In the same way our H4 states that social exchange perceptions
16. Bodla et al
441
will partially mediate the relationship between perceptions of Organizational politics and
employees’ performance. But indirect effects obtained through bootstraps revealed that
social exchange perceptions fully mediate the relationship between perceptions of
organizational politics and employees’ multidimensional performance. So this hypothesis
was also supported.
5.1 Implications of the study
The study has some implications for policy makers and human resource managers.
Firstly, managers should consider how he/she can reduce the perceptions of
organizational politics within working environment to reduce its detrimental effects.
Prevalence of an environment characterized by fairness and justice perceptions can
reduce this negative effect. Secondly, exchange relationships are a great buffer between
how POP effect employee performance in terms of their extra role behaviors and role
related behavior. It is expected that POP is a major source of stress within organization
and implementation of coping strategies like exercise, role modeling and relaxation can
reduce the harmful effects of POP. Thirdly, ambiguity related with job role may also
affect workplace due to which employees engage in different behaviors including
political behavior. So job role must be clearly defined so that nobody could take non
sanctioned advantage from his role.
5.2 Limitations and future guidelines
There are few limitations of this study. As the study was based on survey methods which
may create biasedness as to self-reported responses. Qualitative studies through
interviews and focus group discussion may unveil root causes of politicized environment
after in-depth analysis. Moreover the study carried in south Asian context and results
cannot be applied in western context in which individualism exist as against collectivist
society. Finally, employees with high scores in political skills are more likely to survive
in political environment thus immune to the negative effects of POP. There is need to
study political skill as moderator between the relationship of POP and Employees’
performance.
REFERENCES
Anderson, R. A. (1994). Stress effects on chromium nutrition of humans and farm
animals, Nothingham University Press, Nothingam, UK.
Blau, P. M. (1964). Exchange and power in social life. John Wiley and Sons, New Jersey.
Bodla, M. A., & Danish, R. Q. (2009). Politics and Workplace: An Empirical
Examination of the Relationship between Perceived Organizational Politics and Work
Performance. South Asian Journal of Management, 16(1), 44-62.
Bodla, M. A., & Danish, R. Q. (2013). The Use of Influence Tactics in Politicized
Organizations: A Look from Gender Perspective. Information Management & Business
Review, 5(9), 456-462.
Bodla, M. A., Danish, R. Q., & Nawaz, M. M. (2012). Mediating role of perceived
organizational politics in relating job characteristics to morale. African Journal of
Business Management, 6(15), 5185-5192.
17. Organizational Politics Perceptions and Employees
442
Burns, T. E., & Stalker, G. M. (1961). The management of innovation. University of
Illinois at Urbana-Champaign's Academy for Entrepreneurial Leadership Historical
Research Reference in Entrepreneurship.
Byrne, B. M. (2001). Structural equation modeling with AMOS: Basic concepts,
applications, and programming. Mahwah, NJ: Lawrence Erlbaum Associates.
Cheung, G. W., & Lau, R. S. (2008). Testing mediation and suppression effects of latent
variables bootstrapping with structural equation models. Organizational Research
Methods, 11(2), 296-325.
Cropanzano, R., Howes, J. C., Grandey, A. A., & Toth, P. (1997). The relationship of
organizational politics and support to work behaviors, attitudes, and stress. Journal of
Organizational Behavior, 18(2), 159-180.
Drory, A. & Romm, T. (1988). What organizational politics is: Organization members,
perceptions. Organization Studies, 9(2), 165-179.
Drory, A. (1993). Perceived political climate and job attitudes. Organization
Studies, 14(1), 59-71.
DuBRJN, A. J. (1991). Sex and gender differences in tactics of influence. Psychological
Reports, 68(2), 635-646.
Dziuban, C. D., & Shirkey, E. C. (1974). When is a correlation matrix appropriate for
factor analysis? Some decision rules. Psychological Bulletin, 81(6), 358-361.
Eisenhardt, K. M., & Bourgeois, L. J. (1988). Politics of strategic decision making in
high-velocity environments: Toward a midrange theory. Academy of Management
Journal, 31(4), 737-770.
Farrell, D., & Petersen, J. C. (1982). Patterns of political behavior in
organization. Academy of Management Review, 7(3), 403-412.
Ferris, G. R., Fedor, D. B., Chachere, J. G., & Pondy, L. R. (1989). Myths and politics in
organizational contexts. Group & Organization Management, 14(1), 83-103.
Ferris, G. R., Harrell-Cook, G., & Dulebohn, J. H. (2000). Organizational politics: The
nature of the relationship between politics perceptions and political behavior. Research in
the Sociology of Organizations, 17, 89-130.
Ferris, G. R., Hochwarter, W. A., Douglas, C., Blass, F. R., Kolodinsky, R. W., &
Treadway, D. C. (2002). Social influence processes in organizations and human resources
systems. Research in personnel and human resources management, 21, 65-127.
Ferris, G. R., Russ, G. S., & Fandt, P. M. (1989). Politics in organizations. Impression
Management in the Organization, 143(170), 79-100.
Foa, U. G., & Foa, E. B. (1974). Societal structures of the mind. Charles C Thomas.
Folger, R., Konovsky, M. A., & Cropanzano, R. (1992). A due process metaphor for
performance appraisal. Research in organizational behavior, 14, 129-177.
Gandz, J., & Murray, V. V. (1980). The experience of workplace politics. Academy of
Management Journal, 23(2), 237-251.
Garson, G. D. (2005). Quantitative research in public administration. NC State
University.
18. Bodla et al
443
Gouldner, A. W. (1960). The norm of reciprocity: A preliminary statement. American
Sociological Review, 25, 161-178.
Hair, J., Black, W., Babin, B., & Anderson, R.(2010). Multivariate data analysis, 7th
Ed:
Prentice Hall/Pearson.
Hooper, D., Coughlan, J., & Mullen, M. R. (2008). Structural equation modelling:
Guidelines for determining model fit. Electronic Journal of Business Research
Methods, 6(1), 53-60.
Hu L. T. and Bentler P. (1995). Evaluating Model Fit, in Structural Equation Modeling.
Concepts, Issues, and Applications, [Ed.] R. H. Hoyle, London: Sage Publications.
Hussain, T., & Haque, M. M. (2011). AVR Microcontroller Implementation for
Customized Sound Generation. International Journal of Electrical and Computer
Engineering (IJECE), 2(1), 112-119.
Jöreskog, K. G., & Sörbom, D. (1996). LISREL 8 user's reference guide. Scientific
Software International.
Kacmar, K. M., & Baron, R. A. (1999). Organizational politics: The state of the field
links to related processes, and an agenda for future research. In Research in Personnel
and Human Resources Management. Ed. G. R. Ferris , Greenwich, CT: Jai Press.
Kacmar, K. M., & Carlson, D. S. (1997). Further validation of the perceptions of politics
scale (POPS): A multiple sample investigation. Journal of management, 23(5), 627-658.
Kacmar, K. M., & Ferris, G. R. (1991). Perceptions of organizational politics scale
(POPS): Development and construct validation. Educational and Psychological
Measurement, 51(1), 193-205.
Kacmar, K. M., Bozeman, D. P., Carlson, D. S., & Anthony, W. P. (1999). An
examination of the perceptions of organizational politics model: Replication and
extension. Human Relations, 52(3), 383-416.
Kane-Frieder, R. E., Hochwarter, W. A., Hampton, H. L., & Ferris, G. R. (2014).
Supervisor Political Support as a Buffer to Subordinates’ Reactions to Politics
Perceptions: A Three-Sample Investigation. Career Development International, 19(1),
27-48.
Krishnan, R., Martin, X., & Noorderhaven, N. G. (2006). When does trust matter to
alliance performance? Academy of Management Journal, 49(5), 894-917.
MacCallum, R. C., Browne, M. W., & Sugawara, H. M. (1996). Power analysis and
determination of sample size for covariance structure modeling. Psychological
Methods, 1(2), 130-149.
MacKinnon, D. (2008). Introduction to statistical mediation analysis. Routledge.
Maslyn, J. M., & Fedor, D. B. (1998). Perceptions of politics: Does measuring different
foci matter? Journal of Applied Psychology, 83(4), 645.
Pettigrew, A. M., & Pettigrew, A. M. (1973). The politics of organizational decision-
making (pp. 76-81). London: Tavistock.
Podsakoff, P. M., & Organ, D. W. (1986). Self-reports in organizational research:
Problems and prospects. Journal of Management, 12(4), 531-544.
19. Organizational Politics Perceptions and Employees
444
Podsakoff, P. M., MacKenzie, S. B., Lee, J. Y., & Podsakoff, N. P. (2003). Common
method biases in behavioral research: a critical review of the literature and recommended
remedies. Journal of Applied Psychology, 88(5), 879-903.
Poon, J. M. (2003). Situational antecedents and outcomes of organizational politics
perceptions. Journal of Managerial Psychology, 18(2), 138-155.
Poon, J. M. (2006). Trust-in-supervisor and helping coworkers: moderating effect of
perceived politics. Journal of Managerial Psychology, 21(6), 518-532.
Porter, L. W. (1976). Organizations as political animals. Washington, DC.
Porter, L. W., Allen, R. W., & Angle, H. L. (1983). The politics of upward influence in
organizations. Organizational Influence Processes, 40(2), 408-422.
Randall, M. L., Cropanzano, R., Bormann, C. A., & Birjulin, A. (1999). Organizational
politics and organizational support as predictors of work attitudes, job performance, and
organizational citizenship behavior. Journal of Organizational Behavior, 20(2), 159-174.
Rosen, C. C., Levy, P. E., & Hall, R. J. (2006). Placing perceptions of politics in the
context of the feedback environment, employee attitudes, and job performance, Journal
of Applied Psychology, 91(1), 211.
Shore, L. M., Tetrick, L. E., Lynch, P., & Barksdale, K. (2006). Social and economic
exchange: Construct development and validation. Journal of Applied Social
Psychology, 36(4), 837-867.
Spector, P. E. (1994). Using self‐report questionnaires in OB research: A comment on the
use of a controversial method. Journal of Organizational Behavior, 15(5), 385-392.
Steensma, H. K., Tihanyi, L., Lyles, M. A., & Dhanaraj, C. (2005). The evolving value of
foreign partnerships in transitioning economies. Academy of Management Journal, 48(2),
213-235.
Vigoda, E. (2002). Stress‐related aftermaths to workplace politics: the relationships
among politics, job distress, and aggressive behavior in organizations. Journal of
Organizational Behavior, 23(5), 571-591.
Vigoda-Gadot, E. (2007). Leadership style, organizational politics, and employees'
performance: An empirical examination of two competing models. Personnel
Review, 36(5), 661-683.
Vigoda-Gadot, E., & Kapun, D. (2005). Perceptions of politics and perceived
performance in public and private Organizations: a test of one model across two
sectors. Policy & Politics, 33(2), 251-276.
Vredenburgh, D. J., & Maurer, J. G. (1984). A process framework of organizational
politics. Human Relations, 37(1), 47-65.
West, S. D., & Turner, L. G. (2000). Determination of spinosad and its metabolites in
citrus crops and orange processed commodities by HPLC with UV detection. Journal of
agricultural and food chemistry, 48(2), 366-372.
Williams, L. J., & Anderson, S. E. (1991). Job satisfaction and organizational
commitment as predictors of organizational citizenship and in-role behaviors. Journal of
Management, 17(3), 601-617.