SGS 2018 Full Year Results

2018 marked a new milestone in the SGS Group history as it surpassed CHF 1 billion in adjusted operating income. The Group delivered solid organic growth, higher adjusted operating income margin, robust cash flow and a higher ROIC, with the majority of SGS businesses performing in line with Group expectations. These results underline the Group’s objectives to deliver higher revenue, higher profitability and best in class returns on invested capital sustainably. Thus creating long-term value for its customers, shareholders and for society. The Group reported revenue of CHF 6.7 billion with total revenue growth of 6.0% (constant currency basis) for the year. Of this total, a solid organic growth of 5.3% (constant currency basis) was achieved, the highest since 2012. On a historical reported basis, revenue increased by 5.6%.

Recommended
Recommended
More Related Content
More from SGS
More from SGS (20)
Recently uploaded
Recently uploaded (20)
SGS 2018 Full Year Results
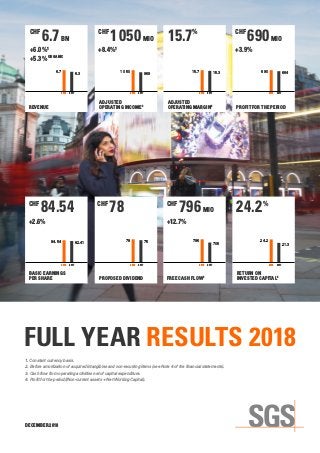
- 1. 201720182017201820172018 20172018 20172018 20172018 2017201820172018 CHF 6.7 BN +6.0%1 +5.3%ORGANIC CHF 1 050 MIO +8.4%1 CHF 690 MIO +3.9% 15.7% CHF 78 CHF 84.54 +2.6% CHF 796 MIO +12.7% 24.2% 6.36.7 969 1 050 66469015.3 15.7 82.4184.54 21.3 24.275 78 706 796 REVENUE ADJUSTED OPERATING INCOME2 ADJUSTED OPERATING MARGIN2 PROFIT FOR THE PERIOD BASIC EARNINGS PER SHARE PROPOSED DIVIDEND RETURN ON INVESTED CAPITAL4 FREE CASH FLOW3 1. Constant currency basis. 2. Before amortization of acquired intangibles and non-recurring items (see Note 4 of the financial statements). 3. Cash flow from operating activities net of capital expenditure. 4. Profit for the period/(Non-current assets + Net Working Capital). FULL YEAR RESULTS 2018 DECEMBER 2018
- 3. 3 FINANCIAL HIGHLIGHTS (CHF million) 2018 2017 PRO-FORMA1 2017 REVENUE 6 706 6 329 6 349 Change in % 6.0 5.6 ADJUSTED EBITDA2 1 337 1 245 1 247 Change in % 7.4 7.2 ADJUSTED OPERATING INCOME2 1 050 969 969 Change in % 8.4 8.4 ADJUSTED OPERATING INCOME MARGIN IN %2 15.7 15.3 15.3 OPERATING INCOME (EBIT) 946 895 894 Change in % 5.7 5.8 PROFIT FOR THE PERIOD 690 665 664 Change in % 3.8 3.9 PROFIT ATTRIBUTABLE TO EQUITY HOLDERS OF SGS SA 643 622 621 Change in % 3.4 3.5 ADJUSTED PROFIT ATTRIBUTABLE TO EQUITY HOLDERS OF SGS SA2 724 693 692 Change in % 4.5 4.6 ADJUSTED BASIC EPS (CHF)2 95.17 91.82 91.74 BASIC EPS (CHF) 84.54 82.54 82.41 DILUTED EPS (CHF) 84.32 82.41 82.27 CASH FLOW FROM OPERATING ACTIVITIES 1 074 987 FREE CASH FLOW3 796 706 RETURN ON INVESTED CAPITAL IN %4 24.2 21.3 (NET DEBT) (738) (698) WEIGHTED AVERAGE NUMBER OF SHARES ('000) 7 607 7 541 HEADCOUNT AVERAGE 96 492 93 556 1. Constant currency basis. 2. Before amortization of acquired intangibles and non-recurring items (see Note 4 of the financial statements). 3. Cash flow from operating activities net of capital expenditure. 4 Profit for period/(Non-current assets + Net Working Capital).
- 4. 4 5.3% ORGANIC REVENUE GROWTH CHF 1050MIO ADJUSTED OPERATING INCOME 8 ACQUISITIONS COMPLETED IN 2018 11.4% MINERALS DOUBLE-DIGIT REVENUE GROWTH A NEW MILESTONE WITH OVER 1 BILLION IN ADJUSTED OPERATING INCOME 2018 marked a new milestone in the SGS Group history as it surpassed CHF 1 billion in adjusted operating income. The Group delivered solid organic growth, higher adjusted operating income margin, robust cash flow and a higher ROIC, with the majority of SGS businesses performing in line with Group expectations. These results underline the Group’s objectives to deliver higher revenue, higher profitability and best in class returns on invested capital sustainably. Thus creating long-term value for its customers, shareholders and for society. The Group reported REVENUE of CHF 6.7 billion with total revenue growth of 6.0% (constant currency basis) for the year. Of this total, a solid ORGANIC GROWTH of 5.3% (constant currency basis) was achieved, the highest since 2012. On a historical reported basis, revenue increased by 5.6%. BUSINESS GROWTH The majority of SGS businesses performed in line with expectations, while certain were impacted by changing business mix and market conditions. The Mining sector continued to recover driving double-digit growth of 11.4% for Minerals. Strategic initiatives supported growth across all business segments, especially in Metallurgy and Energy Minerals. The Group also saw high single-digit growth from Governments and Institutions (7.5%) driven by strong results from TransitNet, Single Window and Scanning services. Oil, Gas and Chemicals (7.2%) growth was driven by Plant and Terminal Operations and the continuing trend for outsourcing in downstream Oil Gas. Certification and Business Enhancement (7.0%) benefited from the transition to new standards. Consumer and Retail (6.2%) was driven by South East Asia, Eastern Europe and the Middle East regions, and Environment, Health and Safety (5.7%) achieved strong performance across all business segments. Agriculture, Food and Life also delivered mid-single-digit growth (4.4%) driven by Testing and Certification. Growth was supported by strategic investments in laboratory capacity and capabilities focused on specific growth markets. FINANCIALS For the first time in group history, the ADJUSTED OPERATING INCOME passed the 1 billion mark to CHF 1 050 million, versus CHF 969 million in prior year (constant currency basis), an increase of 8.4%. The ADJUSTED OPERATING INCOME MARGIN increased from 15.3% (constant currency basis) in prior year to 15.7%. This reflects an underlying margin improvement observed in most businesses, led by the market recovery in Minerals, decisive portfolio management in Industrial and efficiency gains in Government and Institutions and Environment, Health and Safety. An internal investigation was launched in Brazil in early July 2018 and an amount of CHF 47 million was provided at June 2018 relating to prior periods. The investigation into this matter is now complete which confirmed the overstatement of revenues with no change to the original estimate. The financial impact has been recorded as a non-recurring item in the current period Group Income Statement consistent with the half-year disclosure. As a result, a number of management changes have been made and the Group has continued to strengthen its risk control processes during the year. NET FINANCIAL EXPENSES decreased to CHF 38 million and the overall effective tax rate for the period was 24%, an increase compared to last year (22%), which had benefited from the US tax reform. PROFIT ATTRIBUTABLE TO EQUITY HOLDERS reached CHF 643 million for the period, an increase of 3.5% compared with CHF 621 million disclosed in December 2017 (3.4% on a constant currency basis). The ADJUSTED BASIC EARNINGS PER SHARE increased by 3.6% (constant currency basis) to reach CHF 95.17 and return on invested capital increased to 24.2% from 21.3% in prior year. CASH FLOW FROM OPERATING ACTIVITIES reached CHF 1 074 million, an increase of CHF 87 million mainly driven by higher net profit and an improvement in net working capital. Net investments in fixed assets were CHF 278 million and the Group completed 8 acquisitions for a total cash consideration of CHF 43 million. In 2018, the Group paid dividends of CHF 573 million. As of 31 December 2018, the Group’s net debt position amounted to CHF 738 million, compared to the CHF 698 million at 31 December 2017. STRATEGIC OBJECTIVES UPDATE During the Investor Days, the Group updated some of its strategic objectives. SGS expects margins of above 17% in 2020. This is based on mid-single-digit organic growth, while maintaining a strong level of cash conversion. Since the start of the 2020 Plan, SGS has acquired CHF 300 million of revenue and the group now expects to accelerate mergers and acquisitions, while remaining disciplined on returns. SGS expects dividend distributions to remain stable compared to the prior year or to grow in line with the improvement in net earnings.
- 5. 5 ACQUISITIONS AND STRATEGIC PARTNERSHIPS The Group completed 8 acquisitions during the year. These acquisitions expand the Group’s service offering and footprint in Agriculture, Food and Life, Consumer and Retail, Transportation, and Industrial. Combined, these companies have added CHF 27 million to the Group’s revenue and CHF 4 million to the operating income in 2018. The Group formed a new strategic partnership by acquiring a minority stake in Imprint Analytics in Austria which provides isotope analysis to the food sector, and focusses on analytical verification of geographic origin and authenticity testing. An investment was made in KomGo SA, a new blockchain-based platform to transform commodity trade finance. SIGNIFICANT MILESTONES During the year, the Group continued to advance its digital evolution to increase productivity, accelerate growth and ensure sustainability. SGS was a co-signor of the Charter of Trust, which seeks to establish cybersecurity standards across supply chains. A new customer portal, SGS online, was also launched in November offering services direct to businesses and consumers. The dashboard review process continued in 2018 and has led to a significant number of projects being undertaken since its implementation in 2015. These small business activities and countries that have not been meeting our margin and growth performance thresholds have been fixed, disposed or closed. To further optimize processes for its World Class Services, SGS took a structured approach to reducing organizational waste and losses, as well as to bring long-term improvements to its workplace organization, quality, and logistics. Laboratory assessments realized during the year will support the Group in implementing and refining its World Class Services. This strategic approach will continue throughout 2019. The Group made significant investments into Laboratory Information Management Systems introducing a new solution this year which is expected to increase efficiency and accelerate the digital evolution. SUBSEQUENT EVENTS The following acquisition was completed after 31 December 2018: LeanSis Productividad (CBE) in Spain, providing consulting and training services in business process improvement. MANAGEMENT FRANÇOIS MARTI, formerly Executive Vice President Industrial, has been appointed Chief Operating Officer North America. LUIS FELIPE ELIAS, formerly Managing Director for Peru Ecuador, has been appointed Chief Operating Officer South Central America. WIM VAN LOON, formerly Managing Director for Benelux, has been appointed Executive Vice President Industrial. CHARLES LY WA HOI, formerly Vice President, Retail Solutions Europe Business Development for Consumer Retail, has been appointed Executive Vice President Consumer Retail. TOBY REEKS joined SGS as Senior Vice President Investor Relations and has been appointed to the Operations Council. Kimmo Fuller (formerly Chief Operating Officer North America), Alejandro Gomez de la Torre (formerly Chief Operating Officer South Central America), and Richard Shentu (formerly Executive Vice President Consumer Retail) have all left the Group. CHAIRMAN OF THE BOARD In July, SGS was deeply saddened to learn that Sergio Marchionne had passed away. The Group was privileged to have him as a Chairman and colleague. He not only made an immense contribution to the success of SGS, which he transformed into the leading TIC company, but also touched the lives of many, both personally and professionally, with his charismatic personality. Sergio held the positions of CEO (2002–2004) and Chairman of the Board (2006–2018) and he will be greatly missed. The Board of Directors has elected Peter Kalantzis as Acting Chairman. SIGNIFICANT SHAREHOLDERS As at 31 December 2018, Groupe Bruxelles Lambert acting through Serena SARL and URDAC held 16.60% (2017: 16.60%). Mr. August von Finck and members of his family acting in concert held 15.52% (2017: 15.03%), BlackRock, Inc. held 4.0% (2017: 4.0%) and MFS Investment Management held 3.02% (2017: 3.02%) of the share capital and voting rights of the company. At the same date, the SGS Group held 1.09% of the share capital of the company (2017: 1.08%). DISTRIBUTION TO SHAREHOLDERS The SGS Board of Directors will recommend to the Annual General Meeting, to be held on 22 March 2019, the approval of a dividend of CHF 78 per share. SHARE BUYBACK PROGRAMS The Group completed its share buyback program that started on 15 May 2017, repurchasing a total amount of CHF 249.9 million. A new share buyback program has been authorized by the SGS Board of Directors of up to CHF 250 million. Details will be announced in due time. SUSTAINABILITY SGS is committed to creating net positive value to society. SGS continues to strive to position itself as the leader in sustainability, not just within the industry, but also in the wider corporate sector. The Group’s positioning allows the company to be better aligned with increasing demands for sustainability from new generations of customers, employees and investors. In 2018, the commitment to sustainability and creating value to society has led to the achievement of several milestones. For the fifth consecutive year, SGS was named the leading company in the industry by the Dow Jones Sustainability Indices (DJSI World and DJSI Europe). For the second time, SGS was included in the FTSE4Good Index. The group also received a gold rating from EcoVadis for the fourth consecutive year and was placed in the top 1% of the evaluated companies. SGS proudly maintained its status as a carbon neutral company and continues to drive down incident rates. The Group also further developed its sustainable supply chain strategy to increase its positive impact beyond the organization, especially in high risk countries, through specific tools such as, self-assessment questionnaires and the SGS Supplier Code of Conduct.
- 6. 6 Peter Kalantzis Acting Chairman of the Board Frankie Ng Chief Executive Officer A new online training for SGS employees was introduced to reinforce its global Human Rights policy released in 2017. For the second year, SGS is a Net Positive company in terms of Value to Society. In 2018, SGS further developed its innovative Impact Valuation Framework. In 2019, this methodology will increase its focus on measuring the value to society associated with SGS’ services. Sustainability leadership is fundamental to the SGS corporate culture and inherently present in many of the Group’s services. Through alignment on the Sustainability Ambitions 2020 and the UN’s Sustainable Development Goals, the Group can lead by example to help the broader corporate sector build a more sustainable economy, environment and society. GUIDANCE 2019 The Group expects to deliver solid organic revenue growth and higher adjusted operating income on a constant currency basis and robust cash flow generation. OUTLOOK 2020 The Group remains committed: • To deliver mid-single-digit organic growth. • To target accelerating Mergers and Acquisitions and remain disciplined on returns. • To achieve an adjusted operating income of above 17% by end of period. • To ensure strong cash conversion. • To maintain best in class return on invested capital. • To at least maintain the dividend or grow it in line with the improvement in net earnings. 22 January 2019
- 8. 8 (CHF million) 2018 2017 PRO-FORMA2 2017 REVENUE 1 062.6 1 018.0 1 016.3 Change in % 4.4 4.6 ADJUSTED OPERATING INCOME¹ 170.5 162.5 162.5 Change in % 4.9 4.9 MARGIN¹ 16.0% 16.0% 16.0% 1. Before amortization of acquired intangibles and non-recurring items (see Note 4). – 2. Constant currency basis. AGRICULTURE, FOOD AND LIFE GROWTH AND REVENUE Agriculture, Food and Life achieved solid revenue growth of 4.4% (of which 2.4% organic) to CHF 1 063 million for the year, with Food and Life activities continuing their strong growth trends from the first half, well into the second semester. Food delivered strong growth across the portfolio fueled by increased demand for food certification services across the network and high testing volumes, particularly in Asia. These results were complemented by growing demand for digital solutions. Life Laboratory activities continued to deliver strong growth benefiting from recent investments into capacity and capabilities as well as increased focus on strong market growth segments. While Trade showed some recovery in parts of South America and Eastern Europe, the export activities from other European origins remained slow with exports impacted by the summer heat wave. Seed and Crop was also impacted by the weather events and prevailing market conditions which remain challenging for contract research activities in the short term. Meanwhile, the business continued to focus on the diversification of precision agriculture solutions. ADJUSTED OPERATING MARGIN The adjusted operating margin remained stable at 16.0% versus prior year (constant currency basis), with incremental margins from Food and Life activities offset by continued organic investments in laboratory capacity and capabilities as well as in further development of our digital initiatives. ACQUISITIONS During the year, SGS acquired four companies, enhancing its portfolio and geographical network across all strategic business units. Vanguard Sciences Inc. in the USA, is the leading provider of food safety testing services in the areas of product testing, research development and food safety consultation. Laboratoire de Contrôle et d’Analyse in Belgium, is a provider of chemical and microbiological testing and consultancy services. TraitGenetics GmbH in Germany, utilizes state-of-the- art technologies for the development and analysis of molecular markers for plant breeding research. Oleotest NV in Belgium, is a provider of chemical testing services in food, feed and agricultural commodities. The Group secured the renewal of our contract with OAIC, Algeria’s state grain procurement agency for a further two years. This is the single largest trade contract in the market and represents 7 to 9 million metric tons of cargo inspections per year.
- 9. 9 (CHF million) 2018 2017 PRO-FORMA2 2017 REVENUE 750.1 673.5 683.6 Change in % 11.4 9.7 ADJUSTED OPERATING INCOME¹ 121.1 102.0 104.6 Change in % 18.7 15.8 MARGIN¹ 16.1% 15.1% 15.3% 1. Before amortization of acquired intangibles and non-recurring items (see Note 4). – 2. Constant currency basis. MINERALS GROWTH AND REVENUE Minerals delivered revenue growth of 11.4% (entirely organic) to CHF 750 million for the year, as the mining sector maintained its momentum in the second semester. Buoyant market conditions combined with solid business development initiatives drove growth across all strategic business units as well as all regions. Volumes remained strong in the Trade inspection for bulk commodities, with outstanding contribution from Russia, the USA, Colombia, Australia and Indonesia for Energy Minerals. Geochemistry benefited from increased sample volumes in the commercial laboratory network predominantly in Peru, Australia, Russia, Tanzania and South Africa. SGS strengthened its leadership position in the onsite laboratory business, securing 7 onsite laboratories in 2018, including new projects in the USA and Brazil. Double-digit growth was achieved in Metallurgy services, attributed to the increase in pilot plant activity and traditional metallurgical test work in Australia, Chile and Canada. The Process Engineering division also achieved strong growth due to an improved project pipeline, with projects in new markets including Kazakhstan, French Guinea and Botswana. Growth was significant in Eastern Europe and across Asia as the business continued to deliver service scope expansion in these growing and diverse markets. SGS continued to invest in capacity expansion and diversify the service offering with a focus on niche services to further solidify its market position. Speed to market was the focus in 2018 and formed the basis of the launch of new initiatives such as Field Analytical Services Testing (FAST) to give clients the option of having field analyses carried out closer to their drilling operations. Additionally, SGS signed a strategic collaboration agreement with Minalyze AB, a Swedish group specializing in the development and production of advanced analytical instruments for geological data acquisition and related software for data visualization. This collaboration will provide near real-time geochemical-based analysis on drill core using the Minalyzer CS scanner which is fully aligned to the FAST strategy. ADJUSTED OPERATING MARGIN The adjusted operating margin increased to 16.1% from 15.1% in prior year (constant currency basis), resulting primarily from a favorable service mix and ongoing optimization and capacity utilization throughout the laboratory network. SGS is working with Goldcorp Inc. to unlock potential from historical data to expand gold resources using Machine Learning predictive algorithms to improve the geological model, and ultimately, help to generate new exploration targets.
- 10. 10 (CHF million) 2018 2017 PRO-FORMA2 2017 REVENUE 1 220.2 1 137.8 1 138.8 Change in % 7.2 7.1 ADJUSTED OPERATING INCOME¹ 116.1 120.4 119.7 Change in % (3.6) (3.0) MARGIN¹ 9.5% 10.6% 10.5% 1. Before amortization of acquired intangibles and non-recurring items (see Note 4). – 2. Constant currency basis. OIL, GAS AND CHEMICALS GROWTH AND REVENUE Oil, Gas and Chemicals reported an increase in revenue of 7.2% (entirely organic) to CHF 1 220 million for the year, with second semester performance remaining stable across the different segments of the Oil and Gas value chain in comparison to the first half of the year. Despite the significant drop that unexpectedly affected the oil price at the end of the fourth quarter, overall investment confidence improved in 2018. Trade-related services grew in low single digits reflecting increased volatility in the markets in Europe, Africa and the Middle East, along with strong growth in Asia. Plant and Terminal Operations achieved outstanding double-digit growth specifically in the USA, capitalizing on significant contract wins. Upstream services delivered low- single-digit growth from new contracts in the Middle East and Northern Africa. The business has been successful in establishing a solid project pipeline to back future growth in the production segment. Non-Inspection-Related-Testing activities declined in mid-single digits during the second half of the year hampered by delay in laboratory commissioning projects. Fuel Integrity Programs activity benefited from significant contract wins and momentum, this was mirrored across Sample Management, Metering and Instruments, as well as Cargo Treatment Services, demonstrating the strength of these strategic business segments. ADJUSTED OPERATING MARGIN The adjusted operating margin decreased from 10.6% in prior year (constant currency basis) to 9.5%, due to the change in business mix and the investments undertaken in our North American trade business to adapt to the competitive climate. SGS New Zealand secured a Todd Energy Well Testing Services contract for an initial three years to supply well test and high pressure hole stimulation flow back operations, primarily for their next phase of the Mangahewa development.
- 11. 11 (CHF million) 2018 2017 PRO-FORMA2 2017 REVENUE 1 025.4 965.8 963.2 Change in % 6.2 6.5 ADJUSTED OPERATING INCOME¹ 266.9 247.6 246.9 Change in % 7.8 8.1 MARGIN¹ 26.0% 25.6% 25.6% 1. Before amortization of acquired intangibles and non-recurring items (see Note 4). – 2. Constant currency basis. CONSUMER AND RETAIL GROWTH AND REVENUE Consumer and Retail delivered revenue growth of 6.2% (of which 5.2% organic) to CHF 1 025 million for the year, driven by double-digit growth in South East Asia Pacific, Eastern Europe and the Middle East and solid single-digit growth in North East Asia and Western Europe. Electrical and Electronics (EE) benefited from robust volumes in Restrictive Substance Testing boosted by the addition of new substances to the Restriction of Hazardous Substances regulations. Safety Testing delivered strong results mainly in China, Japan and Taiwan, in Microelectronics and Functional Safety. Cosmetics, Personal Care and Household (CPCH) grew strongly, driven by China and acquisitions in North America and Germany. Softlines improved in the second semester benefiting from strong growth in new sourcing countries, including Bangladesh, Vietnam and Cambodia, as well as from new testing programs in Turkey. In the textile industry, new sustainability solutions to improve chemical risk management in customer supply chains led to increased market share in footwear and leather testing. Increasing volumes from our key accounts and new global customers supported growth, despite a challenging market environment. A focus on high-growth Hardgoods categories, market share gains with eRetailers and ePlatforms, as well as capacity expansion in new sourcing countries contributed to the solid performance of Hardlines. This performance compensated for difficult market conditions in toys testing. ADJUSTED OPERATING MARGIN The adjusted operating margin increased to 26.0% from 25.6% in prior year (constant currency basis), benefiting from the positive impact of operational excellence and automation projects in EE activities and high growth in CPCH. These helped to offset some pressure in Softlines and Hardlines. ACQUISITIONS During the year, the Group acquired SIT Skin Investigation Technology Hamburg GmbH in Germany, expanding the business portfolio into the testing sector for skin care; and Inter-Basic Resources (IBR) Inc. in the USA and the UK providing state-of-the-art testing and verification for air and fluid filtration performance across multiple industries. SGS secured a new global contract with a large retailer in the USA. The contract covers inspection, testing and auditing services for home textiles and an expanding portfolio of hardlines categories.
- 12. 12 (CHF million) 2018 2017 PRO-FORMA2 2017 REVENUE 366.0 342.1 340.3 Change in % 7.0 7.6 ADJUSTED OPERATING INCOME¹ 69.6 64.7 64.3 Change in % 7.6 8.2 MARGIN¹ 19.0% 18.9% 18.9% 1. Before amortization of acquired intangibles and non-recurring items (see Note 4). – 2. Constant currency basis. CERTIFICATION AND BUSINESS ENHANCEMENT GROWTH AND REVENUE Certification and Business Enhancement delivered solid revenue growth of 7.0% (of which 6.2% organic) to CHF 366 million for the year, mostly driven by Management System services. Management System Certification reported robust growth driven by the transition audits related to ISO 9001:2015 and 14001:2015 standards. As of the end of 2018, all regions have reached or exceeded their transitions targets. Information Security certification (ISO 27000) achieved strong double-digit growth as customers aligned with new data regulations being introduced around the world. The need to provide assurance against data breaches and demonstrate that data is managed securely has become critical in all industries. Performance assessment delivered robust results with an improved second half of the year and new global project wins. The further roll out of the cloud- based Customer Assessment Tracking System (CATS) allowing customers to get live detailed information about their auditing program helped support these results. The launch of Business Enhancement Engine, an advanced analytical tool providing full access to the Group’s customer certification database has helped to provide insights into customer pain points and develop new training and technical consulting services. Training activities reported a slight revenue decrease due to the expected end of the demand for ISO standards transition courses. Continued expansion of the training catalog diversifying from traditional certification training, development of regional content factories in Brazil and the Philippines, along with new delivery methods, such as remote learning, has allowed the business to gradually decrease dependency on certification and tap into new growth potential. ADJUSTED OPERATING MARGIN The adjusted operating margin increased to 19.0% from 18.9% in prior year (constant currency basis), mostly due to excellent performance in Certification activity in all regions which drove increased operational efficiency and margin. SGS helped one of the world’s largest global eRetailers to analyze and benchmark audit data using its Business Enhancement Engine. SGS reviewed 10 000 audits for the client’s suppliers and provided a clear picture on the reliability of their production moving forward.
- 13. 13 (CHF million) 2018 2017 PRO-FORMA2 2017 REVENUE 940.2 897.3 906.5 Change in % 4.8 3.7 ADJUSTED OPERATING INCOME¹ 84.2 73.7 73.4 Change in % 14.2 14.7 MARGIN¹ 9.0% 8.2% 8.1% 1. Before amortization of acquired intangibles and non-recurring items (see Note 4). – 2. Constant currency basis. INDUSTRIAL GROWTH AND REVENUE Industrial reported revenue growth of 4.8% (of which 4.0% organic) delivering CHF 940 million for the year, buoyed by three of its major market segments. The Oil and Gas segment continued to grow with large supervision contract wins in South America and inspection services related to refinery shutdowns in Asia, Europe and the Middle East. These higher margin activities were partially offset by the slow upturn of capital investment-related projects. Laboratory services benefited from an increased service offering following the acquisition of Polymer Solutions Incorporated in North America. The Infrastructure and Construction segment delivered high single-digits growth driven by Construction Material testing activities in all regions and a strong demand for Supervision and Consulting services in South America, Asia and Europe. The Manufacturing segment grew in low single digits from a strong uptick in Polymers and Calibration laboratory testing, as well as in Western Europe. Services targeting the Power and Utilities sector declined due to the projected slowdown in inspection programs in Europe and the end of certain supervision projects related to construction of transmission lines in South America. ADJUSTED OPERATING MARGIN The adjusted operating margin improved to 9.0% from 8.2% in prior year (constant currency basis). The margin has improved due to the strategic focus on pricing, the expansion of the laboratory testing network, the discontinuation of low margin activities and the focus on profitable segments in Supervision and Consulting activities. These improvements helped to offset measures taken in Brazil. ACQUISITIONS During the year, the Group acquired Polymer Solutions Incorporated (PSI) in the USA. PSI is an independent material testing laboratory specializing in polymer science, which strategically enhances the Group’s global platform of materials science and testing laboratories as well as expanding its footprint in the USA. The recently acquired polymer testing laboratories in the USA are testing specific conducting polymers used in Dynamic Tintable Windows (Smart Windows) that reduce energy consumption and improve sustainability by changing tint based on weather conditions.
- 14. 14 (CHF million) 2018 2017 PRO-FORMA2 2017 REVENUE 517.2 489.2 485.8 Change in % 5.7 6.5 ADJUSTED OPERATING INCOME¹ 57.4 49.2 48.6 Change in % 16.7 18.1 MARGIN¹ 11.1% 10.1% 10.0% 1. Before amortization of acquired intangibles and non-recurring items (see Note 4). – 2. Constant currency basis. ENVIRONMENT, HEALTH AND SAFETY GROWTH AND REVENUE Environment, Health and Safety reported revenue growth of 5.7% (entirely organic) to CHF 517 million for the year. All strategic business units delivered strong performances with an improved contribution from Laboratory and Health Safety services. Geographically, revenue growth was driven by Europe, North East Asia and North America. Laboratory services delivered strong growth attributed to improved network and resource optimization. A refined global sales strategy strengthened Health Safety services establishing a best-in-class position. Field services delivered good growth supported by a high level of expertise and innovation. The recent signature of the Ballast Water convention and preparation for the implementation of IMO 2020 have opened new development opportunities for Marine services. Significant market opportunities led to high-double-digit growth for Perfluorooctanoic acid testing in the USA, Canada and Australia. Recent portfolio optimization in Europe, South America and Africa coupled with targeted divestments improved productivity and efficiency with a renewed focus on core business. This allowed the business to improve overall growth at rates above market averages. ADJUSTED OPERATING MARGIN The adjusted operating margin increased to 11.1% from 10.1% in prior year (constant currency basis). The execution of important contracts in the USA offsetting earlier weakness in the market, a strong portfolio mix of Testing and Health Safety work in Europe and a positive return on investments in Asia Pacific contributed to the margin growth. The focus on digitalization and central data management also provided further efficiencies and improved productivity. SGS successfully delivered a highly technical project for Geotechnical investigation on water for the Antwerp Port Authority in Belgium demonstrating a strong in-house expertise in this high-end market segment.
- 15. 15 (CHF million) 2018 2017 PRO-FORMA2 2017 REVENUE 540.5 541.4 546.5 Change in % (0.2) (1.1) ADJUSTED OPERATING INCOME¹ 82.8 91.7 89.9 Change in % (9.7) (7.9) MARGIN¹ 15.3% 16.9% 16.5% 1. Before amortization of acquired intangibles and non-recurring items (see Note 4). – 2. Constant currency basis. TRANSPORTATION GROWTH AND REVENUE Transportation delivered stable revenue of -0.2% (of which -0.7% organic) to CHF 541 million for the year, with Testing services growing across all segments and high volumes in Supply Chain services offsetting declines in other activities. Road Safety and Emission services delivered stable growth in Africa despite the temporary slowdown of the Motor Vehicle Safety and Emission services in Uganda. Whereas, the more mature European and American markets saw a minor decline. Homologation activities in Germany delivered double-digit growth linked to the new homologation standard. Testing services delivered double-digit growth across all segments reflecting the strength of past investments. In the Materials segment, demand for components testing remained strong from automotive manufacturers and suppliers in China, Europe, India and the USA. Powertrain grew in double digits due to vehicle and engine testing in the USA. The replication of our catalyst aging services in Korea also contributed to growth. Battery testing experienced an uptake linked to Automotive Industries’ growing investment in new Hybrid and Full Electric Vehicles. Field Services benefited from strong volumes for certification services from the transition to the new International Automotive Task Force (IATF) standard, as well as stable Asset Assessments in Europe, which compensated for the completion of a major contract in the USA. ADJUSTED OPERATING MARGIN The adjusted operating margin decreased from 16.9% in prior year to (constant currency basis) 15.3%, due to losses generated from the end of a major Asset Assessment contract in the USA, lower volumes and rates of the new concession in Chile and the temporary slowdown of the Road Safety activities in Uganda. All other activities maintained or improved the margin. ACQUISITIONS During the year, the Group acquired Advanced Metrology Solutions S.L. based in Spain, a specialist in 3D metrology precision services and high precision measurements in the aerospace industry. This acquisition helps SGS expand into the fast- growing 3D metrology and dimensional measurement inspection services in Spain and Europe. SGS opened a new eMobility laboratory in Germany significantly increasing its Testing capacities for the Automotive Industry. This state-of-the-art facility offers a full range of services related to the new generation of Hybrid and Full Electric Vehicles.
- 16. 16 (CHF million) 2018 2017 PRO-FORMA2 2017 REVENUE 283.6 263.9 268.1 Change in % 7.5 5.8 ADJUSTED OPERATING INCOME¹ 81.3 56.7 58.7 Change in % 43.4 38.5 MARGIN¹ 28.7% 21.5% 21.9% 1. Before amortization of acquired intangibles and non-recurring items (see Note 4). – 2. Constant currency basis. GOVERNMENTS AND INSTITUTIONS GROWTH AND REVENUE Governments and Institutions delivered strong revenue growth of 7.5% (of which 6.3% organic) to CHF 284 million for the year, resulting from solid performance in TransitNet, Single Window, Tracking and Scanning services, all in line with expectations. The aggressive marketing strategy for TransitNet has translated into an increase in market share in key countries, as well as expansion into new territories. Clients that are using SGS Single Window, SGS eValuator and the SGS D-Tect® solution as part of their overall strategy to improve trade efficiency and compliance have seen significant improvements in trade volumes and security. Business teams managing Product Conformity Assessment (PCA) programs that were due for renewal, have successfully convinced clients to extend their trust in its services. Furthermore, SGS has won a new contract from the government of Ivory Coast which has helped to compensate for the completion of the Kurdistan program in 2017. 30 000 inspections have now been conducted by SGS QiiQ, the remote inspections tool which was fully deployed during the year. This digital tool has established a new standard in the industry. The business has continued to successfully deliver the GeGov contract in Ghana, providing support and maintenance services. SGS Renovo, a unique e-waste monitoring program, also started in Ghana and officially launched in the Ivory Coast. The Russian Federation and Georgia signed a contract with SGS in May to implement an Advanced Cargo Information portal which has contributed to growth for the business. ADJUSTED OPERATING MARGIN The adjusted operating margin improved to 28.7% from 21.5% in prior year (constant currency basis), driven by economies of scale, a revised pricing strategy and better collection management. Several new initiatives also helped to support improved margin, such as the full deployment of SGS QiiQ, the Robotic Process Automation program and the launch of the PCA Exporter portal. The launch of the new SGS onTrack will assist the tobacco industry in meeting EU regulations on traceability which goes into effect in May 2019.
- 17. 17 CONDENSED CONSOLIDATED FINANCIAL STATEMENTS FOR THE PERIOD ENDED 31 DECEMBER 2018 (CHF million) NOTES 2018 2017 REVENUE 6 706 6 349 Salaries, wages and subcontractors’ expenses (3 809) (3 587) Depreciation, amortization and impairment (317) (338) Other operating expenses (1 634) (1 530) OPERATING INCOME (EBIT) 4 946 894 Net financial expenses (38) (43) PROFIT BEFORE TAXES 908 851 Taxes (218) (187) PROFIT FOR THE PERIOD 690 664 Profit attributable to: Equity holders of SGS SA 643 621 Non-controlling interests 47 43 BASIC EARNINGS PER SHARE (IN CHF) 5 84.54 82.41 DILUTED EARNINGS PER SHARE (IN CHF) 5 84.32 82.27 CONDENSED CONSOLIDATED INCOME STATEMENT CONDENSED CONSOLIDATED STATEMENT OF COMPREHENSIVE INCOME (CHF million) 2018 2017 Actuarial gains/(losses) on defined benefit plans 6 22 Income tax on actuarial gains/(losses) taken directly to equity 1 (30) Items that will be not subsequently reclassified to income statement 7 (8) Exchange differences (153) 31 Items that may be subsequently reclassified to income statement (153) 31 OTHER COMPREHENSIVE INCOME/(LOSS) FOR THE PERIOD (146) 23 Profit for the period 690 664 TOTAL COMPREHENSIVE INCOME FOR THE PERIOD 544 687 Attributable to: Equity holders of SGS SA 501 644 Non-controlling interests 43 43
- 18. 18 CONDENSED CONSOLIDATED BALANCE SHEET (CHF million) 2018 2017 NON-CURRENT ASSETS Property, Plant and Equipment 969 1 002 Goodwill and other intangible assets 1 426 1 460 Other non-current assets 372 341 TOTAL NON-CURRENT ASSETS 2 767 2 803 CURRENT ASSETS Unbilled revenues and Work in Progress 226 293 Trade receivables 969 1 068 Other current assets 354 386 Cash and marketable securities 1 752 1 393 TOTAL CURRENT ASSETS 3 301 3 140 TOTAL ASSETS 6 068 5 943 TOTAL EQUITY 1 743 2 005 NON-CURRENT LIABILITIES Loans and obligations under finance leases 2 112 2 090 Provisions and other non-current liabilities 238 267 TOTAL NON-CURRENT LIABILITIES 2 350 2 357 CURRENT LIABILITIES Loans and obligations under finance leases 378 1 Trade and other payables 709 677 Contract liabilities 112 97 Other current liabilities 776 806 TOTAL CURRENT LIABILITIES 1 975 1 581 TOTAL LIABILITIES 4 325 3 938 TOTAL EQUITY AND LIABILITIES 6 068 5 943 CONDENSED CONSOLIDATED STATEMENT OF CHANGES IN EQUITY ATTRIBUTABLE TO (CHF million) NOTES EQUITY HOLDERS OF SGS SA NON-CONTROLLING INTERESTS TOTAL EQUITY BALANCE AT 1 JANUARY 2017 1 773 80 1 853 Total comprehensive income for the period 644 43 687 Dividends paid (528) (40) (568) Share-based payments 17 - 17 Movement in non-controlling interests (2) 3 1 Movement on treasury shares 15 - 15 BALANCE AS AT 31 DECEMBER 2017 1 919 86 2 005 BALANCE AT 1 JANUARY 2018 1 919 86 2 005 IFRS 9 adjustments 3 (87) (4) (91) BALANCE AT 1 JANUARY 2018 RESTATED 1 832 82 1 914 Total comprehensive income for the period 501 43 544 Dividends paid (573) (41) (614) Share-based payments 13 - 13 Movement in non-controlling interests 8 (9) (1) Movement on treasury shares (113) - (113) BALANCE AS AT 31 DECEMBER 2018 1 668 75 1 743
- 19. 19 CONDENSED CONSOLIDATED CASH FLOW STATEMENT (CHF million) 2018 2017 PROFIT FOR THE PERIOD 690 664 Non-cash and non-operating items 554 565 (Increase)/Decrease in working capital 95 (1) Taxes paid (265) (241) CASH FLOW FROM OPERATING ACTIVITIES 1 074 987 Net purchase of fixed assets (278) (281) Net acquisition of businesses (45) (35) Decrease in marketable securities and other 9 5 CASH FLOW USED BY INVESTING ACTIVITIES (314) (311) Dividends paid to equity holders of SGS SA (573) (528) Dividends paid to non-controlling interests (43) (40) Transactions with non-controlling interests (2) 1 Net cash received/(paid) on treasury shares (93) 13 Proceed of corporate bonds 401 374 Interest paid (60) (56) Decrease in borrowings - (3) CASH FLOW USED BY FINANCING ACTIVITIES (370) (239) Currency translation (30) (29) INCREASE IN CASH AND CASH EQUIVALENTS 360 408 1. ACTIVITIES OF THE GROUP SGS SA and its subsidiaries (the “Group”) operate around the world under the name SGS. The head office of the Group is located in Geneva, Switzerland. SGS is the global leader in inspection, verification, testing and certification services supporting international trade in agriculture, minerals, petroleum and consumer products. It also provides these services to governments, international institutions and customers engaged in the industrial, environmental and life science sectors. 2. BASIS OF PREPARATION These condensed consolidated financial statements have been prepared in accordance with the measurement and recognition criteria of International Financial Reporting Standards (IFRS). 3. CHANGES TO THE GROUP’S ACCOUNTING POLICIES As of 1 January 2018, the following standards were adopted: IFRS 15 REVENUE FROM CONTRACTS WITH CUSTOMERS IFRS 15 amends revenue recognition requirements and establishes principles for reporting information about the nature, amount, timing and uncertainty of revenue and cash flows arising from contracts with customers. The Group has adopted IFRS 15 as of 1 January 2018 through the full retrospective approach. The impact is not significant for the Group. IFRS 9 FINANCIAL INSTRUMENTS IFRS 9 Financial Instruments substantially changes the classification and measurement of financial instruments, changes the approach to hedging financial exposures and related documentation as well as the recognition of certain fair value changes. The impact is not significant for the Group. IFRS 9 also requires impairments to be based on a forward-looking model. As a result, the Group has adopted a new impairment model to measure its financial assets. The new impairment model is an expected credit loss model which may result in the earlier recognition of credit losses than the incurred loss impairment model used in accordance with IAS 39. The Group has applied IFRS 9 retrospectively from 1 January 2018. The adjustment to the carrying value of the financial assets has been reflected as an adjustment to the opening equity. NOTES TO THE CONDENSED CONSOLIDATED FINANCIAL STATEMENTS
- 20. 20 The following table summarizes the impact on the statement of financial position increase/(decrease) due to IFRS 9 adoption as of 1 January 2018. (CHF million) ADJUSTMENTS Other non-current assets 30 Unbilled revenues and Work in Progress (29) Trade receivables (92) TOTAL ASSETS (91) Equity Holders of SGS SA (87) Non-controlling Interests (4) TOTAL EQUITY (91) Note: The impact due to IFRS 9 adoption as of 1 January 2018, disclosed in note 3 of the interim financial statements for the six months ended 30 June 2018, has been restated to reflect the finalization of the Group’s expected credit loss model. As a result, the overstatement of Total Assets and Equity has been corrected for an amount of CHF 14 million as of 1 January 2018, resulting in a full year impact of CHF 91 million. The 2018 balance sheet figures take into account these adjustments. The Group assessed that the adoption of the new interpretations and amendments does not significantly affect the information already disclosed by the Group. Following the adoption of IFRS 9 and IFRS 15 as of 1 January 2018, the Group’s accounting policies have changed as follows: REVENUE IFRS 15 supersedes IAS 11 Construction Contracts, IAS 18 Revenue and related Interpretations and it applies to all revenue arising from contracts with customers, unless those contracts are in the scope of other standards. The new standard establishes a five-step model to account for revenue arising from contracts with customers. Under IFRS 15, revenue is recognized at an amount that reflects the consideration to which an entity expects to be entitled in exchange for transferring services to a customer. The standard requires entities to exercise judgement, taking into consideration all of the relevant facts and circumstances when applying each step of the model to contracts with their customers. The Group’s main activities consist of services rendered in the areas of inspection, verification, testing and certification. Revenue is recognized according to the five-step model as described by IFRS 15. The Group’s two main revenue recognition models are: •• Services transferred at a point in time Most of the Group’s revenues are recognized at a point in time when performance obligations are satisfied as services are rendered. •• Services transferred over time For long-term service contracts, performance obligations are satisfied over time and revenue is recognized based on the measure of progress. When the Group has a right to consideration from a customer at the amount corresponding directly to the customer’s value of the performance completed to date, the Group recognizes revenue in the amount to which it has a right to invoice. In all other situations, the measure of progress is either based on observable output methods (usually the number of tests or inspections performed) or based on input method such as the time incurred to date relative to the total expected hours to the satisfaction of the performance obligation. TRADE RECEIVABLES Trade receivables are recognized and carried at original invoice amount less an allowance for any non-collectible amounts. An allowance for doubtful debts is made in compliance with the simplified approach using a provision matrix (expected credit loss model). This provision matrix has been developed to reflect the country risk, the credit risk profile, as well as available historical data. In addition, an allowance for doubtful debts is made when collection of the amount is no longer probable. Bad debts are written off when identified. UNBILLED REVENUES AND WORK IN PROGRESS Unbilled Revenues are recognized for services completed but not yet invoiced and are valued at net selling prices. Work in Progress are recognized for the partially finished performance obligations under a contract. The measure of progress is either based on observable output methods or based on input methods. A margin is recognized based on actual costs incurred, provided that the project is expected to be profitable once completed. Similarly to receivables, an allowance for unbilled revenues and work in progress is made in compliance with the simplified approach using a provision matrix (expected credit loss model). SIGNIFICANT ACCOUNTING JUDGEMENTS AND ESTIMATES VALUATION OF TRADE ACCOUNTS, NOTES RECEIVABLE, UNBILLED REVENUE AND WORK IN PROGRESS Trade accounts and notes receivable are reflected net of an estimated allowance for doubtful accounts. Unbilled revenues are recognized for services completed but not yet invoiced and are valued at net selling price. Work in Progress are recognized for the partially rendered performance obligations under a contract. The measure of progress is either based on observable output methods or based on input methods. A margin is recognized based on actual costs incurred, provided that the project is expected to be profitable once completed. Allowances for potential non-collectible amounts are estimated based primarily on the Group’s ageing policy guidelines, individual client analysis and an analysis of the underlying risk profile of each major revenue stream by business and geography.
- 21. 21 4. ANALYSIS OF OPERATING INCOME (CHF million) 2018 2017 ADJUSTED OPERATING INCOME 1 050 969 Amortization of acquired intangibles (30) (29) Restructuring costs (19) (7) Goodwill impairment - (30) Other non-recurring items1 (55) (9) OPERATING INCOME 946 894 1. 2018 includes CHF 47 million for cumulative overstated revenues reported in prior periods in Brazil and associated costs. The amounts are not deemed material to prior periods financial statements and have been recorded in the current period. (CHF million) REVENUE ADJUSTED OPERATING INCOME AMORTIZATION OF ACQUISITION INTANGIBLES RESTRUCTURING COSTS GOODWILL IMPAIRMENT OTHER NON- RECURRING ITEMS OPERATING INCOME BY BUSINESS 2018 Agriculture, Food and Life (AFL) 1 063 171 (4) (2) - (3) 162 Minerals (MIN) 750 121 (1) (2) - - 118 Oil, Gas and Chemicals (OGC) 1 220 116 (2) (3) - - 111 Consumer Retail (CRS) 1 025 267 (3) (1) - (2) 261 Certification and Business Enhancement (CBE) 366 70 - (1) - - 69 Industrial (IND) 940 84 (8) (8) - (46) 22 Environment, Health and Safety (EHS) 517 57 (4) (1) - (2) 50 Transportation (TRP) 541 83 (7) (1) - (2) 73 Governments and Institutions (GIS) 284 81 (1) - - - 80 TOTAL 6 706 1 050 (30) (19) - (55) 946 (CHF million) REVENUE ADJUSTED OPERATING INCOME AMORTIZATION OF ACQUISITION INTANGIBLES RESTRUCTURING COSTS GOODWILL IMPAIRMENT OTHER NON- RECURRING ITEMS OPERATING INCOME BY BUSINESS 2017 Agriculture, Food and Life (AFL) 1 016 162 (2) (2) - (3) 155 Minerals (MIN) 684 105 (2) - - - 103 Oil, Gas and Chemicals (OGC) 1 139 120 (2) (1) - - 117 Consumer Retail (CRS) 963 247 (3) (1) - (1) 242 Certification and Business Enhancement (CBE) 340 64 - (1) - - 63 Industrial (IND) 906 73 (8) (1) (30) (2) 32 Environment, Health and Safety (EHS) 486 49 (5) (1) - (1) 42 Transportation (TRP) 547 90 (7) - - (1) 82 Governments and Institutions (GIS) 268 59 - - - (1) 58 TOTAL 6 349 969 (29) (7) (30) (9) 894 All segment revenues reported above are from external customers. The adjusted operating income represents the profit earned by each segment. This is the main measure reported to the chief operating decision makers for the purposes of resource allocation and assessment of segmental performances.
- 22. 22 5. EARNINGS PER SHARE 2018 2017 Profit attributable to equity holders of SGS SA (CHF million) 643 621 Weighted average number of shares ('000) 7 607 7 541 BASIC EARNINGS PER SHARE (CHF) 84.54 82.41 2018 2017 Profit attributable to equity holders of SGS SA (CHF million) 643 621 Diluted weighted average number of shares ('000) 7 626 7 553 DILUTED EARNINGS PER SHARE (CHF) 84.32 82.27 6. EXCHANGE RATES BALANCE SHEET YEAR-END RATES INCOME STATEMENT ANNUAL AVERAGE RATES 2018 2017 2018 2017 Australia AUD 100 69.51 76.19 73.14 75.45 Brazil BRL 100 25.44 29.46 26.94 30.85 Canada CAD 100 72.41 77.84 75.53 75.89 Chile CLP 100 0.14 0.16 0.15 0.15 China CNY 100 14.35 14.99 14.81 14.57 Eurozone EUR 100 112.91 116.80 115.54 111.15 United Kingdom GBP 100 124.67 131.81 130.61 126.83 Russia RUB 100 1.42 1.70 1.57 1.69 Taiwan TWD 100 3.22 3.29 3.25 3.24 USA USD 100 98.55 97.59 97.84 98.49 DISCLAIMER This material is provided for information purposes only and is not intended to confer any legal rights to you. This document does not constitute an invitation to invest in SGS shares. Any decisions you make in reliance on this information are solely your responsibility. This document is given as of the dates specified, is not updated and any forward-looking statements are made subject to the following reservations: This document contains certain forward-looking statements that are neither historical facts nor guarantees of future performance. Because these statements involve risks and uncertainties that are beyond control or estimation of SGS, there are important factors that could cause actual results to differ materially from those expressed or implied by these forward-looking statements. These statements speak only as of the date of this document. Except as required by any applicable law or regulation, SGS expressly disclaims any obligation to release publicly any updates or revisions to any forward looking statements contained herein to reflect any change in SGS Group’s expectations with regard thereto or any change in events or conditions on which any such statements are based.
- 23. 23 SHAREHOLDER INFORMATION SGS SA CORPORATE OFFICE 1 place des Alpes P.O. Box 2152 CH – 1211 Geneva 1 t +41 (0)22 739 91 11 f +41 (0)22 739 98 86 e sgs.investor.relations@sgs.com www.sgs.com ANNUAL GENERAL MEETING OF SHAREHOLDERS Friday, 22 March 2019 Geneva, Switzerland 2019 HALF YEAR RESULTS Thursday, 18 July 2019 INVESTOR DAYS – LOCATION TO BE DETERMINED Thursday and Friday 7 and 8 November 2019 DIVIDEND PAYMENT DATE Ex-Date: 26 March 2019 Record data: 27 March 2019 Payment date: 28 March 2019 STOCK EXCHANGE LISTING SIX Swiss Exchange, SGSN STOCK EXCHANGE TRADING SIX Swiss Exchange COMMON STOCK SYMBOLS Bloomberg: Registered Share: SGSN.VX Reuters: Registered Share: SGSN.VX Telekurs: Registered Share: SGSN ISIN: Registered Share: CH0002497458 Swiss security number: 249745 INVESTOR RELATIONS Toby Reeks SGS SA 1 place des Alpes P.O. Box 2152 CH – 1211 Geneva 1 t +41 (0)22 739 99 87 m +41 (0)79 641 83 02 www.sgs.com MEDIA RELATIONS Daniel Rufenacht SGS SA 1 place des Alpes P.O. Box 2152 CH – 1211 Geneva 1 t +41 (0)22 739 94 01 m +41 (0)78 656 94 59 www.sgs.com