GLOBAL VALUE CHAIN MAP: A Template for Mapping Value Chains, Business Models, and Business Performances
•Download as PPTX, PDF•
3 likes•3,823 views

The Global Value Chain (VC) Map is the most versatile tool in business strategy and innovation. The Global VC Map can be used for visually summarizing Michael Porter's Five Forces and Value Chain as well as for managing business performance as in the Kaplan & Norton's Balanced Scorecard. The Global VC Map can also be used for analyzing and designing business (Six Sigma) processes as well as innovative business models. As a scalable tool, the Global VC map can be used to map the business model of an enterprise, industry/sector, and economy.

Recommended
More Related Content
Viewers also liked
Viewers also liked (20)
Similar to GLOBAL VALUE CHAIN MAP: A Template for Mapping Value Chains, Business Models, and Business Performances
Similar to GLOBAL VALUE CHAIN MAP: A Template for Mapping Value Chains, Business Models, and Business Performances (20)
More from Rod King, Ph.D.
More from Rod King, Ph.D. (20)
Recently uploaded
Recently uploaded (20)
GLOBAL VALUE CHAIN MAP: A Template for Mapping Value Chains, Business Models, and Business Performances
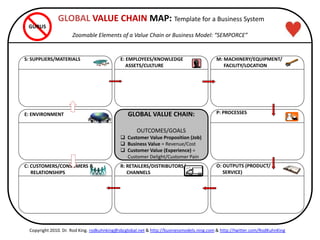
- 1. ITENNE: ENVIRONMENT P: PROCESSES S: SUPPLIERS/MATERIALS R: RETAILERS/DISTRIBUTORS/ CHANNELS O: OUTPUTS (PRODUCT/ SERVICE) E: EMPLOYEES/KNOWLEDGE ASSETS/CULTURE GLOBAL VALUE CHAIN: OUTCOMES/GOALS Customer Value Proposition (Job) Business Value = Revenue/Cost Customer Value (Experience) = Customer Delight/Customer Pain M: MACHINERY/EQUIPMENT/ FACILITY/LOCATION C: CUSTOMERS/CONSUMERS & RELATIONSHIPS GLOBAL VALUE CHAIN MAP: Template for a Business System Zoomable Elements of a Value Chain or Business Model: “SEMPORCE” GURUS Copyright 2010. Dr. Rod King. rodkuhnking@sbcglobal.net & http://businessmodels.ning.com & http://twitter.com/RodKuhnKing
- 2. ITENNE: ENVIRONMENT/INVESTOR Revenue (Sales) Cash Burn Rate Month of Cash Left Time to Cash Flow-Breakeven Contribution Margin P: PROCESSES Cycle Time for Pivots/Prototyping/ Versioning/Product Releases Average Time to First Order Average Time to Follow-on Order Customer Feedback/Voice S: SUPPLIERS/MATERIALS R: RETAILERS/DISTRIBUTORS/ CHANNELS Advertising Expenses Viral Coefficient O: OUTPUTS (PRODUCT/ SERVICE) No. of Minimum Viable Products No. of Prototypes/Releases Average Size Order Average Selling Price per Order Web Page/Site: Total Visits; Total Page Views E: EMPLOYEES/KNOWLEDGE ASSETS/CULTURE Agile/Lean (‘Small’) Teams Lessons Learned/Insights No. of Experiments/Interviews Effectiveness/Proficiency of Sale Person Revenue per Sale Person GLOBAL VALUE CHAIN DASHBOARD OUTCOMES/GOALS: Customer Value Proposition Business Value = Revenue/Cost Customer Value (Experience) = Customer Delight/Customer Pain M: MACHINERY/EQUIPMENT/ FACILITY/LOCATION C: CUSTOMERS/CONSUMERS & RELATIONSHIPS No. of Prospects/Registrations No. of Customers/Referrals Cost per Acquisition (Paid/Net) Customer Lifetime Value Customer Loyalty/Retention: Net Promoter Score (NPS) GLOBAL VALUE CHAIN DASHBOARD: Example (Startup) GURUS Copyright 2010. Dr. Rod King. rodkuhnking@sbcglobal.net & http://businessmodels.ning.com & http://twitter.com/RodKuhnKing
- 3. ITENNE: ENVIRONMENT/INVESTOR ATTRACTIVENESS NEW ENTRANTS – Entry Barriers/Moves Segments; scale; Brand identity; Capital; Switching cost; Distr.; Gov Policy COMPETITORS – Exit Barriers/Moves Segments; Growth; Fixed costs, etc. P: PROCESSES ATTRACTIVENESS • Strategic/Branding/HR Management • Operational/Technology Management • Procurement/Marketing-Sales/Finance • Design/Inbound & Outbound Logistics • Core Competencies/Co-creation S: SUPPLIERS/MATERIALS ATTRACTIVENESS Segments: Trade-offs; Switching cost Volume; Differentiation of inputs Presence of substitute inputs Threat of forward/backward linkages Cost relative to purchase in industry R: RETAILERS/DISTRIBUTORS/ CHANNELS ATTRACTIVENESS O: OUTPUTS (PRODUCT/ SERVICE) ATTRACTIVENESS Segments: Trade-offs; Switching costs Function; Relative price perf. of substitute product/service; Margins Propensity for substitute product/ service; Experience factors; Scalability E: EMPLOYEES/KNOWLEDGE ASSETS/CULTURE ATTRACTIVENESS GLOBAL VALUE CHAIN ATTRACTIVENESS: OUTCOMES/GOALS Customer Value Proposition (Job) Business Value = Revenue/Cost Customer Value (Experience) = Customer Delight/Customer Pain M: MACHINERY/EQUIPMENT/ FACILITY ATTRACTIVENESS C: CUSTOMERS/CONSUMERS & RELATIONSHIPS ATTRACTIVENESS Segments: Trade-offs; Switching costs Volume; Input; Incentives; Linkages Substitute products; Prod. differences Information; Quality/Perf./Access Price sensitivity; Price/Total Purchase GURUS Copyright 2010. Dr. Rod King. rodkuhnking@sbcglobal.net & http://businessmodels.ning.com & http://twitter.com/RodKuhnKing GLOBAL VALUE CHAIN ATTRACTIVENESS Competitive Advantage Factors at Level of Enterprise, Sector, and Industry
- 4. HYPOTHESES PROBLEMS/ PAIN (WEAKNESS- ES/THREATS) GOALS/Objectives/ Strategies/Tactics/ Initiatives/ Projects Key Metrics/ Performance Indicators/ Targets Business Experiences (Impacts) Description of BUSINESS/ GLOBAL VALUE CHAIN Delight (Revenue) Pain (Cost) S: Suppliers E: Employees/ Knowledge Assets M: Machinery/ Infrastructure P: Processes O: Outputs (Product/Service) R: Retailers/ Distributors/ Channels C: Consumers/ Customers E: Environment VALUE CHAIN (“SEMPORCE”) BUSINESS ECOSYSTEM Customer Value Proposition (Job To Be Done): BUSINESS VALUE (PROFIT MARGIN) GURUS Mission/Vision: …………………….…………………………………………………. Market Segment (Customer Problem/Goal): ……………………….….… BUSINESS MODEL PLAN: Template Collaboratively Design Oh My God-Vision, Strategies, Products, Services, and Business Models Copyright 2010. Dr. Rod King. rodkuhnking@sbcglobal.net & http://businessmodels.ning.com & http://twitter.com/RodKuhnKing
Editor's Notes
- BIBLIOGRAPHY Blank, S.G. (2007) The Four Steps to the Epiphany. USA. http://steveblank.com/2010/02/22/no-accounting-for-startups/
- BIBLIOGRAPHY Barnes, D. (Ed.) (2001) Understanding Business. London: Routledge. Brache, A.P. (2002) How Organizations Work. New York: John Wiley & Sons Hamel, G.; Prahalad, C.K. (1996). Competing for the Future. Boston: Harvard Business School (HBS) Press. Merrifeld, R. (2009) Re-think. New Jersey: Pearson Education, Inc. Poirier, C.C. (20030 Using Models to Improve the Supply Chain. Florida: St. Lucie Press Porter, M.E. (1998) Competitive Advantage. New York: The Free Press. Porter, M.E. (1998) Competitive Strategy. New York: The Free Press. Porter, M.E. (2008) On Competition. Boston: Harvard Business School (HBS) Press. Rummler, G.; Brache, A. (1995) Improving Performance. San Francisco: Jossey-Bass.
- BIBLIOGRAPHY Christensen, C. (2003) The Innovator’s Dilemma. Boston: Harvard Business School (HBS) Press. Christensen, C. (2003) The Innovator’s Solution. Boston: Harvard Business School (HBS) Press. Iansiti, M.; Levien, R. (2004) The Keystone Advantage. Boston: Harvard Business School (HBS) Press. Kaplan, R.S.; Norton, D.P. (1998) The Balanced Scorecard. Boston: Harvard Business School (HBS) Press. Kaplan, R.S.; Norton, D.P. (2004) Strategy Maps. Boston: Harvard Business School (HBS) Press. Kaplan, R.S.; Norton, D.P. (2008) The Execution Premium. Boston: Harvard Business School (HBS) Press. Porter, M.E. (1998) Competitive Advantage. New York: The Free Press. Porter, M.E. (1998) Competitive Strategy. New York: The Free Press. Porter, M.E. (2008) On Competition. Boston: Harvard Business School (HBS) Press. Wikipedia. Pleasure Principle. http://en.wikipedia.org/wiki/Pleasure_principle_(psychology) Wikipedia. TRIZ. http://en.wikipedia.org/wiki/TRIZ