1. Quick introduction to Sage UCTT
Renshou Dai
Sage Instruments
February 17, 2016
1 Introduction
Sage 8901 UCTT (Universal Cellular Test Tool) is a portable broadband vector signal analyzer opti-
mized for complex wireless communication signals. Its fast real-time response makes it ideal for base
station equipment trouble shooting, interference signal hunting, detailed analysis of 2G, 3G and 4G
signals, signal coverage test, vector signal generator and cable antenna testings. This document gives
a quick introduction to UCTT with images captured from an actual UCTT unit.
2 List of UCTT Features
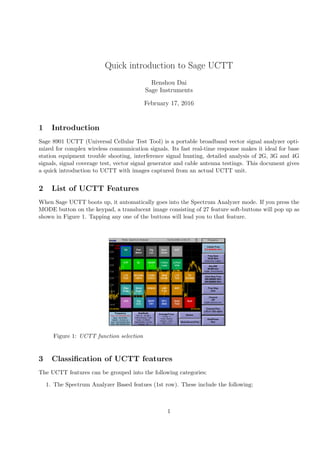
When Sage UCTT boots up, it automatically goes into the Spectrum Analyzer mode. If you press the
MODE button on the keypad, a translucent image consisting of 27 feature soft-buttons will pop up as
shown in Figure 1. Tapping any one of the buttons will lead you to that feature.
Figure 1: UCTT function selection
3 Classification of UCTT features
The UCTT features can be grouped into the following categories:
1. The Spectrum Analyzer Based featues (1st row). These include the following:
1
2. • SA: Spectrum Analyzer. A real-time broadband FFT-based spectrum analyzer with native
analysis bandwidth up to 25 MHz. A user can seamlessly change the span from 10KHz up
to 2 GHz. A fast adapative auto-ranging algorithm will automatically switch in and out
the front-end attenuators to prevent nonlinear distortion yet also preserve the best dynamic
range. UCTT has the best dynamic range when handling dense-spectrum signal in an urban
environment or when close to a cell site.
• Pwr meter: broad band power meter. With this easy-to-use broad band power meter, a
user no longer needs a separate external and expensive power meter. By setting the span to
the bandwidth you want, this also filters out the out-of-band signal. With the conventional
power meter, you have to add additional band-pass filter in front of it.
• Sig Loc: Signal location. A user can import map of an area into UCTT. With directional
antenna, and turning on the built-in speaker, an audio indicator (in addition to digital
display) will quickly show the signal strength when you point the antenna to different
directions. By simple triangulation, the potential signal source location can be determined.
• Sig Cov: Signal coverage (last row). Similar to Signal Location test.
• Spectrogram: this shows the real-time spectral trace at the bottom and the past traces at
the top.
• ACP: Adjacent Channel Power. ACP is a 3GPP required test to make sure a base station
transmitter does not create unwanted emission into adjacent channels.
2. The Cable and Antenna Based Tests (2nd row). These tests require using the RF-out port on
the instrument. UCTT will send unique set of probing signals and then measure the minute
returned signals as a result of impedance mismatch at the cable connector points and the cable
to antenna joint. These tests include:
• DTF: Distance to Fault. This is essentially a reflectometer, showing the reflected signal
strength against time or distance. Used to locate where the cable fault (a broken connector
or cable leakage etc) is.
• RL: Return Loss. This essentially shows in frequency-domain the returned signal energy. A
good cable to antenna matching should have a return loss under -30 dB for example.
• VSWR: Voltage Standing Wave Ratio. Same as Return Loss, but in a conventional ratio in
the range of 1 to ∞.
• 1-port loss: Single-port cable loss measurement.
• 2-port VNA: Two-port Vector Network Analyzer. Used to characterize the frequency re-
sponse a passive device (such as filter or cable) or active device (such as amplifier). The
amplitude response is indicated as signal loss (dB) versus frequeny, and the phase response
is shown as group delay versus frequency.
3. Technology specific vector signal analysis of various communication signals (3rd and 4th rows).
These include:
• LTE FDD: 4G Frequency-domain LTE signal analysis.
• WCDMA/HSPA: 3G Wide-band CDMA signal analysis.
• CDMA/EVDO: 2G and 2.5G CDMA/EVDO signal analysis.
• GSM/EDGE: 2G and 2.5G GSM and EDGE signal analysis.
• LTE TDD: 4G Time-domain LTE signal analysis.
• TDSCDMA: Time-domain synchronous CDMA signal analysis.
2
3. • WiMax analyzer.
• LMR P.25: Land-mobile (used by public safety crews such as police and fire-fighters) signal
analysis.
• WiFi: Wireless LAN signal analyzer.
4. Special Features unique to UCTT. These include:
• Channel Scanner: during drive test, this feature allows you to monitor signal strength and
quality of 10 different channels and different technologies. The data is recorded with time-
stamp and GPS location information.
• Blind Scan: with this feature, a user can blindly scan through a frequency band of interest
and UCTT can produce a list of active communication signals found within this band.
• VSG: Vector Signal Generator. UCTT can not only analyze received signal, it can also be
used as a versatile vector signal generator from simple single-frequency tone to complex 2G,
3G and 4G signals.
• AUTO TEST: this was developed to facilitate the cable-antenna test procedure when turning
up a new base station.
• BERT test: this is used to test digital backhaul cables if T1/E1 transmission is used.
• RFC 2544 test: this is used to test the digital backhaul if ethernet is used.
5. System button: this allows a user to see some system information, GPS information, Software
versions and software upgrade etc.
4 Unique sub-features of UCTT Spectrum Analyzer
4.1 Unique list of trace mode
UCTT’s Spectrum analyzer offers a flexible list of trace modes as shown in Figure 2.
Figure 2: Spectrum Analyzer’s trace mode selection
3
4. 4.2 Spectral Density View
The last trace mode, SP Density View (Spectral Density Display), shows the trace amplitude distri-
bution characteristics for the past 5 seconds. This trace mode can be particularly useful in finding
persistent (such as CDMA signal) but weaker signal hidden underneath the stronger but time-domain-
wise dynamic signal (such as TDD-LTE signal). Figure 3 shows such an example.
Figure 3: Spectral Density Display showing a weaker CDMA signal underneath a TD-LTE
signal.
4.3 Trigger mask and real-time recording and post-PC-playback
A user normally can leave the spectrum analyzer running freely as fast as the display can handle. But
if a user is only interested in signals above certain thresholds, then a user can set up the trigger mask
and use the mask to pace the display. A new trace is only displayed if the level is above the mask
threshold as shown in Figure 4.
Figure 4: Spectrum Analyzer with trigger mask setup and activated.
4
5. Since the internal DSP processor can generate far more traces than the display can handle, a
user can also enable a real-time recording for up to 2 minutes. Afterwards, the recorded data can be
exported to a USB thumb-drive, and such data can then be shared and played back on our PC SW
tool as explained later.
5 Unique subfeatures of UCTT 4G LTE signal analysis
5.1 LTE subfeature selection
Within the 4G LTE analyzer, a user can select different sub-features to further disect an LTE signal,
either it being FDD or TDD, as shown in Figure 5.
Figure 5: LTE signal analyzer sub-feature selection list.
5.2 MIB data decoding
One unique function of Sage UCTT’s LTE analyzer is that we actually decode the MIB data (Master
Information Block) embedded inside the PBCH channel. From the MIB data, not only can we obtain
the actual signal bandwidth information, we can also obtain the SFN (System-Frame-Number) which
is an important parameter during the LTE-CA (Carrier Aggregation) measurement. The aggregated
LTE channels all should have the same SFN and small TAE (Time-Alignment-Error) as shown in
Figure 6. The MIB/PBCH signal decoding and bit-error detection is also the most rigorous way to
determine the LTE signal quality at a given area [1].
5
6. Figure 6: LTE Multi-Carrier-Aggregation Test.
5.3 MIMO Scanner
UCTT’s LTE analyzer can also extract the unique set of RS (Reference Signals) associated with each
individual TX antenna from the tower and analyze their individual and relative characteristics as
shown in Fiure 7.
Figure 7: LTE MIMO scanner
5.4 TDD-LTE uplink, downlink and special subframe detection
For TDD-LTE signal, UCTT’s LTE analyzer will automatically detect 1 of the 7 possible uplink-
downlink configurations [2]. With such information, when in Power-vs-time mode, UCTT will display
the different symbols with different colors as shown in Figure 8 (downlink is colored yellow, uplink is
colored blue and special subframe period is colorer purple). This can be very useful in visualing the
inteference signal during the uplink stage.
6
7. Figure 8: TDD-LTE symbol vs time view. Downlink is colored yellow. Uplink is colored
blue and special subframe is colored purple.
6 3G WCDMA signal analysis subfeatures
The list of subfeatures embedded inside the WCDMA analyzer is shown in Figure 9.
Figure 9: WCDMA subfeature list.
7 CDMA signal analysis subfeatures
The list of subfeatures embedded inside the CDMA analyzer is shown in Figure 10.
7
8. Figure 10: CDMA subfeature list.
8 GSM signal analysis subfeatures
The list of subfeatures embedded inside the GSM analyzer is shown in Figure 11.
Figure 11: GSM subfeature list.
9 Vector Signal Generator
The list of signals that can be generated using UCTT is shown in the list in Figure 12.
8
9. Figure 12: VSG signal list.
10 Blind Scan
This blind scan feature gives user the ability to quickly find out how many active communication signals
are present at a location within a speficied band of interest. Figure 13 shows the simple user-interface
and Figure 14 shows an examplary list of active signals found by UCTT’s blind scan.
Figure 13: Blind Scan User Interface
9
10. Figure 14: Blind Scan Results.
11 Remotely controlling UCTT
Sage UCTT can be remotely operated through the IP network using a small foot-print PC application
software. If both UCTT and the PC are located within the same LAN, the PC can connect to UCTT
via direct IP address. If the UCTT is located at another location behind a firewall, then the PC and
UCTT can connect to each other via the Amazon AWS cloud server that Sage has rented.
11.1 Spectrum Analyzer Streaming Mode
If a user just wants to see the spectrum display on a remote UCTT from his PC, he/she can connect
to UCTT via spectrum streaming mode. This can give you more than 40 frames per second update
rate as shown in Figure 15.
Figure 15: UCTT spectrum remotely streamed to a PC.
10
11. 12 Complete remote control of UCTT
If a user wants to operate every feature (beyond spectrum analyzer) on a UCTT remotely, then he/she
can connect to a UCTT in bit-map mode and the following GUI/image will show up in the remote
UCTT PC SW as shown in Figure 16
Figure 16: Complete control of a UCTT remotely from a PC.
References
[1] Renshou Dai, Sage Technical Paper, ”Unambiguous 4G LTE coverage test via PBCH decoding.”
[2] 3GPP TS 36.211, ”Physical Channels and Modulation.”
11