2. Conclusions
Our findings suggest that policies to promote brand–brand competition in the US pharma-
ceutical market, such as accelerating approval of non-first-in-class drugs, will likely not
result in lower drug list prices absent additional structural reforms.
Author summary
Why was this study done?
• US prescription drug spending has increased sharply over the last decade, with higher
launch prices of new brand-name drugs and routine price increases on older brand-
name drugs.
• Promoting greater “brand–brand” competition, which occurs between brand-name
drugs indicated for the same condition, has been proposed to address high drug prices.
• Many examples exist of price increases following the introduction of brand-name com-
petition, casting doubt on the effectiveness of brand–brand competition in the pharma-
ceutical market.
What did the researchers do and find?
• We systematically reviewed published research on brand–brand competition and found
10 studies evaluating a wide range of drug classes.
• None of the 10 studies found that brand–brand competition lowers the published
(“list”) price of existing brand-name drugs within a class.
• We found that brand–brand competition may help restrain launch list prices and that
the effect of brand–brand competition may be mediated by the relative drug quality and
marketing, with safer or more effective new drugs and greater marketing associated
with higher intraclass list prices.
What do these findings mean?
• Barriers to brand–brand competition having a greater impact on list prices include the
following: physicians not prescribing the most cost-effective treatments due to lack of
knowledge, constraints on payers’ abilities to set one manufacturer against another in
drug price negotiations, and the misdirected incentive for pharmacy benefits managers
(PBMs) to accept high list prices of brand-name drugs.
• Greater brand–brand competition alone will likely not lower list prices of brand-name
drugs.
Competition and price among brand-name drugs in the same class
PLOS Medicine | https://doi.org/10.1371/journal.pmed.1002872 July 30, 2019 2 / 14
data; the approval of the final manuscript; or the
decision to submit the manuscript for publication.
Competing interests: I have read the journal’s
policy and the authors of this manuscript have the
following competing interests: ASK is a member of
the Editorial Board of PLOS Medicine.
Abbreviations: CML, chronic myeloid leukemia;
CMS, Centers for Medicare and Medicaid Services;
DHHS, Department of Health and Human Services;
FDA, Food and Drug Administration; H2, histamine-
2; MeSH, medical subject heading; PBM, pharmacy
benefits manager; PCSK9, proprotein convertase
subtilsin-kexin type 9; PRISMA, Preferred
Reporting Items for Systematic Reviews and Meta-
Analysis; TNF, tumor necrosis factor.
3. Introduction
Prescription drug spending has risen sharply in the US over the last decade [1]. A 2018 report
by the Department of Health and Human Services (DHHS) Office of Inspector General found
that net spending on brand-name drugs in Medicare Part D—the prescription drug benefit
program for seniors—increased 62% from 2011 to 2015, despite a 17% decrease in the number
of prescriptions of these products over the same period [2]. One driver of this growth has been
the introduction of novel products with high launch prices. In 2017, the median annual list
price of a new cancer medication was $160,000, compared to $101,000 in 2013 [3]. Another
major contributor has been routine price increases for existing products, which accounted for
about 60% of the increase in US revenues for the 45 top-selling drugs between 2014 and 2017
[4]. Without intervention, the Centers for Medicare and Medicaid Services (CMS) Office of
the Actuary projected that net US spending on prescription drugs will increase faster than any
other major healthcare good or service over the next decade [5].
“Brand–brand” competition, which occurs between brand-name products that are indi-
cated for the same condition and may have the same mechanism of action, has been offered as
a possible policy solution to alter this trajectory [6]. After the US Food and Drug Administra-
tion (FDA) approves a drug with a novel mechanism of action to treat a particular disease (a
first-in-class drug), other drugs developed by different manufacturers may emerge. In some
cases, the later-arriving manufacturer was developing its drug concurrently with the first-to-
market manufacturer, as with Amgen and the cholesterol-lowering proprotein convertase sub-
tilsin-kexin type 9 (PCSK9) inhibitor evolocumab (Repatha), which was approved 1 month
after another PCSK9 inhibitor alirocumab (Praluent) manufactured by Sanofi and Regeneron
in 2015 [7]. In other cases, the later-arriving manufacturer observes a market opportunity and
purposefully synthesizes a “me-too” version of the original product. In 2009, for example, the
FDA approved the ninth 3-hydroxy-3-methyl-glutaryl coenzyme-A reductase inhibitor
(“statin”) to lower cholesterol [8]. In March 2018, the FDA Commissioner proposed accelerat-
ing the agency’s approval process for non-first-in-class drugs on the assumption that greater
brand–brand competition would lower drug prices [9].
Although some examples of price lowering have been observed in the US market—most
notably among the new direct-acting antiviral drugs treating hepatitis C virus infection [10]—
prices of existing brand-name drugs have also risen following the introduction of brand-name
competition [11,12]. For example, FDA approval and subsequent widespread availability of
dasatinib (Sprycel) and nilotinib (Tasigna) for the treatment of chronic myeloid leukemia
(CML) had no effect on the list price of imatinib (Gleevec), an older CML treatment; instead,
list prices for all 3 drugs increased steadily between 2007 and 2014 [13]. This outcome stands
in contrast to “generic competition” between different manufacturers of the same drug, which
occurs when a brand-name drug loses market exclusivity, and reduces the price of a drug on
average 60% when 3 generic manufacturers enter the market [14].
To better understand the economic impact of brand–brand competition, we reviewed the
peer-reviewed literature for studies of how new drug market entry affects prices of drugs
within the same class that treat the same indications.
Methods
Study design and data sources
We conducted a systematic literature review using PubMed, a National Center for Biotechnol-
ogy Information database of biomedical and life sciences articles, and EconLit, an academic
Competition and price among brand-name drugs in the same class
PLOS Medicine | https://doi.org/10.1371/journal.pmed.1002872 July 30, 2019 3 / 14
4. database of economic articles produced by the American Economic Association. This study
was reported according to the Preferred Reporting Items for Systematic Reviews and Meta-
Analysis (PRISMA; S1 Table), and its full protocol is available in S1 Text.
Article selection
In February 2018, we searched PubMed using the medical subject headings (MeSHs) “‘Drug
Costs’ AND (‘Economics, Pharmaceutical’ OR ‘Economic Competition’) AND ‘United States,’”
and EconLit using the terms “‘Drug’ AND ‘Price’ AND (‘Competition’ OR ‘Determinants’ OR
‘Factors’) AND (‘United States’ OR ‘US’)”. Different search terms were used for each database
because MeSH term indexing was not available in EconLit. In both databases, we restricted our
search to original investigations published in English after 1990. Identified abstracts were
reviewed independently by 2 team members (JD and MZ) and used to exclude articles. Exclu-
sion criteria included articles that did not focus on prescription drug pricing or the US market
(given its unique pharmaceutical pricing dynamics), articles that focused on the effects of
generic competition, cost-effectiveness studies, news stories, and opinion pieces. Inconsistent
scoring was resolved by a third reviewer (AS), who examined the full text of the article. We sepa-
rately identified 1 qualifying study not captured by our search terms due its atypical indexing in
PubMed (despite being an original investigation of the cost of disease-modifying drugs for mul-
tiple sclerosis, it was not indexed under the MeSH “Drug Costs”) and included it in our analysis.
Given the time that had passed between the initial search and publication, we conducted a fol-
low-up search for articles published between February 2018 and April 2019. We used the same
search terms for EconLit but used the non-MeSH terms "(‘Drug Costs’ OR ‘Drug Prices’ OR
‘Cost Changes’ OR ‘Price Changes’) AND (‘Competition’ OR ‘Competitors’)” for PubMed to
account for potential lag between publication and MeSH term indexing.
Data synthesis and analysis
For each original investigation, we performed a qualitative synthesis of the data. We recorded
the primary objective and time period of the study. We summarized the methodology
employed, including the drugs assessed, the data sources used, and the measurement of price
(e.g., average sales price) used in the study. We also recorded the results and our interpretation
of the findings, focusing on how market entry impacted prices of existing products in the class,
how existing products in the class affected launch prices, and what variables, if any, may have
modified the effect of brand–brand competition on drug prices. This work was performed by
1 team member (JD or MZ) and was reviewed by 2 others (AS and MN). Given the number
and scope of the investigations identified, a quantitative synthesis of the evidence would not
have been appropriate or informative.
Results
Taxonomy of identified investigations
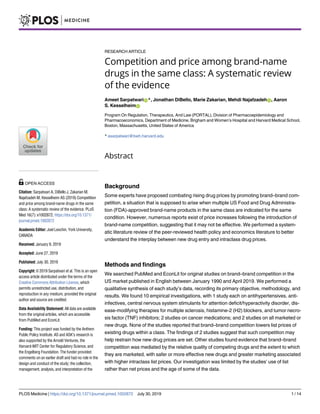
Our search yielded 483 articles, 473 of which were excluded as being not about drug pricing (n
= 242), not focused on the US market (n = 52), focused on generic competition (n = 87), news
reports (n = 26), cost-effectiveness studies (n = 21), policy analyses of solutions to high drug
prices (17), nonoriginal investigations (n = 27), and not about class-specific prices (n = 1) (Fig
1). These exclusions left 10 original investigations in the final sample.
The publication dates of these studies ranged from 1994 to 2019, while the assessment peri-
ods spanned 1977 to 2016 (Table 1). Two studies evaluated all marketed or new drugs [15–16].
The other 8 were drug specific, covering histamine-2 (H2) blockers [17], antihypertensives
Competition and price among brand-name drugs in the same class
PLOS Medicine | https://doi.org/10.1371/journal.pmed.1002872 July 30, 2019 4 / 14
5. 18], anti-infectives [19], central nervous system stimulants for attention deficit/hyperactivity
disorder [20], disease-modifying therapies for multiple sclerosis [21], tumor necrosis factor
(TNF) inhibitors [22], and cancer medications [23,24]. Six studies published descriptive data
on drug prices over time [17,20–24].
A variety of drug price measures were employed. Three studies used average retail price per
unit [16,19,20], 1 study used average retail price per unit to calculate price per patient-day
[17], and 1 study used average retail price per unit to calculate price per patient-month [24].
Three studies calculated treatment price using average wholesale price per unit [15,18,21]. One
Fig 1. PRISMA flow-chart. N/A, not applicable; PRISMA, Preferred Reporting Items for Systematic Reviews and Meta-Analysis.
https://doi.org/10.1371/journal.pmed.1002872.g001
Competition and price among brand-name drugs in the same class
PLOS Medicine | https://doi.org/10.1371/journal.pmed.1002872 July 30, 2019 5 / 14
6. Table 1. Studies included in the systematic review.
Author
(Year)
Objective Data Sources Price Used Principle Findings
Berndt and
colleagues
(1994)
To explain the growth and
composition of the H2 antagonist
market between 1977 and 1993
IMS sales data Price per patient-day based on
average retail price per unit
Prices of the first (cimetidine) and
second (ranitidine) drugs to market
increased 44% and 13% over the
study period
IMS Personal Selling Audit The launch price of ranitidine was
56% higher than the price of
cimeditine, possibly owing to a more
favorable side-effect profile
Marketing was market expanding,
but the effect diminished with more
products
Lu and
Comanor
(1998)
To assess how prices of 144 brand-
name drugs approved between 1978
and 1987 were set relative to existing
substitutes, and how these prices
changed over time
Red Book Treatment price based on average
wholesale price per unit (calculated
differently for systemic drugs used in
acute nonemergency settings and for
chronic conditions, topical agents,
and drugs used in emergencies)
The number of brand-name
substitutes was associated with lower
launch prices
FDA new product grades
(A = important therapeutic
gain, B = modest therapeutic
gain, C = little or no
therapeutic gain)
Grade A and B new drugs were
priced on average 77% and 79%
higher than brand-name drugs
within the same class
Over an 8-year period on the
market, prices for grade A and B
new drugs decreased 14% and 12%;
prices for grade C drugs increased
30%
Rizzo (1999) To assess how marketing affected
competition among antihypertensive
drugs between 1988 and 1993
PriceProbe, a price analysis
software package from First
DataBank
Treatment price based on average
wholesale price per unit treatment
costs (calculated assuming 100 days
of therapy on most common
formulation)
Marketing lowered price sensitivity
Physicians’ Desk Reference Marketing was market expanding
and did not have a large effect on
brand substitution
Wiggins and
Maness (2004)
To evaluate the “price-N” relationship
for anti-infective drugs between 1984
and 1990
IMS sales data Average retail price per unit An increase in the number of
“related” drugs within the class was
associated with a modest,
nonsignificant decrease in drug
price
Bokhari and
Fournier
(2013)
To assess the welfare impact of the
new drug entry in the attention
deficit/hyperactivity disorder market
from 1999 to 2003
NDCHealth Source Territory
Manager data
Average retail price per unit Prices of most (6 of 7) marketed
brand-name drugs at study initiation
did not fall following the
introduction of me-too drugs, but
several generic drugs were already
available
De Frutos and
colleagues
(2013)
To evaluate how drug quality
differences shaped manufacturer
marketing strategies between 1994
and 2003
IMS sales data Average retail price per unit Better quality drugs were more
heavily marketed
IMS Personal Selling Audit
TNS Media Marketing was associated with
higher class-wide prices
FDA Orange Book
Hartung and
colleagues
(2015)
To examine the prices of disease-
modifying therapies for multiple
sclerosis between 1993 and 2002 and
the impact of new drug entry on these
prices
First DataBank Treatment price based on average
wholesale price per unit (calculated
for Medicaid assuming a 12%
discount)
Prices of first-generation drugs
increased from $8,000–$10,000 to
approximately $60,000 per year
Prices of new drugs were 25%–60%
higher than those of existing drugs
Howard and
colleagues
(2015)
To assess trends in the launch prices
of 58 cancer drugs approved between
1995 and 2013
CMS Average Sales Price files Episode treatment price based on
per-person cost to Medicare
There was a strong correlation (0.9)
between drug pricing and
incremental survival benefits
Drugs@FDA website After controlling for survival
benefits and inflation, average
launch price of cancer drugs
increased about 10% per year
(Continued)
Competition and price among brand-name drugs in the same class
PLOS Medicine | https://doi.org/10.1371/journal.pmed.1002872 July 30, 2019 6 / 14
7. study calculated annual cost using wholesale acquisition cost per unit (and also calculated
annual gross and out-of-pocket costs in Medicare Part D) [22], and 1 study calculated treatment
price using per-patient cost to the Medicare program [21]. Only the investigation by San-Juan-
Rodriguez and colleagues [22] tried to account for drug-specific rebates from pharmaceutical
manufacturers that are customarily received by payers or pharmacy benefits managers (PBMs),
the entities payers contract to administer the pharmaceutical component of their plans.
Impact of new brand-name entry on intraclass drug prices
The studies in our review did not find a price-lowering effect of new drug entry on intraclass
brand-name products. Examining the H2 blocker market from 1977 to 1993—when no gener-
ics were present—Berndt and colleagues found that the average price per patient-day of the
first-in-class drug cimetidine (Tagamet) fell from about $1 to $0.80 before facing competition
[17]. Introduction of ranitidine (Zantac) at $1.25 per patient-day in 1983, however, did not
depress the price of cimetidine further. Instead, prices of both drugs increased over time, with
a faster rate of increase observed for cimetidine. This upward trajectory persisted with market
entry of famotidine (Pepcid) in 1986 and nizatidine (Axid) in 1988. By the end of the study
period, the average price per patient-day of cimetidine had increased 44% to $1.44, while the
average price per patient-day of ranitidine had increased 13% to $1.41.
Studying the anti-infective market from 1984 to 1990, Wiggins and Maness failed to detect
an association between a drug’s price and the number of existing “related” products [19]. The
nonsignificant effect was far smaller than that observed for “brand-generic” competition,
which occurs when interchangeable generic versions of brand-name drugs made by different
manufacturers emerge after market exclusivity expires. However, the investigators did not
focus on the impact of new drug entry, and their category of related products may have
included generic and brand-name versions of intraclass competitors.
Bokhari and Fournier assessed the market for attention deficit/hyperactivity disorder stim-
ulants between 1993 and 2003 [20]. Despite the introduction of 8 new brand-name drugs over
Table 1. (Continued)
Author
(Year)
Objective Data Sources Price Used Principle Findings
Gordon and
colleagues
(2018)
To measure the price trajectories of
24 injectable cancer drugs approved
between 1996 and 2012 and examine
the influence of market structure on
price changes
CMS Average Sales Price files Mean monthly cost using average
retail price per unit
The mean annual increase in the
monthly cost of the drugs was
3.73%, while the mean annual
health-inflation rate was 1.15%
CenterWatch In 3 regression models, new brand-
name competitors were not
significantly associated with price
changes of existing products
San-Juan-
Rodriguez and
colleagues
(2019)
To assess how prices of existing TNF
inhibitors changed in response to
market entry of new TNF inhibitors
First DataBank Annual cost based on wholesale
acquisition cost per unit (adjusted
for class-specific rebates reported for
Medicare Part D)
The mean annual cost of 3 TNF
inhibitors increased 144% between
April 2009 and December 2016, over
which time 3 new TNF inhibitors
entered the market; a 33% increase
was expected in the absence of these
new products
Medicare Gross and out-of-pocket annual
costs (adjusted for class-specific
rebates in Medicare Part D)
Medicare Part D spending on TNF
inhibitors mirrored annual costs,
whereas out-of-pocket costs under
the program were more stable
Abbreviations: CMS, Centers for Medicare and Medicaid Services; FDA, Food and Drug Administration; H2, histamine-2; TNF, tumor necrosis factor
https://doi.org/10.1371/journal.pmed.1002872.t001
Competition and price among brand-name drugs in the same class
PLOS Medicine | https://doi.org/10.1371/journal.pmed.1002872 July 30, 2019 7 / 14
8. this period, the average retail price of only 1 of the 7 brand-name drugs available at the start of
the study period decreased. Complicating the interpretation of the analysis, however, the
market also featured generic versions of 2 drugs within the class (immediate- and extended-
release methylphenidate and pemoline) at study initiation.
Covering the period 1993 to 2013, Hartung and colleagues evaluated drugs for multiple
sclerosis [21]. The annual treatment price of the first-generation agents interferon-β-1b (Beta-
seron), interferon-β-1a (Avonex), and glatiramer (Copaxone) increased from $8,292–$11,532
(initial range) to $59,158–$61,529 (ending range) over this time notwithstanding the market
entry of interferon-β-1a (Rebif) in 2002, natalizumab (Tysabri) in 2004, interferon-β-1b (Exta-
via) in 2009, fingolimod (Gilenya) in 2010, teriflunomide (Aubagio) in 2012, and dimethyl
fumarate (Tecfidera) in 2013. Following the introduction of interferon-β-1a (Rebif) and the
reintroduction of natalizumab in 2006 (after its withdrawal for safety concerns).
Gordon and colleagues assessed 24 injectable cancer drugs approved between 1996 and
2012 [24]. The mean annual increase in the monthly cost of these drugs was 3.7%, more than
double the mean annual health-inflation rate (1.2%). Only 1 drug, ziv-aflibercept (Zaltrap),
experienced a price decline. In multivariate modeling, the introduction of new brand-name
competitors was not associated with price changes of existing drugs on the market.
Finally, San-Juan-Rodriguez and colleagues evaluated the price changes of TNF inhibitors
between 2006 and 2016 [22]. The investigators found that the mean annual cost of the 3 TNF
inhibitors approved prior to 2009—adalimumab (Humira), etanercept (Enbrel), and inflixi-
mab (Remicade)—increased 144% between April 2009 and December 2016 despite the market
entry of 3 new TNF inhibitors: golimumab (Aria), certolizumab pegol (Cimzia), and intrave-
nous golimumab (Simponi Aria). An interrupted time-series analysis revealed that this
increase was over 4-fold greater than what would have been expected if the new products were
not introduced and secular trends had continued. Although the gross cost of the treatments
under Medicare Part D experienced a similar trajectory, the annual out-of-pocket costs by
patients in the program remained relatively stable.
Impact of intraclass brand-name drugs on new drug launch prices
While new drug entry was not observed to lower intraclass brand-name drug prices, 2 studies
uncovered evidence that intraclass brand-name drugs restrain launch prices of new drugs,
anchoring them to existing benchmarks. Lu and Comanor investigated the pricing trends of
all new drugs entering the US market between 1978 and 1987 [15]. Using multivariable model-
ing, they reported a 38% decrease in the ratio of a new drug’s launch price to the average class
price when the number of brand-name drugs in the class increased from 1 to 2, and a 19%
decrease when the number increased from 2 to 3.
Howard and colleagues studied cancer drugs entering the market from 1995 to 2013 [23].
After controlling for survival benefits and inflation, they reported a 10% annual increase in
per-treatment launch prices. Such a finding, the authors noted, was consistent with reference
price models of demand, in which “consumers’ purchase decisions [. . .] depend on a pricing
anchor, or reference price, rather than some internal comparison or price and willingness-to-
pay” [23].
Relative quality and marketing as effect modifiers of brand–brand
competition
Three investigations found evidence that relative effectiveness and safety (“relative quality”)
modified the effect of brand–brand competition on new drug launch prices. Using a then-
existing FDA grading scheme for prioritizing the review of new drugs (Grade A: important
Competition and price among brand-name drugs in the same class
PLOS Medicine | https://doi.org/10.1371/journal.pmed.1002872 July 30, 2019 8 / 14
9. therapeutic gain, Grade B: modest therapeutic gain, Grade C: little or no therapeutic gain), Lu
and Comanor found that launch prices of Grade A and B drugs were on average 77% and 79%
higher than existing brand-name drugs within the same class; by contrast, the average launch
price of Grade C drugs was 51% lower [15]. Over an 8-year period on the market, the average
prices of Grade A and B drugs decreased by 14% and 12%, whereas the average price of Grade
C drugs increased by 30%. The authors concluded that manufacturers of therapeutically inno-
vative products used a “skimming” strategy, initially pricing high to signal superior quality and
then lowering over time, whereas manufacturers of noninnovative products used a “penetra-
tion” strategy, initially pricing low to capture market share and then increasing over time.
Similar findings were reported in studies of H2 blockers and cancer drugs. Berndt and col-
leagues observed that ranitidine, a drug with a more favorable side-effect profile than cimeti-
dine, commanded a 56% price premium at launch [17]. However, unlike the average price of
Grade A drugs in Lu and Comanor’s investigation, the price of ranitidine did not fall over
time. Howard and colleagues subsequently estimated that each life-year gained from a new
cancer drug was associated with a $75,000 increase in its per-treatment price [22].
Three studies also found evidence that marketing mediated the impact of brand–brand
competition on intraclass drug prices. Berndt and colleagues [17] reported that H2 blocker
marketing was market expanding when rival products were available, enabling prices to rise
from increased demand. Evaluating 360 drugs between 1994 and 2003, de Frutos and col-
leagues [16] found that higher quality drugs—defined in part based on whether they received
“priority” or “standard” review—were more heavily marketed and that marketing was associ-
ated with higher prices for all drugs in the class, not just the marketed drug. Finally, Rizzo [18]
reported that marketing lowered price sensitivity among 4 different classes of antihypertensive
drugs: angiotensin-converting enzyme inhibitors, beta blockers, calcium-channel blockers,
and diuretics.
Discussion
In our systematic literature review, we found no studies that show that brand–brand competi-
tion lowers list prices of existing drugs within a class. However, we found evidence that brand–
brand competition may anchor the list prices of new drugs below what they would be in the
absence of such competition. We also found that the effect of brand–brand competition on
drug prices is likely modified by relative drug quality and the extent of marketing, with safer or
more effective new drugs commanding higher prices and greater marketing associated with
higher intraclass prices.
These findings underscore some distinctive features of the US pharmaceutical market. In a
truly competitive market, introduction of similar products should lower prices of previously
available products. One reason that the US does not follow this pattern is that physicians pri-
marily determine what drug is prescribed and rarely have direct incentives to select the most
cost-effective treatment. The Federal Trade Commission captured this conundrum in a 1979
report, noting that “the forces of competition do not work well in a market where the con-
sumer who pays does not choose and the physician who chooses does not pay” [25]. Physicians
are also often unaware of the absolute or relative prices of drugs [26].
Additionally, unlike consumers in more competitive markets, payers in the US pharmaceu-
tical market may face legal limits on their flexibility to negotiate prices. In particular, coverage
mandates are prevalent in the US and hinder payers from capitalizing on new brand-name
market entrants to achieve lower prices. For example, Medicaid—the federal- and state-funded
assistance program for low-income patients—must cover virtually all FDA-approved drugs in
exchange for receiving guaranteed rebates equivalent to the best price that brand-name
Competition and price among brand-name drugs in the same class
PLOS Medicine | https://doi.org/10.1371/journal.pmed.1002872 July 30, 2019 9 / 14
10. manufacturers get in the private market [27]. Similarly, Medicare Part D plans are required to
cover all drugs within 6 protected drug classes, including cancer drugs [28], a field in which
numerous follow-on brand-name drugs have been marketed in recent years. Further compli-
cating the cancer drug market, some states have laws requiring payers to cover off-label uses of
cancer drugs listed in national compendia [29].
The structure of the US pharmaceutical market may also work against the prospect of
brand–brand competition being able to lower list prices. For example, PBMs have emerged as
an intermediary to help negotiate drug prices on behalf of public and private payors. But in
contracts with insurers, some PBMs have arranged to retain a portion of the rebates they
receive from a drug manufacturer. This arrangement can encourage PBMs to accept high list
prices because the size of the rebate—and thus the PBM-retained portion of the rebate—would
be larger, assuming that PBMs could negotiate the same net price [30]. Promoting brand–
brand competition therefore is unlikely to lower list prices without other structural changes to
the US pharmaceutical market.
Additional possible explanations for our findings include the limited information available
on new drugs and oligopoly dynamics. First, in the absence of comparative safety and effective-
ness data, it is possible that higher prices are perceived by some actors as a sign of quality
[31,32]. In such situations, brand-name drugs may exhibit properties of Veblen goods, in
which higher prices are associated with increasing demand [33], incentivizing ever-higher
pricing. Second, when there are a limited number of firms operating in a market—as is often
the case for drugs indicated for the same condition—they sometimes engage in tacit collusion
to maintain or increase their prices [34], for example, by following the pricing strategy of the
leading firm.
The findings of our review raise concern about the economic consequences of pharmaceuti-
cal marketing. In 2016, the pharmaceutical industry spent $6.1 billion on direct-to-consumer
advertising and likely more than 5 times as much on physician marketing [35,36]. Such pro-
motion may help some patients become aware of new treatments, but a wealth of research has
shown that marketing also drives overuse of expensive brand-name drugs [37]. Because mar-
keting may also force patients to pay more for their medications, US policymakers may need
to reexamine the extent and manner to which it can take place and explore effective ways to
counter its impact [38].
Our review may also be relevant for the emerging US biosimilar market. Biosimilars are
versions of originator biologic drugs made by different manufacturers. They are analogous to
generic drugs, versions of originator small-molecule drugs made by different manufacturers,
but given the greater size and complexity of biologics relative to small molecules, biosimilars
are not considered interchangeable without meeting heightened testing standards, which the
FDA has only recently begun to define. Accordingly, pharmacists may not automatically sub-
stitute prescriptions for biosimilars at this time. Depending on the policies that Congress, the
states, and the FDA adopt, biosimilar competition may more closely resemble brand–brand
competition than brand–generic competition [39,40].
Three limitations of our review should be noted. First, the results are based on only 10 rig-
orous empirical studies that met our entry criteria. Within the cohort, the included studies
assessed only list prices, except for the investigation by San-Juan-Rodriguez and colleagues
[22]. Net prices may be more impacted by brand–brand competition, which may partially
explain a seemingly growing difference between net and list prices [41]. However, net prices
are considered proprietary trade secrets. List prices remain an important measure of afford-
ability because they influence co-insurance and deductible payments as well as charges for
uninsured patients [42].
Competition and price among brand-name drugs in the same class
PLOS Medicine | https://doi.org/10.1371/journal.pmed.1002872 July 30, 2019 10 / 14
11. Second, the assessment periods for about half of the studies in our review were over 2
decades old. Nevertheless, comparable findings were reported by more recent investigations.
For example, Hartung and colleagues [21], San-Juan-Rodriguez and colleagues [22], and Gor-
don and colleagues [24] each reported that new drug entry was not associated with price
reductions of existing intraclass brand-name products, which mirrored earlier findings by
Berndt and colleagues [17], Bokhari and Fournier [20], and Wiggins and Maness [19]. Simi-
larly, Howard and colleagues [23] observed an anchoring effect of existing intraclass brand-
name products on new drug launch prices, which had been previously reported by Lu and
Comanor [15]. Regarding drug marketing, we are aware of no evidence that its apparent role
in mediating brand–brand competition has changed. Between 1997 and 2016, manufacturer
spending on pharmaceutical marketing to physicians increased from $15.6 billion to $20.3 bil-
lion, while direct-to-consumer advertising expenditures grew from $1.3 billion to $6 billion
[43], suggesting that marketing may now play an even larger role in market expansion.
Finally, our investigation was limited to the US market. A similar review of prescription
drug pricing dynamics outside of the US may find different results, because many other high-
income countries use variations of reference pricing, in which the prices of new drugs
approved in an existing class are tied to the lowest price of the drug in the class unless they
have substantial clinical differences [44]. In the case of Canada, however, Lexchin reported
similar findings to those uncovered by our systematic review [45].
Conclusion
Our systematic review found no evidence that brand–brand competition lowers list prices in
the US market. While more research is needed to identify whether there are specific situations
in which such competition may be impactful, structural reforms are ultimately needed to
address the rising price of prescription drugs in the US.
Supporting information
S1 Table. PRISMA 2009 checklist. PRISMA, Preferred Reporting Items for Systematic
Reviews and Meta-Analysis.
(DOC)
S1 Text. Study protocol.
(DOCX)
Author Contributions
Conceptualization: Ameet Sarpatwari, Mehdi Najafzadeh, Aaron S. Kesselheim.
Data curation: Ameet Sarpatwari, Jonathan DiBello, Marie Zakarian.
Formal analysis: Ameet Sarpatwari, Jonathan DiBello, Marie Zakarian, Mehdi Najafzadeh.
Funding acquisition: Ameet Sarpatwari, Aaron S. Kesselheim.
Investigation: Ameet Sarpatwari, Jonathan DiBello, Mehdi Najafzadeh.
Methodology: Ameet Sarpatwari, Mehdi Najafzadeh.
Project administration: Ameet Sarpatwari, Aaron S. Kesselheim.
Resources: Ameet Sarpatwari.
Supervision: Ameet Sarpatwari, Mehdi Najafzadeh, Aaron S. Kesselheim.
Competition and price among brand-name drugs in the same class
PLOS Medicine | https://doi.org/10.1371/journal.pmed.1002872 July 30, 2019 11 / 14
12. Validation: Ameet Sarpatwari, Jonathan DiBello, Marie Zakarian.
Visualization: Ameet Sarpatwari.
Writing – original draft: Ameet Sarpatwari, Jonathan DiBello, Marie Zakarian, Aaron S.
Kesselheim.
Writing – review & editing: Ameet Sarpatwari, Mehdi Najafzadeh, Aaron S. Kesselheim.
References
1. Kesselheim AS, Avorn J, Sarpatwari A. The high cost of prescription drugs in the United States: origins
and prospects for reform. JAMA. 316(8):858–71 (2016). https://doi.org/10.1001/jama.2016.11237
PMID: 27552619
2. US Department of Health and Human Services Office of Inspector General. Increases in reimbursement
for brand-name drugs in Part D. Available from: https://oig.hhs.gov/oei/reports/oei-03-15-00080.pdf.
[cited 2019 June 9].
3. Global oncology trends. IQVIA. Available from: https://www.iqvia.com/institute/reports/global-oncology-
trends-2018. [cited 2019 June 9].
4. Pagliarulo N. Price increases on top drugs drove majority of recent growth, analysis finds. BioPharma
Dive. Available from: https://www.biopharmadive.com/news/price-increases-on-top-drugs-drove-
majority-of-recent-growth-analysis-find/539337/. [cited 2019 June 9].
5. Cuckler GA, Sisko AM, Poisal JA, Keehan SP, Smith SD, Madison AJ, et al. National health expenditure
projections, 2017–26: despite uncertainty, fundamentals primarily drive spending. Health Aff. 37
(3):482–92 (2018).
6. Sarpatwari A, Avorn J, Kesselheim AS. An incomplete prescription: President Trump’s plan to address
high drug prices? JAMA. 319(23):2373–4 (2018). https://doi.org/10.1001/jama.2018.7424 PMID:
29800027
7. Kolata G. FDA approved Repatha, a second drug for cholesterol in a potent new class. New York
Times. Available from: https://www.nytimes.com/2015/08/28/health/fda-approves-another-in-a-new-
class-of-cholesterol-drugs.html. [cited 2019 June 9].
8. Gagne JJ, Choudhry NK. How many "me-too" drugs is too many? JAMA. 305(7):711–2 (2011). https://
doi.org/10.1001/jama.2011.152 PMID: 21325189
9. Steenhuysen J, Beasley D. FDA wants to shorten new drug monopolies to cut costs. Reuters. Available
from: https://www.reuters.com/article/us-health-cancer-fda/fda-wants-to-shorten-new-drug-
monopolies-to-cut-costs-idUSKCN1IZ0V2. [cited 2019 June 9].
10. Beasley D. Price pressure his Gilead first quarter U.S. hepatitis C drug sales. Reuters. Available from:
https://www.reuters.com/article/us-gilead-results/price-pressure-hits-gilead-first-quarter-u-s-hepatitis-
c-drug-sales-idUSKCN0XP2YX. [cited 2019 June 9].
11. Tribble SJ. Several probes target insulin drug pricing. Kaiser Health News. Available from: https://www.
nbcnews.com/health/health-news/several-probes-target-insulin-drug-pricing-n815141. [cited 2019
June 9].
12. Rockoff JD. Drugmakers find competition doesn’t keep a lid on prices. Wall Street Journal. Available
from: https://www.wsj.com/articles/drugmakers-find-competition-doesnt-keep-a-lid-on-prices-
1480248003. [cited 2019 June 9].
13. Johnson CY. This drug is defying a rare form of leukemia–and it keeps getting pricier. Washington Post.
Available from: https://www.washingtonpost.com/business/this-drug-is-defying-a-rare-form-of-
leukemia—and-it-keeps-getting-pricier/2016/03/09/4fff8102-c571-11e5-a4aa-f25866ba0dc6_story.
html?utm_term=.ca932f2a9b39. [cited 2019 June 9].
14. Dave CV, Hartzema A, Kesselheim AS. Prices of generic drugs associated with numbers of manufac-
turers. N Engl J Med. 377(26):2597–8 (2017). https://doi.org/10.1056/NEJMc1711899 PMID:
29281576
15. Lu J, Comanor WS. Strategic pricing of new pharmaceuticals. Rev Econ Stat. 80(1):108–18 (1998).
16. de Frutos MA, Ornaghi C, Siotis G. Competition in the pharmaceutical industry: how do quality differ-
ences shape advertising strategies? J Health Econ. 32(1):268–85 (2013). https://doi.org/10.1016/j.
jhealeco.2012.07.006 PMID: 23237791
17. Berndt ER, Bui L, Reiley D, Urban G. The roles of marketing, product quality and price competition in
the growth and composition of the U.S. anti-ulcer drug industry. NBER Working Papers: 4904 (1994).
Competition and price among brand-name drugs in the same class
PLOS Medicine | https://doi.org/10.1371/journal.pmed.1002872 July 30, 2019 12 / 14
13. 18. Rizzo JA. Advertising and competition in the ethical pharmaceutical industry: the case of antihyperten-
sive drugs. J Law Econ. 42(1):89–116 (1999).
19. Wiggins SN, Maness R. Price competition in pharmaceuticals: the case of anti-infectives. Economic
Inquiry. 42(2):247–63 (2004).
20. Bokhari FAS, Fournier GM. Entry in the ADHD drugs market: welfare impact of generics and me-too’s.
J Indust Econ. 61(2):339–92 (2013).
21. Hartung DM, Boudette DN, Ahmed SM, Whitham RH. The cost of multiple sclerosis drugs in the US and
the pharmaceutical industry: too big to fail? Neurology. 84(21):2185–92 (2015). https://doi.org/10.1212/
WNL.0000000000001608 PMID: 25911108
22. San-Juan-Rodriguez A, Prokopovich MV, Shrank WH, Good CB, Hernandez I. Assessment of price
changes of existing tumor necrosis factor inhibitors after the market entry of competitors. JAMA Intern
Med (2019).
23. Howard DH, Bach PB, Berndt ER, Conti RM. Pricing in the market for anticancer drugs. J Econ Per-
spect. 29(1):139–62 (2015). PMID: 28441702
24. Gordon N, Stemmer SM, Greenberg D, Goldstein DA. Trajectories of injectable cancer drug costs after
launch in the United States. J Clin Oncol. 36(4):319–25 (2018). https://doi.org/10.1200/JCO.2016.72.
2124 PMID: 29016226
25. Bureau of Consumer Protection. Drug product selection: staff report to the Federal Trade Commission.
Available from: https://www.ftc.gov/system/files/documents/reports/staff-report-drug-product-selection/
790101drugproductrpt.pdf. [cited 2019 June 9].
26. Allan GM, Lexchin J, Wiebe N. Physician awareness of drug cost: a systematic review. PLoS Med 4(9):
e283 (2007). https://doi.org/10.1371/journal.pmed.0040283 PMID: 17896856
27. Payment for covered outpatient drugs, 42 United States Code § 1396r-8.
28. Centers for Medicare and Medicaid Services. Medicare prescription drug benefit manual: chapter 6 –
Part D drugs and formulary requirements. Available from: https://www.cms.gov/Medicare/Prescription-
Drug-Coverage/PrescriptionDrugCovContra/Downloads/Part-D-Benefits-Manual-Chapter-6.pdf. [cited
2019 June 9].
29. Ramsey SD. How state and federal policies as well as advances in genome science contribute to the
high cost of cancer drugs. Health Aff. 34(4):571–5 (2015).
30. Dayden D. The hidden monopolies that raise drug prices. American Prospect. Available from: http://
prospect.org/article/hidden-monopolies-raise-drug-prices. [cited 2019 June 9].
31. Waber RL, Shiv B, Carmon Z, Ariely D. Commercial features of placebo and therapeutic efficacy.
JAMA. 299(9):1016–7 (2008). https://doi.org/10.1001/jama.299.9.1016 PMID: 18319411
32. Espay AJ, Norris MM, Eliassen JC, Dwivedi A, Smith MS, Banks C, et al. Placebo effect of medication
cost in Parkinson disease: a randomized double-blind study. Neurology. 84(8):794–802 (2015). https://
doi.org/10.1212/WNL.0000000000001282 PMID: 25632091
33. Han YJ, Nunes JC, Drèze X. Signaling status with luxury goods: the role of brand prominence. J Market-
ing. 74(4):15–30 (2010).
34. Tirole J. The theory of industrial organization. Boston: MIT Press; 1988.
35. Entis L. DTC pharma ad spending slipped 4.6% in 2017: Kantar. MM&M. Available from: http://www.
mmm-online.com/commercial/dtc-pharma-ad-spending-slipped-46-in-2017-kantar/article/750421/.
[cited 2019 June 9].
36. The Pew Charitable Trusts. Persuading the prescribers: pharmaceutical industry marketing and its influ-
ence on physicians and patients. Available from: http://www.pewtrusts.org/en/research-and-analysis/
fact-sheets/2013/11/11/persuading-the-prescribers-pharmaceutical-industry-marketing-and-its-
influence-on-physicians-and-patients. [cited 2019 June 9].
37. Spurling GK, Mansfield PR, Montgomery BD, Lexchin J, Doust J, Othman N, et al. Information from
pharmaceutical companies and the quality, quantity, and cost of physicians’ prescribing: a systematic
review. PLoS Med. 7(10):e1000352 (2010). https://doi.org/10.1371/journal.pmed.1000352 PMID:
20976098
38. Avorn J. Academic detailing: "marketing" the best evidence to clinicians. JAMA. 317(4):361–2 (2017).
https://doi.org/10.1001/jama.2016.16036 PMID: 28118458
39. Sarpatwari A, Avorn J, Kesselheim AS. Progress and hurdles for follow-on biologics. New Engl J Med.
372(25):2380–2 (2015). https://doi.org/10.1056/NEJMp1504672 PMID: 25946143
40. Sarpatwari A, Barenie R, Curfman G, Darrow JJ, Kesselheim AS. The US biosimilar market: stunted
growth and possible reforms. Clin Pharmacol Ther. 105(1):92–100 (2019). https://doi.org/10.1002/cpt.
1285 PMID: 30415479
Competition and price among brand-name drugs in the same class
PLOS Medicine | https://doi.org/10.1371/journal.pmed.1002872 July 30, 2019 13 / 14
14. 41. 2018 annual report of the board of trustees of the Federal Hospital Insurance and Federal Supplemen-
tary Medical Insurance Trust Funds. Centers for Medicare and Medicaid Services. Available from:
https://www.cms.gov/Research-Statistics-Data-and-Systems/Statistics-Trends-and-Reports/
ReportsTrustFunds/downloads/tr2018.pdf. [cited 2019 June 9].
42. Dusetzina SB, Conti RM, Yu NL, Bach PB. Association of prescription drug price rebates in Medicare
Part D with patient out-of-pocket and federal spending. JAMA Intern Med. 177(8): 1185–8 (2017).
https://doi.org/10.1001/jamainternmed.2017.1885 PMID: 28558108
43. Schwartz LM, Woloshin S. Medical marketing in the United States, 1997–2016. JAMA. 321(1):80–96
(2019). https://doi.org/10.1001/jama.2018.19320 PMID: 30620375
44. Stern AD, Pietrulla F, Herr A, Kesselheim AS, Sarpatwari A. The impact of price regulation on the avail-
ability of new drugs in Germany. Health Aff. 38(7):1182–7 (2019).
45. Lexchin J. Do manufacturers of brand-name drugs engage in price competition? An analysis of intro-
ductory prices. CMAJ 174(8):1120–1 (2006). https://doi.org/10.1503/cmaj.051687 PMID: 16606961
Competition and price among brand-name drugs in the same class
PLOS Medicine | https://doi.org/10.1371/journal.pmed.1002872 July 30, 2019 14 / 14