Market signals for the us stock market s and p 500 index and indian stock market nifty index for the
•
0 likes•494 views

Market Signals for the US & Indian Stock Markets this Week

Recommended
Recommended
More Related Content
Recently uploaded
Recently uploaded (20)
Featured
Featured (20)
Market signals for the us stock market s and p 500 index and indian stock market nifty index for the
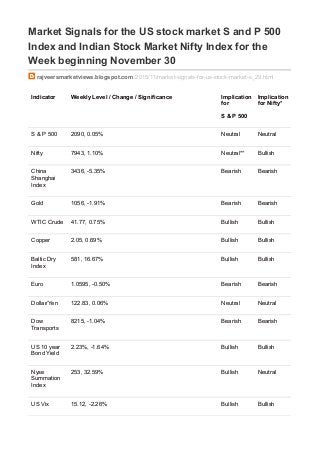
- 1. Market Signals for the US stock market S and P 500 Index and Indian Stock Market Nifty Index for the Week beginning November 30 rajveersmarketviews.blogspot.com/2015/11/market-signals-for-us-stock-market-s_29.html Indicator Weekly Level / Change / Significance Implication for S & P 500 Implication for Nifty* S & P 500 2090, 0.05% Neutral Neutral Nifty 7943, 1.10% Neutral** Bullish China Shanghai Index 3436, -5.35% Bearish Bearish Gold 1056, -1.91% Bearish Bearish WTIC Crude 41.77, 0.75% Bullish Bullish Copper 2.05, 0.69% Bullish Bullish Baltic Dry Index 581, 16.67% Bullish Bullish Euro 1.0595, -0.50% Bearish Bearish Dollar/Yen 122.83, 0.06% Neutral Neutral Dow Transports 8215, -1.04% Bearish Bearish US 10 year Bond Yield 2.23%, -1.64% Bullish Bullish Nyse Summation Index 253, 32.59% Bullish Neutral US Vix 15.12, -2.26% Bullish Bullish
- 2. 20 DMA, S and P 500 2081, Above Bullish Neutral 50 DMA, S and P 500 2029, Above Bullish Neutral 200 DMA, S and P 500 2065, Above Bullish Neutral 20 DMA, Nifty 7905, Above Neutral Bullish 50 DMA, Nifty 7997, Below Neutral Bearish 200 DMA, Nifty 8306, Below Neutral Bearish India Vix 16.73, 5.24% Neutral Bearish Dollar/Rupee 66.91, 1.21% Neutral Bearish Overall S & P 500 Nifty Bullish Indications 9 7 Bearish Indications 4 8 Outlook Bullish Bearish Observation The Sand P 500 and the Nifty were up last week. Indicators are bullish. Markets are back at resistance and the Vix is signaling complacency. A major break out is likely this week. On the Horizon Australia - Rate decision, Canada - Rate decision, Swiss – Retail sales, Euro zone – German employment data, CPI & PPI, ECB rate decision, U.S – employment data, India – Rate decision, GDP. *Nifty India’s Benchmark Stock Market Index Raw Data Courtesy Google finance, Stock charts, FXCM
- 3. **Neutral Changes less than 0.5% are considered neutral The US market was up slightly and the Nifty rallied last week. Signals are mixed for the upcoming week. The markets are back at resistance and are likely to correct with most emerging markets, and commodities already breaking down on a strong dollar and a hawkish FED. The critical levels to watch are 2100 (up) and 2065 (down) on the S & P and 8000 (up) and 7800 (down) on the Nifty. A significant breach of the above levels could trigger the next big move in the above markets. You can check out last week’s report for a comparison. You can also check out snapshots of the S and P 500 and Nifty Indices. Love your thoughts and feedback.