10 Steps to build a periodic summary statistical report

Pier Giuseppe De Meo
Pier Giuseppe De MeoData Warehouse and Business Intelligence Specialist

"𝗾𝘂𝗶𝗰𝗸 𝗮𝗻𝗱 𝗱𝗶𝗿𝘁𝘆" 𝗼𝗿 "𝗳𝗮𝘀𝘁 𝗮𝗻𝗱 𝗳𝘂𝗿𝗶𝗼𝘂𝘀"? 𝗡𝗼 𝗧𝗵𝗮𝗻𝗸𝘀. 𝗜 𝘀𝘁𝗮𝗻𝗱𝗮𝗿𝗱𝗶𝘇𝗲! Optimizing the generation of periodic reports means standardizing. The new and increasingly powerful data analysis tools and the "democratization" of the process itself shift the focus on the "analytical" aspect of the tool, often leaving out the "reporting" functions: the tool is often used to perform "quick analysis" and dirty "(which at times seem more "fast and furious") neglecting the production and sharing of "institutional" reports that periodically show updated information of interest. But, if you need to create reports to be updated periodically, you will necessarily have to address the issue of the standardization of the process. Using these 10 steps in the design, in addition to standardizing the production process, the user-side data interpretation process is also facilitated and optimized as, over time, they become familiar with the data they receive periodically. # # # #dataviz ####

10 STEPS TO BUILD A
PERIODIC SUMMARY
STATISTICAL REPORT
BY PIER GIUSEPPE DE MEO
#1
Identify the information and create statistical analysis, KPIs and visualizations to be
included in the Report (eg Resident population, number of residents, annual increase, pie chart
for registration type in the registry, etc.).
Knowledge
Share
Series 4
Data Visualization


"The production of periodic summary statistical reports must necessarily go
through the standardization of the report structure itself"
#2
Define the macro-structure of the Report based on the objectives and distribution type
(organization internal / external report) (eg Cover + Body + References / Contacts for a report to
be distributed outside the company).
#3
Define the layout of the "First page": corporate cover, introductory text, infographics, etc. always
associated with information related to producer and possible users (eg. Author, Date of publication,
Period of reference, etc.).
#4
Define the layout of the "Last Page": presentation and contacts of the author, summary of data sources,
methods of collecting and building indicators, operating instructions for interpreting data, etc. (eg for
an internal report the author's contacts are superfluous while the operating instructions are useful).
#5
Define the layout of the "Body" of the Report: the Report can consist of one or more pages and it is
important that the layout defined is used in all of them; pages that will not have the same layout can be
used to highlight relevant information.
#6
Layout of the "Body" - Upper area - Upper left corner: it is the point that is usually the first to be
viewed. It is advisable to enter information that you want to highlight (e.g. title of the report, period of
competence, company logo, etc. - it depends on the context, who is the user, etc.).
#7
Layout of the "Body" - Upper area - Upper right corner: it is the other fundamental point in which to
insert measures and numerical indicators that summarize the analysis presented in the central area of
the report (eg total annual value that anticipates the display of the monthly value in the year).
#9
Layout of the "Body" - Header and footer area: they are optional (but at least one of the two should be
inserted) and can be well separated from the central / upper part with lines / colors or inserted in
continuity with them; they are useful for reporting generic information of the report or specific of the
page (eg author, source, etc. or page name, measures analyzed on the page, etc.).
#10
Text format and colors: it is a good idea to use a single font per Area (and keep it consistent throughout
the report); also for colors, you should maintain consistency in the different sections that perform
similar analyzes on different measures or always keep the same color for a certain measure (in general,
it is good not to use too many different colors in the same report).
#8
Layout of the "Body" - Central area: it can be structured in one or more columns (I recommend not more
than two) and separated with colors / lines from the upper area; it must contain the charts, tables and
text related to the identified (eg single column with pie chart, followed by a pivot table and a short
descriptive text).

More Related Content

Similar to 10 Steps to build a periodic summary statistical report(20)

presentation.ppt2presentation.ppt2
presentation.ppt2
Matilda Kamara907 views
Report writingReport writing
Report writing
PRUDHVI YUGANDHAR699 views
Anna university project guidelines (1)Anna university project guidelines (1)
Anna university project guidelines (1)
Arasuraja Ganesan5.4K views
Research project reportResearch project report
Research project report
shweta saxena1.4K views
Report writingReport writing
Report writing
Syed Muhammad Haris Hayat4.2K views
Report formatReport format
Report format
zirram148K views
Manual2013 pr (1)Manual2013 pr (1)
Manual2013 pr (1)
Robin Son221 views
Presentation in csm 5Presentation in csm 5
Presentation in csm 5
rosalinecad415 views
Definition1ijazDefinition1ijaz
Definition1ijaz
Ijazulhaq Saberi161 views
15. Report Design15. Report Design
15. Report Design
Audrey Britton6 views
designing reportsdesigning reports
designing reports
i i694 views
Mba project formatMba project format
Mba project format
Amul Raj33.2K views
Types of technical reportsTypes of technical reports
Types of technical reports
Neyo Adasko28.3K views
Types of technical reportsTypes of technical reports
Types of technical reports
JOBERT DOMINGUEZ RONABIO2.2K views
UNIT-I-TS&F.pptxUNIT-I-TS&F.pptx
UNIT-I-TS&F.pptx
EugeneBernaI4 views

More from Pier Giuseppe De Meo(9)

Bilancio Demografico Nazionale del 2019Bilancio Demografico Nazionale del 2019
Bilancio Demografico Nazionale del 2019
Pier Giuseppe De Meo113 views
10 Passi per Set di Dati di Alta-Qualità10 Passi per Set di Dati di Alta-Qualità
10 Passi per Set di Dati di Alta-Qualità
Pier Giuseppe De Meo9 views
Covid19 20200406Covid19 20200406
Covid19 20200406
Pier Giuseppe De Meo120 views
10 Steps for High Quality Datasets10 Steps for High Quality Datasets
10 Steps for High Quality Datasets
Pier Giuseppe De Meo47 views
BES 2018 - La Soddisfazione sul LavoroBES 2018 - La Soddisfazione sul Lavoro
BES 2018 - La Soddisfazione sul Lavoro
Pier Giuseppe De Meo404 views

Recently uploaded(20)

PTicketInput.pdfPTicketInput.pdf
PTicketInput.pdf
stuartmcphersonflipm314 views
ColonyOSColonyOS
ColonyOS
JohanKristiansson69 views
How Leaders See Data? (Level 1)How Leaders See Data? (Level 1)
How Leaders See Data? (Level 1)
Narendra Narendra10 views
RIO GRANDE SUPPLY COMPANY INC, JAYSON.docxRIO GRANDE SUPPLY COMPANY INC, JAYSON.docx
RIO GRANDE SUPPLY COMPANY INC, JAYSON.docx
JaysonGarabilesEspej6 views
Journey of Generative AIJourney of Generative AI
Journey of Generative AI
thomasjvarghese4918 views
RuleBookForTheFairDataEconomy.pptxRuleBookForTheFairDataEconomy.pptx
RuleBookForTheFairDataEconomy.pptx
noraelstela166 views
3196 The Case of The East River3196 The Case of The East River
3196 The Case of The East River
ErickANDRADE9011 views
MOSORE_BRESCIAMOSORE_BRESCIA
MOSORE_BRESCIA
Federico Karagulian5 views
Survey on Factuality in LLM's.pptxSurvey on Factuality in LLM's.pptx
Survey on Factuality in LLM's.pptx
NeethaSherra15 views
Microsoft Fabric.pptxMicrosoft Fabric.pptx
Microsoft Fabric.pptx
Shruti Chaurasia19 views
PROGRAMME.pdfPROGRAMME.pdf
PROGRAMME.pdf
HiNedHaJar14 views
Data structure and algorithm. Data structure and algorithm.
Data structure and algorithm.
Abdul salam 12 views

10 Steps to build a periodic summary statistical report

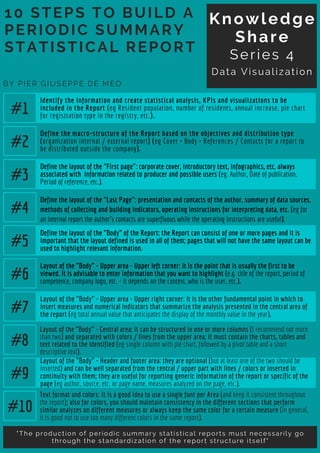
  • 1. 10 STEPS TO BUILD A PERIODIC SUMMARY STATISTICAL REPORT BY PIER GIUSEPPE DE MEO #1 Identify the information and create statistical analysis, KPIs and visualizations to be included in the Report (eg Resident population, number of residents, annual increase, pie chart for registration type in the registry, etc.). Knowledge Share Series 4 Data Visualization "The production of periodic summary statistical reports must necessarily go through the standardization of the report structure itself" #2 Define the macro-structure of the Report based on the objectives and distribution type (organization internal / external report) (eg Cover + Body + References / Contacts for a report to be distributed outside the company). #3 Define the layout of the "First page": corporate cover, introductory text, infographics, etc. always associated with information related to producer and possible users (eg. Author, Date of publication, Period of reference, etc.). #4 Define the layout of the "Last Page": presentation and contacts of the author, summary of data sources, methods of collecting and building indicators, operating instructions for interpreting data, etc. (eg for an internal report the author's contacts are superfluous while the operating instructions are useful). #5 Define the layout of the "Body" of the Report: the Report can consist of one or more pages and it is important that the layout defined is used in all of them; pages that will not have the same layout can be used to highlight relevant information. #6 Layout of the "Body" - Upper area - Upper left corner: it is the point that is usually the first to be viewed. It is advisable to enter information that you want to highlight (e.g. title of the report, period of competence, company logo, etc. - it depends on the context, who is the user, etc.). #7 Layout of the "Body" - Upper area - Upper right corner: it is the other fundamental point in which to insert measures and numerical indicators that summarize the analysis presented in the central area of the report (eg total annual value that anticipates the display of the monthly value in the year). #9 Layout of the "Body" - Header and footer area: they are optional (but at least one of the two should be inserted) and can be well separated from the central / upper part with lines / colors or inserted in continuity with them; they are useful for reporting generic information of the report or specific of the page (eg author, source, etc. or page name, measures analyzed on the page, etc.). #10 Text format and colors: it is a good idea to use a single font per Area (and keep it consistent throughout the report); also for colors, you should maintain consistency in the different sections that perform similar analyzes on different measures or always keep the same color for a certain measure (in general, it is good not to use too many different colors in the same report). #8 Layout of the "Body" - Central area: it can be structured in one or more columns (I recommend not more than two) and separated with colors / lines from the upper area; it must contain the charts, tables and text related to the identified (eg single column with pie chart, followed by a pivot table and a short descriptive text).