SlideShare a Scribd company logo
1 of 19
Download to read offline
Properties of Linear Relations
Slide 1
In a linear relation the graph is a straight line and both the
dependent and independent variables have constant change.
Distance (km) Cost ($)
0 60
100 80
200 100
300 120
400 140
Independent
Variable
Dependent
Variable
+20
+20
+20
+20
+100
+100
+100
+100
Properties of Linear Relations
Slide 2
In a linear relation the graph is a straight line and both the
dependent and independent variables have constant change.
0
20
40
60
80
100
120
140
160
0 50 100 150 200 250 300 350 400 450
Cost($)
Distance (km)
Car Rental Cost
+20
Change in
Dependent Variable
+100
Change in
Independent Variable
Slide 3
Example 1: Which table of values represents a linear relation?
Justify the answer.
Celsius
(C)
Fahrenheit
(F)
0 31
5 41
10 50
15 59
20 68
The relationship between
temperature in degrees
Celsius, C, and temperature
in degrees Fahrenheit, F.
Amps
(I)
Watts
(P)
0 0
5 75
10 300
15 675
20 1200
The relationship between
the current, I amps, and
power, P watts, in an
electrical current.
Slide 4
Example 1: Which table of values represents a linear relation?
Justify the answer.
Celsius
(C)
Fahrenheit
(F)
0 31
5 41
10 50
15 59
20 68
Amps
(I)
Watts
(P)
0 0
5 75
10 300
15 675
20 1200
+5
+5
+5
+5
+9
+9
+9
+9
This is a linear relation.
The changes in both
variables are constant.
Slide 5
Example 1: Which table of values represents a linear relation?
Justify the answer.
Celsius
(C)
Fahrenheit
(F)
0 31
5 41
10 50
15 59
20 68
Amps
(I)
Watts
(P)
0 0
5 75
10 300
15 675
20 1200
+5
+5
+5
+5
+9
+9
+9
+9
This is a linear relation.
The changes in both
variables are constant.
+5
+5
+5
+5
+75
+225
+375
+525
This is NOT a linear relation.
The changes in P are not
constant.
Slide 6
Example 1: Graph the equation and state if it represents a linear
relation.
3 25y x  
x y
-3
-1
0
1
3
Slide 7
Example 1: Graph the equation and state if it represents a linear
relation.
3 25y x  
x y
-3 34
-1 28
0 25
1 22
3 16
Answer:
The above equation is a linear relation.
Slide 8
Example 2: Graph the equation and state if it represents a linear
relation.
2
2 5y x 
x y
-3
-1
0
1
3
Slide 9
Example 2: Graph the equation and state if it represents a linear
relation.
2
2 5y x 
x y
-3 23
-1 7
0 5
1 7
3 23
Answer:
The above equation is NOT a linear relation (not a straight line).
Slide 10
Example 3: Graph the equation and state if it represents a linear
relation.
5y 
x y
-3
-1
0
1
3
Slide 11
Example 3: Graph the equation and state if it represents a linear
relation.
5y 
x y
-3 5
-1 5
0 5
1 5
3 5
Answer:
The above equation is a linear relation.
Slide 12
Example 3: Graph the equation and state if it represents a linear
relation.
4x  
x y
-3
-1
0
1
3
Slide 13
Example 3: Graph the equation and state if it represents a linear
relation.
4x  
x y
-4 -3
-4 -1
-4 0
-4 1
-4 3
Answer:
The above equation is a linear relation.
Change of Rate
Slide 14
𝑅𝑎𝑡𝑒 𝑜𝑓 𝐶ℎ𝑎𝑛𝑔𝑒 =
𝐶ℎ𝑎𝑛𝑔𝑒 𝑖𝑛 𝐷𝑒𝑝𝑒𝑛𝑑𝑒𝑛𝑡 𝑉𝑎𝑟𝑖𝑎𝑏𝑙𝑒
𝐶ℎ𝑎𝑛𝑔𝑒 𝑖𝑛 𝐼𝑛𝑑𝑒𝑝𝑒𝑛𝑑𝑒𝑛𝑡 𝑉𝑎𝑟𝑖𝑎𝑏𝑙𝑒
Slide 15
Example 1: This graph shows the altitude of
a helicopter as it lifts off.
a) Identify the dependent and independent
variables.
b) Find the rate of change. What does it
represent?
Slide 16
Example 1: This graph shows the altitude of
a helicopter as it lifts off.
a) Identify the dependent and independent
variables.
b) Find the rate of change. What does it
represent?
The dependent variable is the Altitude.
The independent variable is Time.
Slide 17
Example 1: This graph shows the altitude of
a helicopter as it lifts off.
a) Identify the dependent and independent
variables.
b) Find the rate of change. What does it
represent?
The dependent variable is the Altitude.
The independent variable is Time.
𝑅𝑎𝑡𝑒 𝑜𝑓 𝐶ℎ𝑎𝑛𝑔𝑒 =
𝑐ℎ𝑎𝑛𝑔𝑒 𝑖𝑛 𝑑𝑒𝑝𝑒𝑛𝑑. 𝑣𝑎𝑟.
𝑐ℎ𝑎𝑛𝑔𝑒 𝑖𝑛 𝑖𝑛𝑑𝑒𝑝𝑒𝑛𝑑. 𝑣𝑎𝑟.
𝐶ℎ𝑎𝑛𝑔𝑒 𝑖𝑛 𝑑𝑒𝑝𝑒𝑛𝑑. 𝑣𝑎𝑟. = 240 𝑚 − 120 𝑚 = 120 𝑚
𝐶ℎ𝑎𝑛𝑔𝑒 𝑖𝑛 𝑖𝑛𝑑𝑒𝑝𝑒𝑛𝑑. 𝑣𝑎𝑟. = 120 𝑠 − 60 𝑠 = 60 𝑠
𝑅𝑎𝑡𝑒 𝑜𝑓 𝐶ℎ𝑎𝑛𝑔𝑒 =
120 𝑚
60 𝑠
= 2 𝑚/𝑠 Answer:
The rate of change is 2 m/s. It
represents the helicopter
climbing 2 metres every second.
Slide 18
Example 2: This graph shows the altitude of
a helicopter as it descents to land.
a) Identify the dependent and independent
variables.
b) Find the rate of change. What does it
represent?
Slide 19
Example 2: This graph shows the altitude of
a helicopter as it descents to land.
a) Identify the dependent and independent
variables.
b) Find the rate of change. What does it
represent?
The dependent variable is the Altitude.
The independent variable is Time.
𝑅𝑎𝑡𝑒 𝑜𝑓 𝐶ℎ𝑎𝑛𝑔𝑒 =
𝑐ℎ𝑎𝑛𝑔𝑒 𝑖𝑛 𝑑𝑒𝑝𝑒𝑛𝑑. 𝑣𝑎𝑟.
𝑐ℎ𝑎𝑛𝑔𝑒 𝑖𝑛 𝑖𝑛𝑑𝑒𝑝𝑒𝑛𝑑. 𝑣𝑎𝑟.
𝑅𝑎𝑡𝑒 𝑜𝑓 𝐶ℎ𝑎𝑛𝑔𝑒 =
180 𝑚 − 0 𝑚
60 𝑠 − 120 𝑠
=
180 𝑚
−60 𝑠
= −3 𝑚/𝑠
Answer:
The rate of change is -3 m/s. It represents the helicopter
descending 3 metres every second.

More Related Content

What's hot

Vogel’s Approximation Method (VAM)
Vogel’s Approximation Method (VAM)Vogel’s Approximation Method (VAM)
Vogel’s Approximation Method (VAM)dkpawar
 
Research_presentation
Research_presentationResearch_presentation
Research_presentationJoanna S.
 
11.3 slope of a line
11.3 slope of a line11.3 slope of a line
11.3 slope of a lineGlenSchlee
 
Inverse Variation
Inverse VariationInverse Variation
Inverse VariationJoseph Nilo
 

What's hot (9)

Forecasting
ForecastingForecasting
Forecasting
 
Vogel’s Approximation Method (VAM)
Vogel’s Approximation Method (VAM)Vogel’s Approximation Method (VAM)
Vogel’s Approximation Method (VAM)
 
Research_presentation
Research_presentationResearch_presentation
Research_presentation
 
Slope of a line
Slope of a lineSlope of a line
Slope of a line
 
Exact values
Exact valuesExact values
Exact values
 
11.3 slope of a line
11.3 slope of a line11.3 slope of a line
11.3 slope of a line
 
Slope formula
Slope formulaSlope formula
Slope formula
 
Matemáticas
MatemáticasMatemáticas
Matemáticas
 
Inverse Variation
Inverse VariationInverse Variation
Inverse Variation
 

Similar to MF10 5 6-Properties Linear Relations

linear Regression, multiple Regression and Annova
linear Regression, multiple Regression and Annovalinear Regression, multiple Regression and Annova
linear Regression, multiple Regression and AnnovaMansi Rastogi
 
Rate of change and slope
Rate of change and slopeRate of change and slope
Rate of change and slopeJessica Garcia
 
Correlation by Neeraj Bhandari ( Surkhet.Nepal )
Correlation by Neeraj Bhandari ( Surkhet.Nepal )Correlation by Neeraj Bhandari ( Surkhet.Nepal )
Correlation by Neeraj Bhandari ( Surkhet.Nepal )Neeraj Bhandari
 
ML-UNIT-IV complete notes download here
ML-UNIT-IV  complete notes download hereML-UNIT-IV  complete notes download here
ML-UNIT-IV complete notes download herekeerthanakshatriya20
 
Direct Variation
Direct VariationDirect Variation
Direct Variationswartzje
 
functions-of-several-variables.ppt
functions-of-several-variables.pptfunctions-of-several-variables.ppt
functions-of-several-variables.pptDavidbham
 
functions-of-several-variables-221222191225-6a5c18ce.pdf
functions-of-several-variables-221222191225-6a5c18ce.pdffunctions-of-several-variables-221222191225-6a5c18ce.pdf
functions-of-several-variables-221222191225-6a5c18ce.pdftogakod238
 
Directvariation
DirectvariationDirectvariation
Directvariationstephif20
 
directvariation.ppt
directvariation.pptdirectvariation.ppt
directvariation.pptRodelLaman1
 
Corr-and-Regress (1).ppt
Corr-and-Regress (1).pptCorr-and-Regress (1).ppt
Corr-and-Regress (1).pptMuhammadAftab89
 
Cr-and-Regress.ppt
Cr-and-Regress.pptCr-and-Regress.ppt
Cr-and-Regress.pptRidaIrfan10
 
Corr-and-Regress.ppt
Corr-and-Regress.pptCorr-and-Regress.ppt
Corr-and-Regress.pptkrunal soni
 
Corr-and-Regress.ppt
Corr-and-Regress.pptCorr-and-Regress.ppt
Corr-and-Regress.pptMoinPasha12
 

Similar to MF10 5 6-Properties Linear Relations (20)

Reg
RegReg
Reg
 
Stat sample test ch 10
Stat sample test ch 10Stat sample test ch 10
Stat sample test ch 10
 
linear Regression, multiple Regression and Annova
linear Regression, multiple Regression and Annovalinear Regression, multiple Regression and Annova
linear Regression, multiple Regression and Annova
 
Rate of change and slope
Rate of change and slopeRate of change and slope
Rate of change and slope
 
Variation
VariationVariation
Variation
 
Correlation by Neeraj Bhandari ( Surkhet.Nepal )
Correlation by Neeraj Bhandari ( Surkhet.Nepal )Correlation by Neeraj Bhandari ( Surkhet.Nepal )
Correlation by Neeraj Bhandari ( Surkhet.Nepal )
 
Chapter5
Chapter5Chapter5
Chapter5
 
ML-UNIT-IV complete notes download here
ML-UNIT-IV  complete notes download hereML-UNIT-IV  complete notes download here
ML-UNIT-IV complete notes download here
 
Direct Variation
Direct VariationDirect Variation
Direct Variation
 
functions-of-several-variables.ppt
functions-of-several-variables.pptfunctions-of-several-variables.ppt
functions-of-several-variables.ppt
 
functions-of-several-variables-221222191225-6a5c18ce.pdf
functions-of-several-variables-221222191225-6a5c18ce.pdffunctions-of-several-variables-221222191225-6a5c18ce.pdf
functions-of-several-variables-221222191225-6a5c18ce.pdf
 
Directvariation
DirectvariationDirectvariation
Directvariation
 
Ch01 1
Ch01 1Ch01 1
Ch01 1
 
directvariation.ppt
directvariation.pptdirectvariation.ppt
directvariation.ppt
 
directvariation.ppt
directvariation.pptdirectvariation.ppt
directvariation.ppt
 
Corr-and-Regress (1).ppt
Corr-and-Regress (1).pptCorr-and-Regress (1).ppt
Corr-and-Regress (1).ppt
 
Corr-and-Regress.ppt
Corr-and-Regress.pptCorr-and-Regress.ppt
Corr-and-Regress.ppt
 
Cr-and-Regress.ppt
Cr-and-Regress.pptCr-and-Regress.ppt
Cr-and-Regress.ppt
 
Corr-and-Regress.ppt
Corr-and-Regress.pptCorr-and-Regress.ppt
Corr-and-Regress.ppt
 
Corr-and-Regress.ppt
Corr-and-Regress.pptCorr-and-Regress.ppt
Corr-and-Regress.ppt
 

More from OLCTeacher

Credit Card Calculations
Credit Card CalculationsCredit Card Calculations
Credit Card CalculationsOLCTeacher
 
MWA10 2.4 Deductions
MWA10 2.4 DeductionsMWA10 2.4 Deductions
MWA10 2.4 DeductionsOLCTeacher
 
MWA10 7.2 Sine Ratio
MWA10 7.2 Sine RatioMWA10 7.2 Sine Ratio
MWA10 7.2 Sine RatioOLCTeacher
 
MWA10 6.2 Similar Polygons
MWA10 6.2 Similar PolygonsMWA10 6.2 Similar Polygons
MWA10 6.2 Similar PolygonsOLCTeacher
 
MWA10 5.3 NonParallel Lines
MWA10 5.3 NonParallel LinesMWA10 5.3 NonParallel Lines
MWA10 5.3 NonParallel LinesOLCTeacher
 
MWA10 3.4 Volume Imperial Measurement
MWA10 3.4 Volume Imperial MeasurementMWA10 3.4 Volume Imperial Measurement
MWA10 3.4 Volume Imperial MeasurementOLCTeacher
 
MWA 10 7.5 Solving Triangles
MWA 10 7.5 Solving TrianglesMWA 10 7.5 Solving Triangles
MWA 10 7.5 Solving TrianglesOLCTeacher
 
MWA 10 7.1 Pythagorean
MWA 10 7.1 PythagoreanMWA 10 7.1 Pythagorean
MWA 10 7.1 PythagoreanOLCTeacher
 
MWA 10 6.4 Similar Triangles
MWA 10 6.4 Similar TrianglesMWA 10 6.4 Similar Triangles
MWA 10 6.4 Similar TrianglesOLCTeacher
 
MWA 10 5.1 Angles
MWA 10 5.1 AnglesMWA 10 5.1 Angles
MWA 10 5.1 AnglesOLCTeacher
 
MWA 10 4.4 Conversions
MWA 10 4.4 ConversionsMWA 10 4.4 Conversions
MWA 10 4.4 ConversionsOLCTeacher
 
MWA 10: 1.2 Unit Price
MWA 10: 1.2 Unit PriceMWA 10: 1.2 Unit Price
MWA 10: 1.2 Unit PriceOLCTeacher
 
MWA 10: 1.3 Setting Price
MWA 10: 1.3 Setting PriceMWA 10: 1.3 Setting Price
MWA 10: 1.3 Setting PriceOLCTeacher
 
MWA 10: 1.4 On Sale
MWA 10: 1.4 On SaleMWA 10: 1.4 On Sale
MWA 10: 1.4 On SaleOLCTeacher
 
MWA30 Chapter 2
MWA30 Chapter 2MWA30 Chapter 2
MWA30 Chapter 2OLCTeacher
 
Howdocompanysusesystemsofequations
HowdocompanysusesystemsofequationsHowdocompanysusesystemsofequations
HowdocompanysusesystemsofequationsOLCTeacher
 
Acct20-Chapter17
Acct20-Chapter17Acct20-Chapter17
Acct20-Chapter17OLCTeacher
 
Acct20-Chapter16
Acct20-Chapter16Acct20-Chapter16
Acct20-Chapter16OLCTeacher
 

More from OLCTeacher (20)

Credit Card Calculations
Credit Card CalculationsCredit Card Calculations
Credit Card Calculations
 
MWA10 2.4 Deductions
MWA10 2.4 DeductionsMWA10 2.4 Deductions
MWA10 2.4 Deductions
 
MWA10 7.2 Sine Ratio
MWA10 7.2 Sine RatioMWA10 7.2 Sine Ratio
MWA10 7.2 Sine Ratio
 
MWA10 6.2 Similar Polygons
MWA10 6.2 Similar PolygonsMWA10 6.2 Similar Polygons
MWA10 6.2 Similar Polygons
 
MWA10 5.3 NonParallel Lines
MWA10 5.3 NonParallel LinesMWA10 5.3 NonParallel Lines
MWA10 5.3 NonParallel Lines
 
MWA10 3.4 Volume Imperial Measurement
MWA10 3.4 Volume Imperial MeasurementMWA10 3.4 Volume Imperial Measurement
MWA10 3.4 Volume Imperial Measurement
 
MWA 10 7.5 Solving Triangles
MWA 10 7.5 Solving TrianglesMWA 10 7.5 Solving Triangles
MWA 10 7.5 Solving Triangles
 
MWA 10 7.1 Pythagorean
MWA 10 7.1 PythagoreanMWA 10 7.1 Pythagorean
MWA 10 7.1 Pythagorean
 
MWA 10 6.4 Similar Triangles
MWA 10 6.4 Similar TrianglesMWA 10 6.4 Similar Triangles
MWA 10 6.4 Similar Triangles
 
MWA 10 5.1 Angles
MWA 10 5.1 AnglesMWA 10 5.1 Angles
MWA 10 5.1 Angles
 
MWA 10 4.4 Conversions
MWA 10 4.4 ConversionsMWA 10 4.4 Conversions
MWA 10 4.4 Conversions
 
MWA 10: 1.2 Unit Price
MWA 10: 1.2 Unit PriceMWA 10: 1.2 Unit Price
MWA 10: 1.2 Unit Price
 
MWA 10: 1.3 Setting Price
MWA 10: 1.3 Setting PriceMWA 10: 1.3 Setting Price
MWA 10: 1.3 Setting Price
 
MWA 10: 1.4 On Sale
MWA 10: 1.4 On SaleMWA 10: 1.4 On Sale
MWA 10: 1.4 On Sale
 
MWA30 Chapter 2
MWA30 Chapter 2MWA30 Chapter 2
MWA30 Chapter 2
 
Mf30 project1
Mf30 project1Mf30 project1
Mf30 project1
 
Mf30 project2
Mf30 project2Mf30 project2
Mf30 project2
 
Howdocompanysusesystemsofequations
HowdocompanysusesystemsofequationsHowdocompanysusesystemsofequations
Howdocompanysusesystemsofequations
 
Acct20-Chapter17
Acct20-Chapter17Acct20-Chapter17
Acct20-Chapter17
 
Acct20-Chapter16
Acct20-Chapter16Acct20-Chapter16
Acct20-Chapter16
 

Recently uploaded

PART 1 - CHAPTER 1 - CELL THE FUNDAMENTAL UNIT OF LIFE
PART 1 - CHAPTER 1 - CELL THE FUNDAMENTAL UNIT OF LIFEPART 1 - CHAPTER 1 - CELL THE FUNDAMENTAL UNIT OF LIFE
PART 1 - CHAPTER 1 - CELL THE FUNDAMENTAL UNIT OF LIFEMISSRITIMABIOLOGYEXP
 
Q-Factor General Quiz-7th April 2024, Quiz Club NITW
Q-Factor General Quiz-7th April 2024, Quiz Club NITWQ-Factor General Quiz-7th April 2024, Quiz Club NITW
Q-Factor General Quiz-7th April 2024, Quiz Club NITWQuiz Club NITW
 
Narcotic and Non Narcotic Analgesic..pdf
Narcotic and Non Narcotic Analgesic..pdfNarcotic and Non Narcotic Analgesic..pdf
Narcotic and Non Narcotic Analgesic..pdfPrerana Jadhav
 
MS4 level being good citizen -imperative- (1) (1).pdf
MS4 level   being good citizen -imperative- (1) (1).pdfMS4 level   being good citizen -imperative- (1) (1).pdf
MS4 level being good citizen -imperative- (1) (1).pdfMr Bounab Samir
 
BIOCHEMISTRY-CARBOHYDRATE METABOLISM CHAPTER 2.pptx
BIOCHEMISTRY-CARBOHYDRATE METABOLISM CHAPTER 2.pptxBIOCHEMISTRY-CARBOHYDRATE METABOLISM CHAPTER 2.pptx
BIOCHEMISTRY-CARBOHYDRATE METABOLISM CHAPTER 2.pptxSayali Powar
 
Indexing Structures in Database Management system.pdf
Indexing Structures in Database Management system.pdfIndexing Structures in Database Management system.pdf
Indexing Structures in Database Management system.pdfChristalin Nelson
 
Blowin' in the Wind of Caste_ Bob Dylan's Song as a Catalyst for Social Justi...
Blowin' in the Wind of Caste_ Bob Dylan's Song as a Catalyst for Social Justi...Blowin' in the Wind of Caste_ Bob Dylan's Song as a Catalyst for Social Justi...
Blowin' in the Wind of Caste_ Bob Dylan's Song as a Catalyst for Social Justi...DhatriParmar
 
Shark introduction Morphology and its behaviour characteristics
Shark introduction Morphology and its behaviour characteristicsShark introduction Morphology and its behaviour characteristics
Shark introduction Morphology and its behaviour characteristicsArubSultan
 
ClimART Action | eTwinning Project
ClimART Action    |    eTwinning ProjectClimART Action    |    eTwinning Project
ClimART Action | eTwinning Projectjordimapav
 
4.11.24 Poverty and Inequality in America.pptx
4.11.24 Poverty and Inequality in America.pptx4.11.24 Poverty and Inequality in America.pptx
4.11.24 Poverty and Inequality in America.pptxmary850239
 
BÀI TẬP BỔ TRỢ TIẾNG ANH 11 THEO ĐƠN VỊ BÀI HỌC - CẢ NĂM - CÓ FILE NGHE (GLOB...
BÀI TẬP BỔ TRỢ TIẾNG ANH 11 THEO ĐƠN VỊ BÀI HỌC - CẢ NĂM - CÓ FILE NGHE (GLOB...BÀI TẬP BỔ TRỢ TIẾNG ANH 11 THEO ĐƠN VỊ BÀI HỌC - CẢ NĂM - CÓ FILE NGHE (GLOB...
BÀI TẬP BỔ TRỢ TIẾNG ANH 11 THEO ĐƠN VỊ BÀI HỌC - CẢ NĂM - CÓ FILE NGHE (GLOB...Nguyen Thanh Tu Collection
 
ICS 2208 Lecture Slide Notes for Topic 6
ICS 2208 Lecture Slide Notes for Topic 6ICS 2208 Lecture Slide Notes for Topic 6
ICS 2208 Lecture Slide Notes for Topic 6Vanessa Camilleri
 
Satirical Depths - A Study of Gabriel Okara's Poem - 'You Laughed and Laughed...
Satirical Depths - A Study of Gabriel Okara's Poem - 'You Laughed and Laughed...Satirical Depths - A Study of Gabriel Okara's Poem - 'You Laughed and Laughed...
Satirical Depths - A Study of Gabriel Okara's Poem - 'You Laughed and Laughed...HetalPathak10
 
Comparative Literature in India by Amiya dev.pptx
Comparative Literature in India by Amiya dev.pptxComparative Literature in India by Amiya dev.pptx
Comparative Literature in India by Amiya dev.pptxAvaniJani1
 
Scientific Writing :Research Discourse
Scientific  Writing :Research  DiscourseScientific  Writing :Research  Discourse
Scientific Writing :Research DiscourseAnita GoswamiGiri
 

Recently uploaded (20)

PART 1 - CHAPTER 1 - CELL THE FUNDAMENTAL UNIT OF LIFE
PART 1 - CHAPTER 1 - CELL THE FUNDAMENTAL UNIT OF LIFEPART 1 - CHAPTER 1 - CELL THE FUNDAMENTAL UNIT OF LIFE
PART 1 - CHAPTER 1 - CELL THE FUNDAMENTAL UNIT OF LIFE
 
Plagiarism,forms,understand about plagiarism,avoid plagiarism,key significanc...
Plagiarism,forms,understand about plagiarism,avoid plagiarism,key significanc...Plagiarism,forms,understand about plagiarism,avoid plagiarism,key significanc...
Plagiarism,forms,understand about plagiarism,avoid plagiarism,key significanc...
 
Introduction to Research ,Need for research, Need for design of Experiments, ...
Introduction to Research ,Need for research, Need for design of Experiments, ...Introduction to Research ,Need for research, Need for design of Experiments, ...
Introduction to Research ,Need for research, Need for design of Experiments, ...
 
Q-Factor General Quiz-7th April 2024, Quiz Club NITW
Q-Factor General Quiz-7th April 2024, Quiz Club NITWQ-Factor General Quiz-7th April 2024, Quiz Club NITW
Q-Factor General Quiz-7th April 2024, Quiz Club NITW
 
Narcotic and Non Narcotic Analgesic..pdf
Narcotic and Non Narcotic Analgesic..pdfNarcotic and Non Narcotic Analgesic..pdf
Narcotic and Non Narcotic Analgesic..pdf
 
MS4 level being good citizen -imperative- (1) (1).pdf
MS4 level   being good citizen -imperative- (1) (1).pdfMS4 level   being good citizen -imperative- (1) (1).pdf
MS4 level being good citizen -imperative- (1) (1).pdf
 
Mattingly "AI & Prompt Design" - Introduction to Machine Learning"
Mattingly "AI & Prompt Design" - Introduction to Machine Learning"Mattingly "AI & Prompt Design" - Introduction to Machine Learning"
Mattingly "AI & Prompt Design" - Introduction to Machine Learning"
 
BIOCHEMISTRY-CARBOHYDRATE METABOLISM CHAPTER 2.pptx
BIOCHEMISTRY-CARBOHYDRATE METABOLISM CHAPTER 2.pptxBIOCHEMISTRY-CARBOHYDRATE METABOLISM CHAPTER 2.pptx
BIOCHEMISTRY-CARBOHYDRATE METABOLISM CHAPTER 2.pptx
 
Indexing Structures in Database Management system.pdf
Indexing Structures in Database Management system.pdfIndexing Structures in Database Management system.pdf
Indexing Structures in Database Management system.pdf
 
Blowin' in the Wind of Caste_ Bob Dylan's Song as a Catalyst for Social Justi...
Blowin' in the Wind of Caste_ Bob Dylan's Song as a Catalyst for Social Justi...Blowin' in the Wind of Caste_ Bob Dylan's Song as a Catalyst for Social Justi...
Blowin' in the Wind of Caste_ Bob Dylan's Song as a Catalyst for Social Justi...
 
Chi-Square Test Non Parametric Test Categorical Variable
Chi-Square Test Non Parametric Test Categorical VariableChi-Square Test Non Parametric Test Categorical Variable
Chi-Square Test Non Parametric Test Categorical Variable
 
Shark introduction Morphology and its behaviour characteristics
Shark introduction Morphology and its behaviour characteristicsShark introduction Morphology and its behaviour characteristics
Shark introduction Morphology and its behaviour characteristics
 
Paradigm shift in nursing research by RS MEHTA
Paradigm shift in nursing research by RS MEHTAParadigm shift in nursing research by RS MEHTA
Paradigm shift in nursing research by RS MEHTA
 
ClimART Action | eTwinning Project
ClimART Action    |    eTwinning ProjectClimART Action    |    eTwinning Project
ClimART Action | eTwinning Project
 
4.11.24 Poverty and Inequality in America.pptx
4.11.24 Poverty and Inequality in America.pptx4.11.24 Poverty and Inequality in America.pptx
4.11.24 Poverty and Inequality in America.pptx
 
BÀI TẬP BỔ TRỢ TIẾNG ANH 11 THEO ĐƠN VỊ BÀI HỌC - CẢ NĂM - CÓ FILE NGHE (GLOB...
BÀI TẬP BỔ TRỢ TIẾNG ANH 11 THEO ĐƠN VỊ BÀI HỌC - CẢ NĂM - CÓ FILE NGHE (GLOB...BÀI TẬP BỔ TRỢ TIẾNG ANH 11 THEO ĐƠN VỊ BÀI HỌC - CẢ NĂM - CÓ FILE NGHE (GLOB...
BÀI TẬP BỔ TRỢ TIẾNG ANH 11 THEO ĐƠN VỊ BÀI HỌC - CẢ NĂM - CÓ FILE NGHE (GLOB...
 
ICS 2208 Lecture Slide Notes for Topic 6
ICS 2208 Lecture Slide Notes for Topic 6ICS 2208 Lecture Slide Notes for Topic 6
ICS 2208 Lecture Slide Notes for Topic 6
 
Satirical Depths - A Study of Gabriel Okara's Poem - 'You Laughed and Laughed...
Satirical Depths - A Study of Gabriel Okara's Poem - 'You Laughed and Laughed...Satirical Depths - A Study of Gabriel Okara's Poem - 'You Laughed and Laughed...
Satirical Depths - A Study of Gabriel Okara's Poem - 'You Laughed and Laughed...
 
Comparative Literature in India by Amiya dev.pptx
Comparative Literature in India by Amiya dev.pptxComparative Literature in India by Amiya dev.pptx
Comparative Literature in India by Amiya dev.pptx
 
Scientific Writing :Research Discourse
Scientific  Writing :Research  DiscourseScientific  Writing :Research  Discourse
Scientific Writing :Research Discourse
 

MF10 5 6-Properties Linear Relations

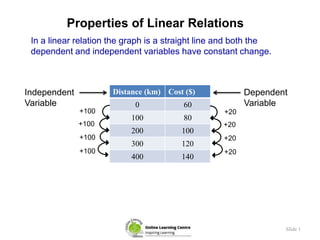
  • 1. Properties of Linear Relations Slide 1 In a linear relation the graph is a straight line and both the dependent and independent variables have constant change. Distance (km) Cost ($) 0 60 100 80 200 100 300 120 400 140 Independent Variable Dependent Variable +20 +20 +20 +20 +100 +100 +100 +100
  • 2. Properties of Linear Relations Slide 2 In a linear relation the graph is a straight line and both the dependent and independent variables have constant change. 0 20 40 60 80 100 120 140 160 0 50 100 150 200 250 300 350 400 450 Cost($) Distance (km) Car Rental Cost +20 Change in Dependent Variable +100 Change in Independent Variable
  • 3. Slide 3 Example 1: Which table of values represents a linear relation? Justify the answer. Celsius (C) Fahrenheit (F) 0 31 5 41 10 50 15 59 20 68 The relationship between temperature in degrees Celsius, C, and temperature in degrees Fahrenheit, F. Amps (I) Watts (P) 0 0 5 75 10 300 15 675 20 1200 The relationship between the current, I amps, and power, P watts, in an electrical current.
  • 4. Slide 4 Example 1: Which table of values represents a linear relation? Justify the answer. Celsius (C) Fahrenheit (F) 0 31 5 41 10 50 15 59 20 68 Amps (I) Watts (P) 0 0 5 75 10 300 15 675 20 1200 +5 +5 +5 +5 +9 +9 +9 +9 This is a linear relation. The changes in both variables are constant.
  • 5. Slide 5 Example 1: Which table of values represents a linear relation? Justify the answer. Celsius (C) Fahrenheit (F) 0 31 5 41 10 50 15 59 20 68 Amps (I) Watts (P) 0 0 5 75 10 300 15 675 20 1200 +5 +5 +5 +5 +9 +9 +9 +9 This is a linear relation. The changes in both variables are constant. +5 +5 +5 +5 +75 +225 +375 +525 This is NOT a linear relation. The changes in P are not constant.
  • 6. Slide 6 Example 1: Graph the equation and state if it represents a linear relation. 3 25y x   x y -3 -1 0 1 3
  • 7. Slide 7 Example 1: Graph the equation and state if it represents a linear relation. 3 25y x   x y -3 34 -1 28 0 25 1 22 3 16 Answer: The above equation is a linear relation.
  • 8. Slide 8 Example 2: Graph the equation and state if it represents a linear relation. 2 2 5y x  x y -3 -1 0 1 3
  • 9. Slide 9 Example 2: Graph the equation and state if it represents a linear relation. 2 2 5y x  x y -3 23 -1 7 0 5 1 7 3 23 Answer: The above equation is NOT a linear relation (not a straight line).
  • 10. Slide 10 Example 3: Graph the equation and state if it represents a linear relation. 5y  x y -3 -1 0 1 3
  • 11. Slide 11 Example 3: Graph the equation and state if it represents a linear relation. 5y  x y -3 5 -1 5 0 5 1 5 3 5 Answer: The above equation is a linear relation.
  • 12. Slide 12 Example 3: Graph the equation and state if it represents a linear relation. 4x   x y -3 -1 0 1 3
  • 13. Slide 13 Example 3: Graph the equation and state if it represents a linear relation. 4x   x y -4 -3 -4 -1 -4 0 -4 1 -4 3 Answer: The above equation is a linear relation.
  • 14. Change of Rate Slide 14 𝑅𝑎𝑡𝑒 𝑜𝑓 𝐶ℎ𝑎𝑛𝑔𝑒 = 𝐶ℎ𝑎𝑛𝑔𝑒 𝑖𝑛 𝐷𝑒𝑝𝑒𝑛𝑑𝑒𝑛𝑡 𝑉𝑎𝑟𝑖𝑎𝑏𝑙𝑒 𝐶ℎ𝑎𝑛𝑔𝑒 𝑖𝑛 𝐼𝑛𝑑𝑒𝑝𝑒𝑛𝑑𝑒𝑛𝑡 𝑉𝑎𝑟𝑖𝑎𝑏𝑙𝑒
  • 15. Slide 15 Example 1: This graph shows the altitude of a helicopter as it lifts off. a) Identify the dependent and independent variables. b) Find the rate of change. What does it represent?
  • 16. Slide 16 Example 1: This graph shows the altitude of a helicopter as it lifts off. a) Identify the dependent and independent variables. b) Find the rate of change. What does it represent? The dependent variable is the Altitude. The independent variable is Time.
  • 17. Slide 17 Example 1: This graph shows the altitude of a helicopter as it lifts off. a) Identify the dependent and independent variables. b) Find the rate of change. What does it represent? The dependent variable is the Altitude. The independent variable is Time. 𝑅𝑎𝑡𝑒 𝑜𝑓 𝐶ℎ𝑎𝑛𝑔𝑒 = 𝑐ℎ𝑎𝑛𝑔𝑒 𝑖𝑛 𝑑𝑒𝑝𝑒𝑛𝑑. 𝑣𝑎𝑟. 𝑐ℎ𝑎𝑛𝑔𝑒 𝑖𝑛 𝑖𝑛𝑑𝑒𝑝𝑒𝑛𝑑. 𝑣𝑎𝑟. 𝐶ℎ𝑎𝑛𝑔𝑒 𝑖𝑛 𝑑𝑒𝑝𝑒𝑛𝑑. 𝑣𝑎𝑟. = 240 𝑚 − 120 𝑚 = 120 𝑚 𝐶ℎ𝑎𝑛𝑔𝑒 𝑖𝑛 𝑖𝑛𝑑𝑒𝑝𝑒𝑛𝑑. 𝑣𝑎𝑟. = 120 𝑠 − 60 𝑠 = 60 𝑠 𝑅𝑎𝑡𝑒 𝑜𝑓 𝐶ℎ𝑎𝑛𝑔𝑒 = 120 𝑚 60 𝑠 = 2 𝑚/𝑠 Answer: The rate of change is 2 m/s. It represents the helicopter climbing 2 metres every second.
  • 18. Slide 18 Example 2: This graph shows the altitude of a helicopter as it descents to land. a) Identify the dependent and independent variables. b) Find the rate of change. What does it represent?
  • 19. Slide 19 Example 2: This graph shows the altitude of a helicopter as it descents to land. a) Identify the dependent and independent variables. b) Find the rate of change. What does it represent? The dependent variable is the Altitude. The independent variable is Time. 𝑅𝑎𝑡𝑒 𝑜𝑓 𝐶ℎ𝑎𝑛𝑔𝑒 = 𝑐ℎ𝑎𝑛𝑔𝑒 𝑖𝑛 𝑑𝑒𝑝𝑒𝑛𝑑. 𝑣𝑎𝑟. 𝑐ℎ𝑎𝑛𝑔𝑒 𝑖𝑛 𝑖𝑛𝑑𝑒𝑝𝑒𝑛𝑑. 𝑣𝑎𝑟. 𝑅𝑎𝑡𝑒 𝑜𝑓 𝐶ℎ𝑎𝑛𝑔𝑒 = 180 𝑚 − 0 𝑚 60 𝑠 − 120 𝑠 = 180 𝑚 −60 𝑠 = −3 𝑚/𝑠 Answer: The rate of change is -3 m/s. It represents the helicopter descending 3 metres every second.