Presentation by Jason Eis McKinsey and Company OECD INSPIRE Workshop Bio Risks 2023 impacts and dependencies in the financial sector
•
0 likes•406 views

Presentation by Jason Eis McKinsey and Company OECD INSPIRE Workshop Bio Risks 2023 impacts and dependencies in the financial sector

Recommended
Recommended
More Related Content
Similar to Presentation by Jason Eis McKinsey and Company OECD INSPIRE Workshop Bio Risks 2023 impacts and dependencies in the financial sector
Similar to Presentation by Jason Eis McKinsey and Company OECD INSPIRE Workshop Bio Risks 2023 impacts and dependencies in the financial sector (20)
More from OECD Environment
More from OECD Environment (20)
Recently uploaded
Recently uploaded (20)
Presentation by Jason Eis McKinsey and Company OECD INSPIRE Workshop Bio Risks 2023 impacts and dependencies in the financial sector
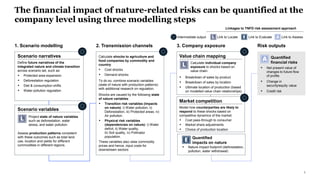
- 1. 1 1. Scenario modelling Value chain mapping Market competition 3. Company exposure Calculate individual company exposure to shocks based on value chain: Model how counterparties are likely to respond to these shocks based on competitive dynamics of the market: Cost pass-through to consumer Market share adjustments Choice of production location 2. Transmission channels Calculate shocks to agriculture and food companies by commodity and country: Cost shocks Demand shocks To do so, combine scenario variables (state of nature with production patterns) with additional research on regulation. Shocks are caused by the following state of nature variables: Transition risk variables (impacts on nature): i) Water pollution, ii) Deforestation, iii) Protected areas, iv) Air pollution. Physical risk variables (dependencies on nature): i) Water deficit, ii) Water quality, iii) Soil quality, iv) Pollinator population. These variables also raise commodity prices and hence, input costs for downstream sectors Breakdown of sales by product Breakdown of sales by location Ultimate location of production (based on modelled value chain relationships) Scenario narratives Scenario variables Define future narratives of the integrated nature and climate transition across scenario set, such as: Protected area expansion Deforestation regulation Diet & consumption shifts Water pollution regulation Assess production patterns consistent with these outcomes such as total land use, location and yields for different commodities in different regions. Net present value of changes to future flow of profits Change in security/equity value Credit risk Quantified financial risks Risk outputs Project state of nature variables such as deforestation, water stress, and water pollution. Intermediate output Link to Locate Link to Evaluate Link to Assess The financial impact of nature-related risks can be quantified at the company level using three modelling steps Nature impact footprint (deforestation, pollution, water withdrawal) Quantified impacts on nature Linkages to TNFD risk assessment approach
- 2. Parameterization a transition scenario involves close examination of policy and technology trends to determine possible futures 2030 2050 2020 FPS + Nature parameters Note: All values shown here are at the global level Emissions pricing and regulation2 USD/tCO2 in the land use sector, implicit3 Bioenergy EJ production of second-generation bioenergy Diet shifts Ruminant meat production (Mt DM/yr) Deforestation and afforestation Forest land (Mha) Food waste % of food wasted Nature markets USD/ha/yr for a biodiversity credit Land protection5 % global terrestrial protected surface area Land restoration % global terrestrial surface area under restoration6 Sustainable agriculture Nitrogen uptake efficiency (%)4 <1 8 38 4,000 26 <1 15 0 56 54 17 40 4,100 24 12 20 4 60 105 90 37 4,300 20 45 24 6 65 Climate Overlapping climate and nature Nature Update: Diet shifts are adjusted to better account for regional variation, consumer responses to prices, and slower-than-initially-anticipated alternative protein market growth Update: Sustainable agriculture levers account for emerging policy ambition to improve nitrogen fertiliser use efficiency while food waste reduction ambition increases Addition: New modelling levers are added to account for nature-related policy action 1. Updated levers are aligned with the most recent release of FPS (FPS 2022 – see Appendix) 2. Weighted average of modelled implicit carbon price 3. Implicit carbon prices proxy for a range of policies/regulations targeting a reduction in land use emissions 4. Average across regions 5. FPS 2022 accounts for current protected areas and protection of biodiversity hotspots only, after 2025 and limited to a subset of countries 6. Additional restored terrestrial land compared to 2020 (intentional restoration only, occurring due to human intervention)
- 3. 3 Changes in value due to nature risk exposure vary significantly across subsectors <1% 1.2% 0.2% <1% 0.8% 1.2% Portfolio Average 3.4% Cumulative NPV profit impact by sub-sector Unmigrated % change in NPV relative to baseline, GBF-Aligned Scenario, 2020-30 0 -10 50 10 30 20 40 Palm oil 32% 10% Beef Dairy Fruits, veg., nuts Corn 28% Soybean Cotton 47% 22% 26% 22% Subsectors with estimated net profit losses relative to baseline Subsectors with net profit gain relative to baseline Upstream Mid & Downstream The dairy alternatives subsector may gain significantly from the modelled nature transition. This is driven principally by diet shifts towards alternative proteins 2% Agricultural Support Providers Seafood Processors Pet Food Manufacturing Food and Beverage Retail Dairy Products Production General Food & Bev Products 6% Fertilizers Manufacturing 2% Meat and Seafood Processing General Food Production 3% Restaurants and Bars Poultry Products Processors 1% 4% Canned Food Production Other Food Production Other Food and Bev Services 2% Sweets and Snacks Production Non-Alcoholic Bev Production Other Services Alcoholic Beverage Production Chemical Flavor and Fragrance Tobacco Product Manufacturing Agrochemicals Manufacturing Nutritional Health Pharmaceuticals 5% 14% 1% 8% 5% 5% 4% 4% 4% 3% 3% 3% 1% 2% 1% Impacts (transition risk) Supply chain cost impact Dependencies (physical risk) Demand shift (transition risk) Regulatory impact (transition risk) Reputational impact (transition risk) 1% -5% Ag Mach. Manufac. 0% Dairy Alt. Manufac. 191% Example Output - Translate drivers of risk into financial value at stake Subsector value impact across MSCI World Index agriculture, food and beverage companies
- 4. 4 Variation in company impacts can differ markedly within the same subsector, underscoring the need for company-specific analysis X%:Y% Impact range 1. A company may have revenue streams across multiple business units, hence there are more observations shown here than agricultural, food and beverage companies in the index. 2. PMP stands for products manufacturing and processing. 3. Filtered for outliers. Unmitigated losses greater than 50% and meat alternative profit increases are not shown here. 4. Bubble size is determined by weighted mkt cap in each company business unit, but it is not directly proportional. Each company is assigned to a decile between 1-10 to ensure visibility for smaller companies. mkt cap4 -50% -15% -30% 5% -25% 10% -45% -40% -35% -20% -10% -5% 0% 15% Other Food & Bev PMP Ag. Commodities Production Meat/Dairy Alternatives PMP Livestock and Dairy Retail, restaurants & bars Livestock and Dairy PMP Agricultural inputs Other Unmitigated change in NPV by company business unit123, % change relative to baseline, GBF-Aligned Scenario, 2020-2030 -231%:0% -48%:-25% -15%:0% -9%:-3% +19:+185% -28%:-2% -34%:+1% -6%:0% Additional impacts Additional impacts Additional impacts Preliminary results Company-level value impact for the MSCI World Index agriculture, food and beverage companies
- 5. 5 Understanding options for response can help make the case for early action to mitigate risk exposure 5% -20% -25% 0% -15% -30% -10% -5% 10% Restaurants and food service Agricultural inputs Food retailers Agricultural products/ commodities Animal proteins Food and beverage manufacturers/processors NB: Company-sector averages differ from sector averages shown previously because companies often derive revenue from sources beyond their sector of classification. Company result Company-sector average Company result Company-sector average Unmitigated With response Estimated change in NPV from 2020-2030, by company, % change -26%:+4% X%:Y% Impact range -22%:+1% -7%:+6% -6%:+2% -12%:+0% -7%:+0%