Transition cow
•
0 likes•268 views

Dr-M.Muneeb

Recommended
Recommended
More Related Content
What's hot
What's hot (20)
Similar to Transition cow
Similar to Transition cow (20)
Recently uploaded
Recently uploaded (20)
Transition cow
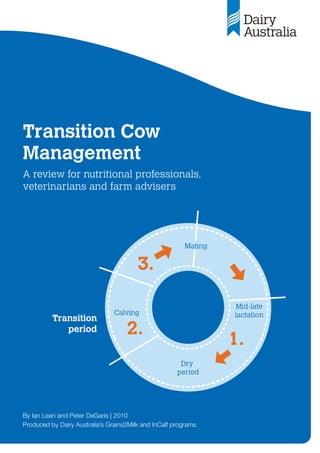
- 1. Transition Cow Management A review for nutritional professionals, veterinarians and farm advisers Dry period Mid-late lactation Calving Mating Transition period By Ian Lean and Peter DeGaris | 2010 Produced by Dairy Australia’s Grains2Milk and InCalf programs
- 2. Publisher Dairy Australia Authors Ian Lean and Peter DeGaris Editors Steve Little and John Penry Thanks to Barry Zimmermann, Tim Harrington, Ian Sawyer and Joanne Campbell for their editorial assistance. This review was commissioned by Dairy Australia’s Grains2Milk and InCalf programs. For further information, please contact: enquiries@dairyaustralia.com.au | Tel: 03 9694 3777 Disclaimer Whilst all reasonable efforts have been taken to ensure the accuracy of Transition Cow Management – A review for nutritional professionals, veterinarians and farm advisers, use of the information contained herein is at one’s own risk. To the fullest extent permitted by Australian law, Dairy Australia disclaims all liability for any losses, costs, damages and the like sustained or incurred as a result of the use of or reliance upon the information contained herein, including, without limitation, liability stemming from reliance upon any part which may contain inadvertent errors, whether typographical or otherwise, or omissions of any kind. © Dairy Australia Limited 2016. All rights reserved. ISBN 978-0-9581814-9-5 Reprinted 2016
- 3. 1 Transition Cow Management: Ian Lean and Peter DeGaris A review for nutritional professionals, veterinarians and farm advisers Section 1: Introduction Table of contents Foreword ...................................................................... 3 1. The transition period............................................ 5 The transition period and its importance ................................... 5 All metabolic processes are intricately linked ........................... 5 Adaptive hormonal changes to lactation .................................... 6 Aims of transition ...................................................................................... 6 Benefits of an integrated approach to transition nutrition . 6 Potential risks from improving transition cow nutrition? ... 8 Managing the post-calving transition period ........................... 9 2. Establishing successful lactations ................ 11 Rumen adaptation ................................................................................ 11 Dry matter intake ................................................................................... 12 Demand for calcium ............................................................................. 13 Lipid mobilisation and impact on liver function .................. 14 Demands of foetus and udder for nutrients ........................... 14 3. Components of a fully integrated ................ 15 transition diet Energy and protein ............................................................................... 15 Macrominerals and Dietary Cation Anion ................................ 18 Difference (DCAD) Microminerals .......................................................................................... 18 Rumen modifiers .................................................................................... 18 Buffers and other possible additives ........................................... 19 4. Milk fever – pathophysiology and control .... 21 Milk fever – a gateway disease........................................................ 21 Age and breed ......................................................................................... 22 Calcium ........................................................................................................ 22 Magnesium ................................................................................................ 23 Phosphorus ............................................................................................... 23 Dietary Cation Anion Difference (DCAD) .................................. 23 Physiology of DCAD theory of milk fever control ....................... 24 Use of urine pH to monitor efficacy of acidification ................. 25 DCAD equations .................................................................................... 26 Calcium ..................................................................................................... 27 Magnesium .............................................................................................. 27 Phosphorus .............................................................................................. 28 Length of exposure ................................................................................ 28 5. Approaches to transition feeding .................... 33 Other approaches to transition feeding ................................... 35 Energy intake restrictions .................................................................... 35 Vitamin D .................................................................................................. 35 Hydrochloric acid to reduce DCAD ................................................. 35 Calcium drenches at calving ............................................................. 35 Partial budgets ........................................................................................ 36 Assumptions used in these partial budgets ................................. 37 Appendices .............................................................. 39 A. Causes of lameness ......................................................................... 39 B. Hormones involved in establishing lactation ................... 41 C. Guidelines for formulating transition diets ........................ 43 Definition of terms ................................................. 45 References ................................................................ 47
- 4. 2 Transition Cow Management: A review for nutritional professionals, veterinarians and farm advisers Ian Lean and Peter DeGaris
- 5. 3 Transition Cow Management: Ian Lean and Peter DeGaris A review for nutritional professionals, veterinarians and farm advisers Section 1: Introduction Foreword Transition cow management has been one of the most significant advances in dairy nutrition and production world-wide over the past 20 years, providing a major opportunity to improve cow health, milk production and reproductive performance. While a substantial number of Australian dairy farmers have implemented successful transition feeding programs pre-calving, reporting dramatic reductions in milk fever and other cow health problems around calving, and improvements in milk production and fertility, many other farmers are yet to do so. In response to this, Dairy Australia’s Grains2Milk and InCalf programs have joined together to support the adoption of effective transition cow management programs across the Australian dairy industry. There have been major advances in understanding the needs of the transition cow and the use of transition feeding programs pre-calving in just the past few years. Given this, we felt that the first thing needed was an extensive technical review on transition cow management. Dr Ian Lean (SBScibus) and Dr Peter DeGaris (Tarwin Veterinary Group) were well-positioned to conduct this review for Grains2Milk and InCalf. Ian has published more peer-reviewed papers on transition feeding than any other Australian, and Peter has recently completed his PhD at University of Sydney on transition cow management. The result is this publication, which is the most extensive review of transition cow management ever undertaken, drawing on more than 300 peer-reviewed scientific papers. It provides an up-to-date technical resource for nutritional professionals, veterinarians and farm advisers on the many aspects of transition cow management, and serves as the technical foundation for additional adviser and farmer information resources being developed by Grains2Milk and InCalf. We trust that you find this review a valuable technical resource. Steve Little and Barry Zimmermann (on behalf of Dairy Australia’s Grains2Milk and InCalf programs)
- 6. 4 Transition Cow Management: A review for nutritional professionals, veterinarians and farm advisers Ian Lean and Peter DeGaris 4 4
- 7. 5 Transition Cow Management: Ian Lean and Peter DeGaris A review for nutritional professionals, veterinarians and farm advisers Section 1 The transition period The transition period and its importance The periparturient or transition period is defined as the four weeks before and after calving, and is characterised by greatly increased risk of disease (Curtis et al. 1985; Shanks 1981; Stevenson and Lean 1998). This period is dominated by a series of adaptations to the demands of lactation, a type process termed ‘homeorhetic’(Bauman and Currie 1980). Homeorhetic processes are the long -term adaptations to a change in state, such as from being non-lactating to lactating, and involve an orchestrated series of changes in metabolism that allow an animal to adapt to the challenges of the altered state. Diseases that result from disordered homeorhetic change reflect disorders in homeostasis, in other words, these are failures to adapt that result in shortages of nutrients that are vital for existence. These conditions are often inter-related (Curtis et al. 1983; Curtis et al. 1985; Curtis 1997) and include: • hypocalcaemia and downer cows; • hypomagnesaemia; • ketosis and fatty liver; • udder oedema; • abomasal displacement; • RFM/metritis; and • poor fertility and poor production. All metabolic processes are intricately linked While there has been, in the past, a tendency to look at metabolic systems in isolation, all metabolic processes are intricately linked. This concept reflects a need for effective homeostatic control of metabolism. A failure of one metabolic process will inevitably impact on the efficiency others. As research progresses, intricate homeostatic links between metabolic processes once thought to be distant and unrelated are continually uncovered. As a result of the increased understanding of homeostatic processes, the concept of transition feeding has evolved from one focused on only control of milk fever to an integrated nutritional approach that optimises: • rumen function; • calcium and bone metabolism; • energy metabolism; • protein metabolism; and • immune function. While addressing any one of these areas in isolation will be of some benefit, developing integrated nutritional strategies based on an understanding of the homoeostatic and homeorhetic processes involved in the transition from a non-lactating to lactating animal will have substantial benefits. Grummer (1995) stated that “If transition feeding is important, then perturbations in nutrition during this period should affect lactation, health and reproductive performance.” There is now a substantial body of evidence clearly confirming
- 8. 6 Transition Cow Management: A review for nutritional professionals, veterinarians and farm advisers Ian Lean and Peter DeGaris that the transition period represents a brief but critically important period of time in a cow’s life where careful manipulation of diet can impact substantially on subsequent health and productivity. Adaptive hormonal changes to lactation Changes in hormone metabolism before calving have been well described (Bauman and Currie 1980; Bell 1995). Bauman and Currie (1980) noted the following adaptive changes to lactation: • increased lipolysis (breakdown of fats); • decreased lipogenesis (fat synthesis); • increased gluconeogenesis (glucose synthesis); • increased glycogenolysis (breakdown of glycogen to provide energy); • increased use of lipids and decreased glucose use as an energy source; • increased mobilisation of protein reserves; • increased absorption of minerals and mobilisation of mineral reserves; and • increased food consumption and increased absorptive capacity for nutrients. The following hormones influence the initiation of lactation and are associated with profound changes in metabolism: • progesterone and oestrogens; • prolactin and placental lactogen; • insulin and glucagon; • somatotropin; • thyroid hormone; and • glucorticoids. Some of these changes are illustrated in Figure 1. For further details about how hormones influence the initiation of lactation and are associated with profound changes in metabolism, go to Appendix B. Aims of transition There are four aims of transition cow management. Cows should be managed so as to: • reduce ruminal disruption; • minimise macromineral deficiencies (conditioned or otherwise); • minimise lipid mobilisation disorders; and • avoid immune suppression. If the four aims are addressed during the transition period, and a successful lactation is established, the targets for cow health problems in Table 2 should be achievable. For further details on different causes of lameness, go to Appendix A. Benefits of an integrated approach to transition nutrition Establishing a successful lactation means much more than delivering a live calf. It also means: • a cow with a rumen well adapted to higher energy feeds; • almost no clinical cases of milk fever in the herd; • very low incidence of other cow health problems common in the first two weeks after calving; • low culling and death rates in the first two weeks; • higher herd fertility; • more productive lactations; • less labour and stress from time spent on sick cows; and • enhanced animal welfare. ! Transition feeding has evolved from a focus on milk fever control to an integrated nutritional approach. Figure 1: Changes in hormone concentrations around calving. 0 10 20 30 40 50 60 70 80 90 100 -25 -20 -15 -10 -5 0 5 10 15 PGs Estradiol Prolactin Progesterone Somatotropin Days relative to calving
- 9. 7 Transition Cow Management: Ian Lean and Peter DeGaris A review for nutritional professionals, veterinarians and farm advisers Condition Details Reduce ruminal disruption Milking cows are very vulnerable to lactic acidosis and sub-acute ruminal acidosis (SARA) resulting from suppressed appetite and rapid introduction of grains/ concentrates. Minimise macromineral deficiencies Mainly refers to calcium, magnesium and phosphorus. Milk fever and grass tetany (hypomagnesaemia) can result from a conditioned deficiency where excess potassium reduces the capacity of the cow to maintain stable blood concentrations of calcium and magnesium. Minimise lipid mobilisation disorders Includes ketosis, fatty liver and pregnancy toxaemia; diseases that are largely influenced by a failure to provide sufficient or effective energy sources around calving. Avoid immune suppression Often associated with lack of energy or protein intake – micronutrients are often involved, including copper, selenium, zinc, iodine, vitamin E and vitamin D. Table 1: Aims of an integrated approach to transition nutrition. Health problem Target Seek help if Milk fever 1% (old cows >8yrs: 2%) >3% Clinical ketosis <1% >2% Abomasal displacements (left or right) <1% >2% Clinical mastitis <5 cases / 100 cows / first 30 days >5 cases / 100 cows / first 30 days Lameness (Sprecher locomotion scale 1-5) <2% with > Score 2 >4% with > Score 2 Hypomagnesaemia (Grass Tetany) 0% 1 case Retained placenta >24 hrs after calving <4% >6% Vaginal discharge after 14 days <3% >10% Calvings requiring assistance <2% >3% Clinical acidosis 0% 1% * Based on the following data sets: Morton, Curtis, Beckett, Moss, Stevenson. Table 2: Achievable targets for cow health problems (expressed as percentage of cases of calving cows within 14 days of calving). In adult dairy cattle, 80% of disease costs occur in the first four weeks after calving. This is also a peak period for involuntary culls and deaths. Stevenson and Lean 1998 showed that 4% of animals are removed in the first 10 days of lactation. Unless calves complete their second lactation they have not covered their rearing costs. A study of New Zealand herds by LIC in 2003 showed that an average 20% of heifers that entered the milking herd were culled before they commenced their second lactation. While no similar Australian data are available, we would expect similar results for Australian herds. Survival and culling rates for NZ dairy herd model Age (years) Ll herd profile (% of herd) Survival rates Culling rate 2 19% 95% 20% 3 16% 95% 10% 4 15% 95% 5% 5 13% 95% 5% 6 11% 95% 5% 7 8% 93% 10% 8 6% 90% 30% 9 5% 90% 50% 10+ 7% 90% 100%
- 10. 8 Transition Cow Management: A review for nutritional professionals, veterinarians and farm advisers Ian Lean and Peter DeGaris Potential risks from improving transition cow nutrition? There is some evidence that transition cow nutrition increases the risk of mastitis. It has also been suggested that transition cow nutrition may impact negatively on colostrum quality, calf birth weight and dystocia. However, these concerns are far outweighed by the benefits of an integrated approach to transition cow nutrition. One study (DeGaris et al. 2009) has shown there is an increased risk of clinical mastitis in the first 180 days of lactation with increasing time spent on a transition diet formulated to deliver an positive energy and protein balance. It is likely this increase in risk is associated with increased milk production and is analogous to the increased risk of mastitis seen with increased milk production associated with genetic merit (Koivula et al. 2005) or bovine somatotrophin administration (Dohoo et al. 2003). There is anecdotal evidence that feeding transition diets may increase the risk of milk leaking pre-calving and increase the risk of peri-partum mastitis. Milking cows that develop marked ventral udder oedema or leak milk appears to address this problem. These cows have completed their transition and calves born need to receive colostrum from another cow. However, the appropriate application of transition diets can allow pasture grazing and fresh clean areas to calve in. All transition cows should calve in clean, dry areas/facilities to reduce the risks of environmental mastitis and calf exposure to pathogens. It is possible that transition cow nutrition could influence colostrum quality. Studies in beef cattle have shown that pre-calving protein nutrition does not affect colostral IgG concentration (Belcha et al. 1981; Burton et al. 1984; Hough et al. 1990) but pre-partum diets low in protein and energy may result in reduced calf absorption of immunoglobulins (Burton et al. 1984; Hough et al. 1990). Other studies have reported no effect of pre-calving nutrient restriction on the absorption of colostral immunoglobulins (Fishwick and Clifford 1975; Halliday et al. 1978; Olsen et al. 1981a; Olsen et al. 1981b). However, the volume of colostrum produced at the first milking is negatively correlated with IgG concentration (Pritchett et al. 1991). Anecdotal evidence suggests the volume of first milking colostrum is increased in cows fed well-formulated transition diets and it is possible that immunoglobulin concentration is negatively affected through dilution. Joyce and Sanchez (1994) highlighted the possibility that cows fed a low DCAD diet pre-calving may deliver calves that are more severely metabolically acidotic for longer and that this may reduce absorption of colostral immunoglobulins. However, Tucker et al. (1992) failed to demonstrate an effect of DCAD on the acquisition of passive immunity. The impact of pre-calving nutrition on calf birth weight and dystocia is again an area requiring further investigation with most studies examining the effects of inadequate or restricted nutrition on birth weight. While a few studies have shown a negative effect of nutrient restriction on calf birth weight (Corah et al. 1975) and/or a positive relationship between pre- calving nutrition and calf birth weight (Boyd et al. 1987), the vast majority have failed to show any effect (Anthony et al. 1986; Carstens et al. 1987; Ferrell et al. 1976; Martin et al. 2007; Prior and Laster 1979; Stalker et al. 2006). ! If transition cows start leaking milk prior to calving, they should be milked. Their calf should be fed colostrum from another cow. ! The relationship between transition feeding and calf birth weight requires further investigation. ! Transition feeding may increase the risk of mastitis. However, this risk can easily be minimised through use of a teat sealant with or without dry cow therapy at drying-off.
- 11. 9 Transition Cow Management: Ian Lean and Peter DeGaris A review for nutritional professionals, veterinarians and farm advisers Managing the post-calving transition period While the focus of transition management of the dairy cow tends to be on the pre-calving period, the transition period extends to the first four weeks of lactation. While a detailed discussion on the nutritional requirements of the dairy cow during this period is beyond the scope of this review, the nutrition and management of the post-calving transition cow is of equal importance as that of the pre-calving transition cow. During this period there is substantial up regulation of all metabolic processes that drive continued udder development, recovery of appetite and immune function and the resumption of reproductive activity. All the concepts of sound nutrition that are important in the pre-calving transition period are equally important in the post-calving transition period. Continued ruminal adaptation to high concentrate diets is critical to control the risk of sub-acute ruminal acidosis (SARA) and lactic acidosis, careful attention to macro and micro mineral metabolism, as well as energy and protein metabolism, is essential for a successful lactation. Again, the concepts of homeostatic and homeorhetic change are crucial. Failure to adequately support one area of metabolism will inevitably impact negatively on other metabolic processes. Careful attention to minimise the depth and length of negative energy and protein balance are equally as important as the provision of adequate calcium, magnesium and phosphorus. Please note: Section 2 and onwards of this review focus on the pre-calving transition period.
- 12. 10 Transition Cow Management: A review for nutritional professionals, veterinarians and farm advisers Ian Lean and Peter DeGaris
- 13. 11 Transition Cow Management: Ian Lean and Peter DeGaris A review for nutritional professionals, veterinarians and farm advisers The key to establishing successful lactations lies in overcoming five main challenges: • rumen adaptation; • reduced dry matter intake; • higher demands for calcium; • impact of lipid mobilisation on liver function; and • demands of the foetus and udder for nutrients. An integrated approach to managing transition cows is needed if these challenges are to be dealt with effectively. Rumen adaptation Despite recent changes in management to provide more energy dense rations in the transition period, dry cow rations will continue to have a lower energy density than lactating cow rations and a lower content of fermentable carbohydrate, even in pasture-dominant feeding systems. There is evidence that part of the adaptive process in the rumen involves the elongation of ruminal papillae and an increase in absorptive area of the papillae (Dirksen et al. 1985). Further, there is a need to allow rumen microbial populations to form a stable ecosystem based on greater activity of amylolytic, that is starch-utilising bacteria. These bacteria, which include Streptococcus bovis and Lactobacillus spp., produce lactic acid, a strong acid which can markedly lower rumen pH. Lactic acid- utilising bacteria, including Megasphera elsdenii, Selenomonas ruminatum and Vionella spp, produce propionate from lactate, thereby moderating the effects of starch feeding on rumen pH. A failure to successfully adapt rumen physiology to diets higher in starch places the cow at risk of sub-acute ruminal acidosis (SARA) and lactic acidosis. It has been suggested that the lower absorptive area of ruminal epithelium may reduce the rate of absorption of volatile fatty acids and lactic acid from the rumen. ! Changes to rumen microbial populations are quite rapid (7 to 10 days). Full development of ruminal papillae takes longer (3 to 6 weeks). Section 2 Establishing successful lactations Ruminal papillae before adaptation. Photographs courtesy of Veterinary Pathology Unit at the University of Melbourne. Ruminal papillae hypertrophy after adaptation.
- 14. 12 Transition Cow Management: A review for nutritional professionals, veterinarians and farm advisers Ian Lean and Peter DeGaris Figure 2: Energy pathways. Tarwin Veterinary Group Blood glucose Adipose Tissue Peripheral Tissues NEFAs Ketogenesis Gluconeogenesis Propionic acid Amino Acids Ketones + + LIVER Increased glucose availability Decreased glucose utilisation Rumen Microbial CP Lipoproteins (Goff and Horst 1997). A rumen pH of less than 6.0 does not favour fibre digestion and DMI is lower in subclinical acidosis. Grummer (1997) used corn to increase the starch and non- fibre carbohydrates in a pre-calving diet. The energy density increase from 9.2MJ of ME per kg to 11.2MJ of ME per kg was associated with a significant 2.4 litre per cow per day increase in milk production after calving, lower ketone concentrations and a lower liver triglyceride: glycogen ratio. This finding indicates that the adaptation of cattle to diets of higher energy content before calving may have production benefits after calving. Dry matter intake The periparturient disease conditions are associated with decreased dry matter intake (DMI), and feed intake is a critical determinant of health and productivity in the dry period. Feed intake and nutrient density of the diet determine the availability of nutrients to the cow and rapidly developing foetus. Grant and Albright (1996) reviewed the feeding behaviour and management factors during the transition period for dairy cattle and found that feed intake decreased by up to 30% during the week before calving. Factors that influence feed intake include social dominance, digestibility of the diet, access to feed and the palatability of the feed (Grant and Albright 1996). An Australian study that measured daily feed intakes of dry cows well fed on poor quality hay and a total mixed ration (TMR) found that intakes of the hay diet declined over the three weeks before calving while intakes of TMR remaining relatively constant until just before calving. The total DMI over the transition period was also higher for the TMR than the hay based diet (Stockdale 2007). Cows are relatively insensitive to insulin around the time of calving and have relatively low concentrations of insulin at this time, helping maintain a constant blood glucose level despite declining feed intake in the last week or so before calving. This is because utilisation of glucose by tissues decreases, while utilisation of energy sources derived from lipids by muscle increases, sparing glucose. This signals an increase in the rate of mobilisation of body fat stores to support lactation. This has implications for health and fertility as excessive mobilisation of tissue increases the risk of diseases such as ketosis, uterine infections and fatty liver. It has been suggested that control of feed intake is mediated in part through oxidation of propionate in the liver, resulting in greater satiety (Allen et al. 2009). Consequently, fats and less fermentable carbohydrates sources may be important to use in early lactation. ! Blood insulin levels and sensitivity of tissues to insulin are low around time of calving. In response to this, the cow mobilises body fat stores, producing NEFAs.
- 15. 13 Transition Cow Management: Ian Lean and Peter DeGaris A review for nutritional professionals, veterinarians and farm advisers Cows and sheep in higher body condition scores have lower dry matter intakes after parturition (Garnsworthy and Topps 1982) and (Cowan et al. 1980) and lower dry matter intake has been noted immediately after calving (Lean et al. 1994) and before calving (Lean et al. unpublished) for cows with clinical ketosis. Heavily conditioned cattle can have markedly lower dry matter intakes and this is noted especially in cattle with greater than BCS>3.5/5 (greater than six on the one to eight scale). More obese animals are at greater risk of milk fever (Stockdale 2007). However, providing access to feed for more than eight hours per day and maintaining adequate availability and nutrient density of feed, controlling dominance behaviour by grouping and providing adequate feed access and controlling body condition to an ideal of approximately 3.5 on the five-point scale (Edmondson et al. 1989) or 5.5 on the one to eight scalewill reduce the risk of inadequate nutrient intake. In particular, the use of more digestible forages with lower slowly digestible fibre content will allow greater DMI. The effect of greater dry matter intake was demonstrated by the force feeding through a ruminal fistula of periparturient cows (Bertics et al. 1992). Cows that received more feed had less hepatic lipid accumulation and higher milk production after calving. The higher milk production resulted from greater post-calving feed intake and a highly significant positive correlation between pre- and post-calving feed intake was identified (Bertics et al. 1992). Demand for calcium Changes in calcium metabolism induced by lactation are more significant than parturition per se to the pathogenesis of parturient paresis (clinical milk fever), as the loss of blood calcium to milk may exceed 50g per day. Before calving, the daily requirement for calcium is only approximately 30g; 15g in faecal and urinary loss and 15g to foetal growth. This demand for calcium may only be satisfied by increased absorption from the rumen or intestines, and increased mobilisation from tissue, especially bone reserves of calcium, as circulating blood calcium reserves are limited. Most cows have some degree of hypocalcaemia at calving. Blood calcium is maintained within a narrow range (2.0-2.5mmol/L). Cows can only afford to lose approximately 50% of circulating blood calcium reserves before a hypocalcaemic crisis is precipitated. The amount of calcium available from bone deposits is limited. Therefore, increased absorption of calcium from the gut is critical to maintaining blood calcium. For further information about calcium metabolism, go to Section 4, beginning on page 21. ! The onset of lactation increases the cow’s daily calcium requirement by 2-4 fold. The skeleton contains around 98% of total body calcium and calcium pools are under strict homeostatic control. There is around 3g Ca in the plasma pool and only 8-9 g Ca in compartments outside the bone of a 600kg cow. At parturition there is a sudden increase in the cow’s calcium requirements for colostrum (2-3g Ca/L) and milk (1.22-1.45g Ca/L) requiring a 2-4 fold increase in calcium availability. This comes from the calcium mobilised from bone storage and an increased rate of dietary Ca absorption. Calcium requirements post calving
- 16. 14 Transition Cow Management: A review for nutritional professionals, veterinarians and farm advisers Ian Lean and Peter DeGaris Lipid mobilisation and impact on liver function Ruminants are adapted to manage periods of poor-quality feed intake or a lack of feed intake. Part of the adaptation is to be in a state where body tissue reserves of protein or fats can be mobilised in support of the foetus and milk production. Overton (2001) examined the effects of lipid mobilisation on liver function. Increased tissue mobilisation increases the flow of free fatty acids to the liver for oxidation and increases the need to export some of these back to peripheral tissues as ketones. The liver may not be able to re-export sufficient of these and accumulates fat in hepatocytes. The implications of this accumulation are that both rates of gluconeogenesis and ureagenesis may be impaired (Strang et al. 1998). Strang et al. (1998) found that hepatic ureagenesis was reduced 40% through exposure of liver cells to free fatty acids that resulted in increased triglyceride accumulation similar to that of cows after calving. Figure 3: Uptake of nutrients – foetus vs mammary gland (from Bell 1995). 0 1000 2000 Uptake g/day Glucose Amino Acids Fatty acids Calcium X10 Uterus Udder Demands of foetus and udder for nutrients Bell (1995) reviewed a number of studies from Cornell University in which the nutrient demands of the foetus in late gestation were examined. It is clear from these studies that the foetal requirements for energy, while modest, are demanding in that the requirement for glucose is four times greater than that for acetate. This demand highlights problems with the low energy density of dry cow diets recommended by NRC (1989). The foetus has an a priori demand for glucose over the dam (Stephenson et al. 1997). The foetus also has significant requirements for amino acids, which are used for tissue deposition and oxidation. The foetal requirement for amino acids appears to be three times greater than the net requirement for foetal growth (Bell 1995) due to significant oxidation of amino acids in the foetus. Figure 3 (left), derived from Bell (1995), shows that the demand for nutrients to support lactation increases markedly at the onset of lactation. It is not unusual for cattle to produce a kilogram of fat, nearly a kilogram of protein and more than a kilogram of sugar (lactose) within a few days of calving. This represents an extraordinary feat of metabolic control.
- 17. 15 Transition Cow Management: Ian Lean and Peter DeGaris A review for nutritional professionals, veterinarians and farm advisers As discussed in Section 1, a diet that provides the transition cow with all the nutritional components necessary to support these intricately linked metabolic processes: • rumen function; • calcium and bone metabolism; • energy metabolism; • protein metabolism; and • immune function. as she adapts to lactation will have substantial health and productivity benefits. Components of an integrated transition diet to consider are: • energy and protein; • macrominerals and DCAD; • microminerals; • rumen modifiers; and • buffers and other possible additives. Energy and protein The demands for amino acids and glucose by the feto-placental unit, and amino acids, glucose and fatty acids by the mammary gland particularly during stage two lactogenesis (Bell 1995; Tucker 1985) combine with a lowered potential DM intake immediately before calving (Marquardt et al. 1977) to place the cow at great risk of mobilising significant amounts of body fat and protein. Estimated energy balance after calving improves with increasing the energy density of the pre- calving ration (Grum et al. 1996; Holcomb et al. 2001; Minor et al. 1998). These improvements have been associated with trends towards increased milk production, lowered milk fat percentage and significant increases in protein percentage and yield (Minor et al. 1998). The effect of increased energy density of the pre- calving diet, in particular increased fermentable carbohydrate concentration, may in part be mediated through increased development of rumen papillae in response to increased VFA production (Dirksen et al. 1985). The increased absorptive capacity of the rumen may have reduced the risk of VFA accumulation, depression of rumen pH and subsequent risk of sub-acute ruminal acidosis (SARA) and lactic acidosis in response to the feeding of high concentrate diets after calving (see Table 3 for more information about SARA and lactic acidosis). For every herd with clinical acidosis present, Bramley et al. (2008) found 10 herds with a very high prevalence of subclinical acidosis. For a full review of acidosis see Lean et al. (2007). Because adaptation and development of rumen papillae takes between three and six weeks (Kauffold et al. 1975; Dirksen et al. 1985), the benefit of increasing exposure to a pre-partum diet high in fermentable carbohydrate (i.e. starches and sugars) is likely to be curvilinear. There are also likely to be benefits associated with the pre-calving adaptation of the rumen microflora to post-calving diets high in concentrates (Curtis et al. 1985). Section 3 Components of an integrated transition diet
- 18. 16 Transition Cow Management: A review for nutritional professionals, veterinarians and farm advisers Ian Lean and Peter DeGaris Zhu et al. (2000) found that ammonia concentrations in blood doubled during the first two days after calving, when cows were fed a 21% CP diet after calving. For the pasture- based dairy production systems, these changes may have significant implications given the propensity not to feed cows well in the transition period and the very high pasture protein concentrations in late winter and early spring. Studies investigating optimal concentrations of dietary protein in pre-partum diets have focused on crude protein content (Greenfield et al. 2000; Huyler et al. 1999; Putnam and Varga 1998; Putnam et al. 1999), rumen degradable or rumen undegradable fractions in the diet (Greenfield et al. 2000; Huyler et al. 1999; Putnam et al. 1999; Wu et al. 1997), but have not considered in depth potential for ruminal microbial protein synthesis nor metabolisable protein balance. It has been suggested that by increasing pre-partum protein body tissue reserves, the transition cow will be better able to utilise these reserves after calving to support lactation and minimise metabolic disorders (Grummer 1995; van Saun 1991), an effect possibly mediated through increased labile protein reserves. However, a meta-analysis of the few data available from which to evaluate estimated pre-partum metabolisable protein balance and subsequent milk yields found no significant relationship (Lean et al. 2003). Nonetheless, pre-calving diets with positive metabolisable protein and metabolisable energy balances are attributes that may increase subsequent milk production by providing adequate substrate for foetal and mammary development. Similarly, increased BCS at calving, reflecting improved body tissue reserves, has increased subsequent milk production (Boisclair et al. 1986; Gainsworthy and Topps 1982). Body condition score at calving is a major determinant of the calving to first estrus interval, with cows in higher body condition displaying estrus earlier (Garnsworthy and Topps 1982). Westwood et al. (2002) identified a number of factors that significantly influenced the display of oestrus at first and second ovulation, and therefore the herd’s submission rate and in-calf rate. Higher body weight of cattle before calving and post calving appetite were significant factors that increased oestrus display. Measures of metabolites in blood that reflected a better energy balance, including cholesterol concentrations and the ratio of glucose: 3-hydroxybutyrate were also associated with greater display of oestrus at ovulation. The importance of mobilised tissue protein as a source of amino acids for mammary metabolism and gluconeogenesis may be small over the period from calving to peak lactation (Bauman and Elliot 1983) but may be important in the first one to two weeks immediately after calving (Reid et al. 1980), and decline in muscle ! Cows in higher body condition at calving have better reproductive performance. Condition Clinical signs Control measures Sub-acute ruminal acidosis (SARA): Is the accumulation of total VFAs in the rumen, especially propionate. Rumen pH: 6 to 5.5 Some cattle off feed, some evidence of lameness, reduced fibre digestion, mild milk fat depression, often good to excellent production, scouring can be present Look especially for evenness of access to pasture and other forages. Chop length of silage or hays should be more than 2.5cm. Check that very soluble sources of carbohydrate eg sugars are not in excess, nor feeds high in lactic acid eg wheys, corn silages esp corn earlage Lactic acidosis: Is the accumulation of lactate, a strong acid. Rumen pH < 5.5 Acutely sick cattle with rumens with low pH, off feed, low milk fat, high prevalence (more than 10% of cows) with lameness score >2, cattle die with liver or lung abscess, often see large amounts of unconsumed grain in bails, many cows scouring and scour contains large amounts of grain and bubbles, many cows not eating. Increase the effective fibre in the diet. This may involve reducing the amount of concentrate, slowing the pasture rotation, and feeding palatable fibre in the form of silage or hay. Consider using rumen buffers or modifiers. Ensure even access to forage so that all cows get fibre. Introduce grain and concentrates before calving. Table 3: Sub-acute ruminal acidosis (SARA) and lactic acidosis. ! If the transition diet consists of pasture / cereal hay / grain / concentrate there will probably be a need to supplement with additional protein meal (with the exception of BioChlor® and maybe SoyChlor®-based concentrate). Similarly, if a reasonable amount of protein meal is being fed to cows after calving, it should also be provided in the pre-calving diet.
- 19. 17 Transition Cow Management: Ian Lean and Peter DeGaris A review for nutritional professionals, veterinarians and farm advisers protein:DNA ratio in ewes during early lactation (Smith et al. 1981) support the concept that skeletal muscle is an important source of endogenous amino acids in early lactation. This hypothesis that improved protein and energy balance improved subsequent production is supported to some extent by the trend toward proportionally higher milk and protein yield in response to increasing days exposure to a pre-calving transition diet containing a protein meal containing anions such as BioChlor® in younger cows that are likely to have a greater energy and protein requirement to support growth (DeGaris, unpublished). The data on the effect of pre-partum protein levels on subsequent reproduction and health is scant. While many studies have examined the effect of varying protein fractions on subsequent lactation performance, the numbers involved preclude any meaningful analysis on the effect of such changes on reproduction. In addition, the fact that most studies have paid little attention to microbial crude protein yield or metabolisable protein balance (Lean et al. 2003) again limit their usefulness. Supporting this observation was the small meta analysis of Lean et al. (2003) showed no relationship between metabolisable protein yield and subsequent milk production. Synthesis of ruminal microbes requires energy from carbohydrates, co-factors (e.g. phosphorus, vitamins), ammonia and peptides, which are small chains of amino acids. Production of ruminal bacteria is stimulated by the presence of peptides. In studies conducted in fermenters, Lean et al. (2005) found a 16% increase in microbial protein production and 8% increased organic matter digestibility when BioChlor® (a protein meal containing anions) was added to the fermenters. Increased availability of bacterial protein could be a factor that influenced milk production and reproductive benefits observed by Degaris et al. (2009). The balance and ratios of specific absorbed amino acids are of importance to production (Rulquin and Verite 1993; Sniffen et al. 2001). Methionine and lysine are often considered the first rate limiting amino acids across a range of diets for dairy cows (NRC 2002). The pre- calving transition diets used in this trial were formulated to have a strongly positive absorbed amino acid balance and in particular a strongly positive methionine and lysine balance with a lysine:methionine ratio of approximately 3:1 (Rulquin and Verite 1993). The strongly positive methionine and lysine balance of the diets may also have had a sparing effect on choline which may be a limiting nutrient for milk production in high-yielding dairy cows (Erdman and Sharma 1991; Pinotti et al. 2002; Sharma and Erdman 1989). Choline and methionine metabolism are closely related and a significant percentage of methionine is used for choline synthesis (Emmanuel and Kennelley 1984). Choline and methionine are interchangeable with regard to their methyl donor functions. Betaine also acts as a methyl donor and could also have a similarly beneficial role. Methionine has an important role in the formation of very low density lipoproteins in cattle (Auboiron et al. 1995) which are necessary for the export of stored fat in the liver. While the feeding of fat supplements during the pre-partum and immediate post-partum period has not traditionally been recommended (Santos et al. 2003) due to the potential to reduce dry matter intakes, particularly in heifers (Hayirli et al. 2002), there have been several studies where potentially beneficial effects have been observed. These included a reduction in liver triglyceride accumulation (Selberg et al. 2002) and levels of NEFA (Doepel et al. 2002) in the immediate post-partum period and improved pregnancy rates in cows after day 110 of lactation (Frajblat 2000). There have also been other studies that showed no beneficial effects. The potential for any reduction in NEFA or liver triglyceride to be secondary to reduced dry matter intake during the pre-partum period means any benefits must be carefully weighed up against the detriment effect of reduced feed intake. It is possible that the form of fats may be important in modifying responses. Protected fats, that is fats that are not as available to ruminal modification, including calcium soaps and prills, may provide energy in forms that have less effect on feed intake and can provide specific fatty acids. Reviews by Thatcher et al. (2002, 2006), indicated that the effect of supplemental linoleic acid (C18:2) from oil seeds and CaLCFA on fertility varied significantly, but suggest that supply of linoleic acid (C18:2), linolenic acid (C18:3), eicosapentanoic acid (C20:5) and docosahexanoic aid (C22:6) in forms that reach the lower gut may have more profound effects on fertility. ! Methionine and lysine are the first two rate limiting amino acids in dairy cows. Methionine, choline and betaine act as methyl donors.
- 20. 18 Transition Cow Management: A review for nutritional professionals, veterinarians and farm advisers Ian Lean and Peter DeGaris Macrominerals and Dietary Cation Anion Difference The historic focus of milk fever prevention was on calcium intake. Gradually, understandings have emerged that calcium intake alone does not determine milk fever risk. In Section 4, the roles of macromineral nutrition are addressed, in particular the important roles of calcium, magnesium, phosphorus and dietary cation anion difference (DCAD) as determined by potassium, sodium, chloride and sulphur concentrations are evaluated. Microminerals Although trace mineral nutrition in dairy cattle is of importance and many trace minerals improve immune function (Gaylean et al. 1999), the capacity interactions with other dietary inputs and variation in individual animal requirements means that despite extensive study, there are still many areas that require clarification (Lean 1987). Of recent interest is the area of chromium metabolism (Cr). Chromium is an active component of glucose tolerance factor and may have an effect through increasing insulin sensitivity of certain tissues. While the results from studies examining Cr supplementation in dairy and beef cattle as well as sheep are inconsistent, dietary supplementation of Cr during times of stress may be of benefit. It has been proposed that Cr supplementation during the pre-calving period may reduce insulin resistance and subsequently decrease plasma NEFA, liver triglyceride levels and improve glucose tolerance, which may result in improved productivity in the post-calving period (Hayirli et al. 2001). Positive metabolic and production responses have been demonstrated in response to Cr supplementation pre-calving (Hayirli et al. 2001). Rumen modifiers Rumen modifiers act directly on rumen microbes, altering the balance between the different populations and the proportions of the volatile fatty acids (VFAs) they produce. As such, they play a part in adapting the rumen. Ionophore rumen modifiers include sodium monensin and lasalocid. Antibiotic rumen modifiers include virginiamycin and tylosin. ! Chromium may provide metabolic and production benefits by helping to increase insulin sensitivity of tissues. The effects of sodium monensin, e.g. Rumensin,® are primarily increased ruminal propionate balance, reflecting an increase in propionate producing bacteria compared to those producing formate, acetate, lactate and butyrate. There is a concomitant decrease in methane production and a sparing effect on ruminal protein digestion (Bergen and Bates 1984; Richardson et al. 1976; Russell and Strobel 1989; Van Nevel and Demeyer 1977). When administered to dairy cows pre-calving and continued through early lactation, sodium monensin improved indicators of energy balance both pre- (Duffield et al. 2003; Stephenson et al. 1997) and post-partum (Duffield et al. 1998; Green et al. 1999), with significant increases in subsequent milk yield (Beckett et al. 1998; Duffield et al. 1999a). However, when the effect of monensin fed pre-partum is isolated from that of post-partum treatment there appears to be minimal improvements in milk yield, fat and protein percentages or yields (Juchem et al. 2004; Vallimont et al. 2001). No studies have examined the effect of duration of exposure of the pre- partum cow to monensin on either measures of energy balance, production or disease prevalence. Virginiamycin,* e.g. Eskalin,® reduces lactic acid production in vitro (Nagaraja et al. 1987) and the potential for lactic acid accumulation in vivo (Clayton et al. 1999). These effects are probably meditated through selective inhibition of Lactobacillus spp. and Streptococcus bovis. There is a potential for lactic acid accumulation when there is an abrupt increase in concentrate feeding, as often occurs around calving. Tylosin, e.g. Tylan,® has also been demonstrated to reduce lactic acid production in vitro (Nagaraja et al. 1987) and to control liver abscess in feed lot cattle, a likely sequelae of lactic acidosis (Nagaraja and Chengappa 1998). In dairy cattle, tylosin reduced ruminal accumulation of both D and L-lactate (Lean et al. 2000) and in combination with sodium monensin; tylosin was equivalent to virginiamycin in reducing lactic acid production in vitro (Nagaraja et al. 1987). In vivo, monensin and tylosin in combination significantly increased total ruminal volatile fatty acid production (Lean et al. 2000). ! If a rumen modifier is used in the lactation diet, the same rumen modifier should be used in the transition diet pre-calving. * Virginiamycin is only available with a medicated feed order provided by a veterinarian.
- 21. 19 Transition Cow Management: Ian Lean and Peter DeGaris A review for nutritional professionals, veterinarians and farm advisers Buffers and other possible additives Controlling the risk of acidosis is critical, but buffering using sodium bicarbonate is contra- indicated because of the very high DCAD of the buffer. It is possible to use magnesium oxide to supply magnesium and to act as a neutralising agent. Low DCAD buffering agents may also have a role. One buffer available in Australia is derived from red seaweed (Acid Buf®). The inclusion rate of this product is around 40-80g/cow/day for transition period cows and it has demonstrated buffering capacity between pH 5-7. The DCAD of this product is close to neutral so it can be safely used in a transition ration. This product is 30% calcium and 6% magnesium. Most critically, it is generally unnecessary to have a diet high in risk for acidosis provided before calving. The buffers including sodium bicarbonate are suitable to be fed after calving. The rumen modifiers are fed before calving to gain specific benefits on metabolism, e.g. monensin, or to adapt the cow to these before feeding rates of grains increase after calving, e.g. virginiamycin or tylosin. Perennial ryegrasses may be high in the endophyte alkaloids ergovaline and lolitreme (and others). The presence of these alkaloids at elevated levels may have extensive effects on production, reproduction and health of dairy cattle (Lean 2005). While no studies have examined the effect of these alkaloids on cattle when fed specifically during the transition period, there are many potential pathways whereby a negative effect on subsequent productivity may be exerted. Random surveys of pastures in south-west Victoria has demonstrated levels of alkaloids in excess of those required to cause disease in cattle in approximately 30% of samples (Reed 2005). Of the many other mycotoxins that exist, zearalenone has recently gained some notoriety. Zearalenone has been demonstrated to have serious effects on the fertility of sheep in New Zealand (di Menna et al. 1987). Similar observations have been made in Australia (D. Moore – personal communication) and the effect of zearalenone and other mycotoxins Nutrient Total diet analysis (dry matter basis) Far-off dry cows (More than four weeks pre-calving) Transition cows (Last four weeks pre-calving) Fresh cows (first four weeks post-calving) Neutral Detergent Fibre % (NDF) > 36% >36% >32% Physically effective NDF % 30% 25-30% >19% Crude protein (CP) % >12% 14-16% 16-19% Degradability of CP 80% 65-70% 65-70% Metabolisable energy intake per day (MJ) 90-100 100-120 160 Estimated energy density (MJ ME / kg DM) 10 (9)* 11 11.5-12 Starch % Up to 18% 18-22 22-24 Sugar % Up to 4% 4-6 6-8 Fat % 3% 4-5% 4-5% Calcium % 0.4% 0.4 to 0.6% 0.8 to 1.0% Phosphorus % 0.25% 0.25 to 0.4% 0.4% Magnesium % 0.3% 0.45% 0.3% DCAD^ Meq/kg <150 <80 >250 Selenium mg/kg 0.3 0.3 0.3 Copper mg/kg 10 15 20 Cobalt mg/kg 0.11 0.11 0.11 Zinc mg/kg 40 48 48 Manganese mg/kg 12 15 15 Iodine mg/kg 0.6 0.6 0.6 Vitamin A iu/g 2000 3200 3200 Vitamin D iu/g 1000 # 1000 Vitamin E iu/g 15 30# 15 *Energy content that is desirable will vary with body condition ^ See Section 4 for details # Vitamin D and E concentrations in the transition period are yet to be determined. Vitamin D inputs, in particular, will be determined by new understandings of the use of this vitamin to prevent milk fever. Table 4: Recommendations for far-off, transition and fresh cow diets. Table 4 provides nutritional recommendations for an fully integrated transition diet pre-calving, in addition to recommendations for the preceeding far-off dry cow diet and the subsequent fresh cow diet fed after calving. on animal health may have been substantially underestimated in the past. Effective mycotoxins binders are readily available and may be an important component of the pre-calving diet in some specific circumstances. However, documented evidence of the effectiveness of some products ability to bind specific mycotoxins is lacking.
- 22. 20 Transition Cow Management: A review for nutritional professionals, veterinarians and farm advisers Ian Lean and Peter DeGaris
- 23. 21 Transition Cow Management: Ian Lean and Peter DeGaris A review for nutritional professionals, veterinarians and farm advisers Milk fever – a gateway disease Milk fever risk is predicated from dietary levels of calcium, magnesium, phosphorus and DCAD, age and breed of cattle, and duration of exposure to the pre-calving transition diet. Ignoring any of these areas could lead to poor results. Milk fever or parturient paresis is a clinical manifestation of hypocalcaemia, a condition that affects most cows after calving. Hypocalcaemia has been arbitrarily defined as a blood concentration <2.0 mmol/L. Hypocalcemia (milk fever) is often referred to as a‘gateway’disease with many potential flow-on effects that increase the risk of other diseases, including mastitis, ketosis, retained placenta, displaced abomasum and uterine prolapse. (Figure 4). Hypocalcaemia is also a risk factor for reproductive disorders and is an indirect risk factor for increased culling. These are primarily mediated through reduced smooth muscle contractility and a direct negative effect of hypocalcaemia on the function of the immune system. The negative effects of hypocalcemia on smooth muscle contractility were demonstrated by (Jorgensen et al. 1998) when they artificially induced progressively severe hypocalcemia in cows via the intravenous infusion of EDTA (a potent calcium binder) while monitoring rumen contractility. Figure 5 shows the significant reduction of rumen contractility with even mild subclinical hypocalcaemia (0.78 mmol/L ionised calcium). Similarly, reduced uterine contractility associated with hypocalcaemia after calving can be associated with an increased risk of retained foetal membranes, as demonstrated by Melendez et al. (2004). The depression of the immune system around calving is well recognised (Goff and Horst 1997) and is more severe in cows with milk fever (Curtis et al. 1983). Calcium is essential for the activation of neutrophils. Figure 6 shows the high per cent of neutrophils phagocytosing fluorescent particles in cows with normal blood calcium versus cows with low blood calcium. The effects of reduced immune function have flow on effects for the risk of mastitis, metritis and reproductive functions (Ducusin et al. 2003). Milk fever and hypocalcaemia are not solely related to calcium concentrations in feed. These are influenced by other minerals, age, breed, protein content of the diet and other factors (De Garis and Lean 2008). ! The freshly calved cow exports milk containing approximately 10 times its circulating blood calcium pool every day. Section 4 Milk fever – pathophysiology and control Figure 4: Hypocalcaemia – a ‘gateway’ disease. Hypocalcaemia ↓ Smooth muscle function ↓ Rumen and GIT motility ↓ Immune function ↓ Uterine motility ↓ Teat sphincter contraction ↓ Feed Intake ↓ Energy balance ↓ Rumen fill ↑ Ketosis ↑ Fatty liver ↓ Reproduction ↑ Displaced abomasum ↓ Milk Yield ↑ Dystocia ↑ RFM ↓ Uterine involution ↑ Metritis ↓ Reproduction ↑ Mastitis ! For every case of clinical milk fever, there may be eight or more cases of sub-clinical disease.
- 24. 22 Transition Cow Management: A review for nutritional professionals, veterinarians and farm advisers Ian Lean and Peter DeGaris Figure 5: Hypocalcemia (ionized Ca) and rumen motility (Extracted from Jorgenson et al., 1998). Figure 6: Phagocytosis index and blood calcium (Adapted from Ducuscin et al., 2003). Phagocytosis index % Plasma ionized calcium (mmol/L) Hypocalcaemic Normal blood Ca 70 60 50 40 30 20 10 0 0 0.2 0.4 0.6 0.8 1 1.2 1.4 ▼ Age and breed ‘The higher susceptibility of the Channel Island breeds compared with Holsteins to hypocalcaemia is well established (Harris 1981) with Jerseys being roughly twice as susceptible to milk fever as Holsteins (Harris 1981; Lean et al. 2006). Older cows are at also greater risk of hypocalcaemia. This increased risk is associated with a decreased capacity to mobilise calcium from bone (van Mosel et al. 1993) and possibly a decreased number of 1,25 dihydroxy- cholecalciferol (1,25(OH)2 D3) receptors in the small intestine (Horst et al 1990). DeGaris and Lean (2008) found that the risk of milk fever increased by 9% per lactation in the sub- population of studies used for a meta-analysis (Lean et al., 2006) that reported age.’ Calcium Calcium is so essential to the function of the body that concentrations in blood must be kept within a tight range to ensure life. Consequently, the body has a finely tuned system of homeostasis to maintain concentrations in that range. Cows can only afford to lose approximately 50% of circulating blood calcium pool before a hypocalcaemic crisis is precipitated. Physiological controls over calcium homeostasis also include calcitonin, secretion of which is stimulated in response to elevated blood calcium concentrations. Parathyroid hormone (PTH) is released from the parathyroid glands in response to lowered blood calcium. When the amount of calcium coming into the digestive tract decreases, parathyroid hormone is released, stimulating the production of active vitamin D3 and absorption of more calcium from the gut. Parathyroid hormone plays a critical role in vitamin D metabolism. Parathyroid hormone is the main short-term regulator of Ca homeostasis. Although calcitonin does cause the concentration of Ca2+ in blood to fall, the effect is small in comparison to the potential effect of PTH. Vitamin D has important functions as a vitamin in maintaining calcium homeostasis, in part through steroid hormone like roles in the body. ! Lower dietary calcium concentrations in the transition diet pre-calving are lower risk for milk fever than higher concentrations. Dietary Ca Excretion into milk Excretion Excretion Absorption PTH Vitamin D3 Bone Store Circulation Figure7:PTHandvitaminD3as regulatorsofCametabolism (adaptedfromDiseases of Cattle in Australasia, 2010). Cal = 0.78 mmol/L Cal = 0.56 mmol/L Cal = 0.48 mmol/L Cal = 1.29 mmol/L
- 25. 23 Transition Cow Management: Ian Lean and Peter DeGaris A review for nutritional professionals, veterinarians and farm advisers Early studies (Boda and Cole 1954; Goings et al. 1974) found that feeding diets low in calcium reduced the risk of milk fever. However, recent reviews have highlighted the fact that the perceived central role of calcium in the pathogenesis of milk fever is contentious. Literature reviews of Lean et al. (2003) and Thilsing-Hansen et al. (2002) suggest limiting pre-calving intake of calcium to 60g and 20g per day, respectively. A qualitative literature review (McNeill et al. 2002) also concluded that excessive calcium intake was an important risk factor for milk fever, but less so than potassium. However, Goff (2000) concluded that calcium concentration in pre-calving diets had little influence on the incidence of milk fever when fed at levels above the daily requirements of the cow (approximately 30g/day). Oetzel (2000) recommended a daily intake in the pre-calving diet of 150g/day, a calcium concentration of between 1.1% and 1.5% of dry matter, in conjunction with a dietary DCAD of approximately –150mEq/kg DM. However, this recommendation was not supported by his meta-analysis, because (Oetzel 1991) found highest milk fever risk occurred with a dietary calcium concentration of 1.16%. Further examination with logistic regression using the data of Horst et al. (1997) shows that lower concentrations of calcium were of less risk of causing milk fever than higher concentrations although this was not statistically significant. Magnesium Magnesium is an important element. Approximately 70% of body magnesium is present in bone and almost all the balance is found in soft tissue. It serves with calcium to preserve membrane stability, hence it is important to cardiac muscle function, skeletal muscle function and nervous tissue function. Magnesium is critical to enzymatic function in every major metabolic pathway. Magnesium also plays an important role in calcium homeostasis. There are sound physiological bases for a protective role of magnesium in the pathogeneses of milk fever. Magnesium is critical in the release of parathyroid hormone and in the synthesis of 1,25(OH)2 D3. In hypomagnesaemic states, kidney and bone are less responsive to PTH (Goff 2000; Sampson et al. 1983). Wang and Beede (1992) found that non-pregnant, non-lactating cows fed a diet high in magnesium had lower renal calcium excretion than those fed a diet low in magnesium. Contreras et al. (1982) and van de Braak et al. (1987b) both demonstrated poor calcium mobilisation in hypomagnesaemic cattle. Phosphorus Phosphorus also may play an important role in milk fever, with increasing phosphorus concentrations increasing milk fever risk. Although phosphorus concentrations are not as tightly regulated as calcium, both are closely related with plasma PO4 concentrations regulated directly by 1,25(OH)2 D3 and indirectly by the PTH/calcium negative feedback loop (Goff 1999). In cattle, there is evidence that a pre-calving diet high in phosphorus can have a negative impact on calcium homeostasis (Barton et al. 1987; Julien et al. 1977; Kichura et al. 1982). Dietary Cation Anion Difference The Dietary Cation Anion Difference (DCAD) (sometimes also referred to as Dietary Cation Anion Balance or DCAB) theory of milk fever control began with studies by Norwegian workers that found that diets high in sodium and potassium and low in chlorine and sulphur tended to increase the incidence of milk fever, while those high in chlorine and sulphur and low in sodium and potassium or containing added anionic salts (AS), decreased the occurrence of milk fever (Dishington 1975; Dishington and Bjornstad 1982; Ender et al. 1962). Block (1984) found a significant increase in the incidence of milk fever for cattle fed on diets that differed only in their quantities of chlorine, sulphur and sodium. Further studies (Beede et al. 1992; Gaynor et al. 1989; Goff et al. 1991a; Leclerc and Block 1989; Oetzel et al. 1988; Phillipo et al. 1994) supported the earlier findings that feeding diets containing higher concentrations of chlorine and sulphur can reduce risk of milk fever. Increasing potassium in the diet causes hypocalcaemia (Horst et al. 1997). ! Magnesium plays a protective role re. milk fever, independent of DCAD. ! Increasing phosphorus concentrations increases milk fever risk, independent of DCAD. ! Feeding anionic salts lowers the cow’s blood pH, resulting in strong ion metabolic acidosis. This triggers more active bone mobilisation and dietary absorption of calcium. ! Lowering the DCAD causes a metabolic acidosis via the Strong Ion Model.
- 26. 24 Transition Cow Management: A review for nutritional professionals, veterinarians and farm advisers Ian Lean and Peter DeGaris Physiology of DCAD theory of milk fever control The underlying physiology of the DCAD theory of milk fever control has its basis in the Strong Ion Model of acid/base balance (Singer and Hastings 1948), modified by Stewart (1981) and simplified by Constable (1997). The basic tenets of the Simplified Strong Ion Model are that plasma pH is determined by four independent factors; the partial pressure of CO2 (PCO2 ); solubility of CO2 in plasma (S) which is temperature dependent; the net strong ion charge or strong ion difference ([SID+ ]) and the total plasma concentration of non-volatile weak buffers, principally albumin, globulin and phosphate ([ATOT ]). The major strong ions consist of cations (Na+ , K+ , Mg2+, Ca2+ and NH4 + ) and anions (Cl- and S04 2- ). The Simplified Strong Ion Model predicts that plasma pH can be lowered by: • increasing the temperature thereby increasing solubility of CO2 in plasma (S); • increasing PCO2 (respiratory acidosis); • decreasing [ATOT ]; and • decreasing [SID+ ]. Application of DCAD theory to prevent milk fever aims to reduce the [SID+], consequently lowering plasma pH, resulting in strong ion metabolic acidosis. This is can be achieved by feeding salts of the strong cations (CaCl2 , CaSO4 , MgCl2 , MgSO4 , NH4 Cl and (NH4 )2SO4 ) or acids of the anions (HCl and H2 SO4 ) (See Table 7). The strong cations Ca2+ , Mg2+ and NH4+ are absorbed to a lesser extent from the GIT than are the strong anions Cl- and SO4 2- . This results in a relative excess of absorbed anions compared to absorbed cations lowering the [SID+ ] and subsequently plasma pH. Salt (NaCl) and KCl have a net effect of zero on the [SID+ ], because Na+ and K+ are absorbed with near 100% efficiency in the intestine. A number of possible means by which risk of milk fever may be influenced by feeding greater concentration of the salts of the strong cations (anionic salts) have been identified: 1. Diets high in anionic salts cause metabolic acidosis in goats (Fredeen et al. 1988a; Fredeen et al. 1988b) and cattle (Gaynor et al. 1989), these observations being consistent with the Simplified Strong Ion Model. 2. Diets high in anionic salts stimulate a calciuria (Gaynor et al. 1989; Lomba et al. 1978; Oetzel et al. 1991; Phillipo et al. 1994). 3. Elevated hydroxyproline concentrations have been observed in cows fed anionic salts (Block 1984; Gaynor et al. 1989), probably indicating bone mobilisation. 4. Plasma ionised calcium concentrations increase with feeding of anionic salts (Oetzel et al. 1991; Phillipo et al. 1994). 5. Diets high in anionic salts stimulate higher plasma levels of 1,25(OH)2D3 before calving (Gaynor et al. 1989; Phillipo et al. 1994). Calciuria can be induced by acute acidosis in a number of species. Metabolic acidosis increases mobilisation of calcium from rat liver mitochondria (Akerman 1978) and mobilisation of calcium from bone, independent of, and in conjunction with, PTH (Beck and Webster 1976). The Simplified Strong Ion Model The Simplified Strong Ion Model (Constable (1999) to predict plasma pH is: pH = pK1 ´+ log pK1 ´ is the ion product of water, Ka is the effective equilibrium disassociation constant for plasma non-volatile weak acids, [SID+ ] is the strong ion difference, [ATOT ] is the plasma non-volatile weak acid concentration, S is the solubility of CO2 in plasma and pCO2 is the partial pressure of CO2 in plasma. 2 * ) 1 0 / ( ] [ ] [ C O p H a TOT a p S K A K SID � + + � S*Pco2
- 27. 25 Transition Cow Management: Ian Lean and Peter DeGaris A review for nutritional professionals, veterinarians and farm advisers Figure 8: Relationship between DCAD and urine pH (DeGaris and Lean, 2010). ! Urine pH is a relatively insensitive indicator of DCAD. R2 = 0.6407 5.0 6.0 7.0 8.0 9.0 -400 -200 0 200 400 600 800 1000 1200 1400 DCAD (mEq/kg DM) Urine pH Sources Comments References Mineral sulphates, e.g. calcium sulphate, magnesium sulphate, ammonium sulphate Sulphate salts are more palatable than chloride. Ammonium salts provide non-protein nitrogen (NPN). The NPN can be beneficial on low protein diets. Mineral chlorides, e.g. calcium chloride, magnesium chloride, ammonium chloride Lower DCAD per gm than sulphates. Ammonium salts provide non- protein nitrogen (NPN). The NPN can be beneficial on low protein diets. Hydrochloric acid, e.g. Anipro® Hydrochloric acid is an effective agent to decrease DCAD. Molasses- based, e.g. Anipro® is used to mask taste and encourage intake. Goff and Horst (1998) Hydrochloric acid in a protein meal, e.g. SoyChlor® Hydrochloric acid is an effective agent to decrease DCAD – a safer means to deliver – protein meal provides added benefit. Contains magnesium 2.47%. Goff and Horst (1998) Stabilised hydrochloric acid and sulphuric acids in a protein meal, e.g. BioChlor® Hydrochloric acid is an effective agent to decrease DCAD. Sulphur also appears to be effective – a safer means to deliver – protein meal provides added benefit with specific NPN components to increase rumen efficiency and increase microbial protein production De Groot et al (2010) Lean et al. (2005) It appears that the feeding of anionic salts acts to increase mobilisation of calcium from bone, allows loss of urinary calcium and increased absorption of dietary calcium through an increase in pre-calving plasma 1,25(OH)2 D3 concentrations. Ramberg et al. (1996) calculated that this loss was in the order of 3g per cow per day. The acidotic state allows a higher concentration of ionised calcium (the metabolically active form of calcium). Acidotic cows are in a state where both bone mobilisation and dietary absorption of calcium are more active (See Table 5 for sources of anions in the diet). Use of urine pH to monitor efficacy of acidification The efficacy of acidification can be monitored by evaluating the pH of urine. Jardon (1995), based on personal experience and communication with other researchers, suggested that a urinary pH of 6-7 was optimal for Holstein cattle and a pH of 5.5-6.5 was optimal for Jersey cattle to indicate metabolic acidosis. Charbonneau et al. (2006) concluded that a urinary pH of 7.0, regardless of breed, may be more appropriate for transition cattle. However, (Lean et al. 2005) showed a curvilinear relationship between DCAD and urine pH, with DCAD having little impact on urine pH until it reaches approximately 200mEq/kg DM (Figure 8). This relationship reflects renal buffering systems that maintain an alkaline urinary pH until overwhelmed. Urine pH is therefore no longer recommended as a tool to monitor efficacy of dietary acidification. Table 5: Sources of anions in the diet: Comparative aspects.
- 28. 26 Transition Cow Management: A review for nutritional professionals, veterinarians and farm advisers Ian Lean and Peter DeGaris DCAD equations Many equations have been proposed for calculating the DCAD of rations. The variations of the DCAD equations are generally broken into short equations that contain only Na+ , K+ , Cl- and S2- and longer equations that contain also Ca2+ , Mg2+ and phosphorus in varying combinations and with differing coefficients. Two significant meta-analyses of milk fever risk were conducted by Oetzel (1991) and Enevoldson (1993). Both Enevoldson (1993) and Oetzel (1991) used fixed effects models for predicting outcomes and it is now widely accepted that these models are vulnerable to over-dispersion associated with clustering of effects in trials. Random effects models are preferred for such analyses. There are a large number of new studies that could be added to the original data of Oetzel (1991) to increase the statistical power of a new meta-analysis. The review and meta-analysis of Lean et al. (2006) developed two statistically significant and biologically plausible equations for predicting the milk fever risk based on pre-calving dietary constituents. The authors preferred the equation whereby the risk of milk fever could be predicated from the dietary levels of calcium, magnesium, phosphorus, DCAD as calculated by (Na+ + K+ ) – (Cl- + S2- ), breed and duration of exposure to the diet [-5.76 + 5.48 (Ca) –5.05 (Mg) + 1.85 (P) +0.02 (DCAD) – 2.03 (Ca2) + 0.03 (Days of Exposure)]. ! In pasture- based feeding systems, calcium concentrations in the total diet below 0.6% (DM basis) have the lowest milk fever risk. Another meta-analysis examining DCAD only (Charbonneau et al. 2006) determined the most appropriate form of the DCAD equation was (Na+ + K+ ) – (Cl- + 0.6 S2- ) on the basis that this equation could be used to predict both milk fever risk and urine pH. However, the equation Na+ + K+ ) – (Cl- + S2- ) was equivalent in predicting milk fever risk (Charbonneau et al. 2006). Consequently, based on the Simplified Strong Ion Model and the meta-analyses of Lean et al. (2005) and Charbonneau et al. (2006), we conclude that the equation DCAD = Na+ + K+ ) – (Cl- + S2- ) should be used to predict the effect of a diet on the risk of milk fever. Importantly, this linear relationship between DCAD and milk fever risk (Lean et al. 2005) predicts that any reduction in the DCAD will decrease the risk of milk fever (Figure 9). The aim of DCAD manipulation of pre-calving diets must be to reduce milk fever risk and not necessarily manipulate blood or urine pH. A target of 0 meq/kg DCAD or less is ideal. However, as Figure 9 illustrates, any decrease in DCAD results in an incremental reduction in milk fever risk. Figure 9: Relationship between DCAD and milk fever risk (Lean et al. 2006). 0.0 1.0 2.0 3.0 4.0 5.0 6.0 7.0 -400 -200 0 200 400 600 800 1000 1200 DCAD (mEq/kg DM) Milk fever incidence (%) ! Any decrease in DCAD will reduce milk fever risk, even if 0 mEq/kg is not achieved. ! The most appropriate DCAD equation to predict the effect of a diet is: DCAD = (Na+ + K+ ) – (Cl- + S2- ). The dairy industry has asked feed laboratories to use this equation and express results in mEq/kg.
- 29. 27 Transition Cow Management: Ian Lean and Peter DeGaris A review for nutritional professionals, veterinarians and farm advisers Figure 10: Effect of calcium on milk fever risk. Figure 11: Effect of magnesium on milk fever risk. (DeGaris 2010) 0.0 1.0 2.0 3.0 4.0 0 0.5 1 1.5 2 2.5 3 Ca% of total diet (DM basis) Milk fever incidence % (DeGaris 2010) 0 0.4 0.8 1.2 1.6 2 0 0.1 0.2 0.3 0.4 0.5 0.6 0.7 0.8 Mg %of DM Milk fever incidence (%) ! Always be sure to express DCAD in mEq/kg DM. ! Because they impact on milk fever independent of DCAD, calcium, magnesium and phosphorus should not be included in DCAD equations. Calcium The quadratic effect of calcium present in both the models developed by Oetzel (1991) and Lean et al. (2006) supports a hypothesis that either low dietary calcium percentage (Boda and Cole 1954; Goings et al. 1974; Wiggers et al. 1975) or high dietary calcium percentage (Lomba et al. 1978; Oetzel et al. 1988) fed pre-calving reduces milk fever risk. The effect of low calcium diets on calcium homeostasis is well established, however, the process by which very high dietary calcium concentrations pre-calving may reduce milk fever risk is unclear. A protective effect of high dietary calcium was first proposed in the 1930s (Gould 1933; Mattick and Little 1933) but has been substantially refuted (Boda 1956; Boda and Cole 1954; Goings et al. 1974; Wiggers et al. 1975). However, the hypercalciuric effect of low DCAD diets (Vagnoni and Oetzel 1998; van Mosel et al. 1993) may lower readily available bone calcium, hence bone calcium reserves available for mobilisation after calving. It has been suggested that feeding higher dietary calcium concentrations pre-calving may reduce this effect (Lean et al. 2003). This hypercalcuric effect may be exacerbated with increased duration of exposure to a low DCAD diet pre-calving. Longer exposure to a pre-calving transition diet would, therefore, increase the incidence of milk fever as predicted by models developed by Lean et al. (2006). Although increased urinary calcium loss on low DCAD diets has been demonstrated (van Mosel et al. 1993; Vagoni and Oetzel 1998), an effect of duration of exposure to the low DCAD diet on milk fever risk has not been established in trial work. At present we recommend controlling calcium concentrations in the diet to around 0.4% to 0.6% before calving. Equations for predicting DCAD that included calcium on the cationic side of the equation appear flawed as the effect predicted by the meta-analysis (Lean et al. 2006) is a linear increase in milk fever risk with increasing dietary calcium, whereas the effect of calcium on milk fever risk is quadratic (Lean et al. 2005; Oetzel 1991). Magnesium Similarly, magnesium, if included on the cationic side of a DCAD equation, would have a linear effect of increasing the risk of milk fever. The opposite effect is observed (Contreras et al. 1982; Goff 2000; Sampson et al. 1983; Wang and Beede 1992) and is predicted using the equation developed by Lean et al. (2006). Similarly to Ca, Mg is not included in the calculation of [SID+ ] (Constable 1999). The equation developed by Lean et al. (2005) predicts that the effect of increasing Mg concentration in the pre-calving diet is a very substantial decrease in the risk of milk fever. At present, we recommend a magnesium concentration in the diet of at least 0.45% before calving.
- 30. 28 Transition Cow Management: A review for nutritional professionals, veterinarians and farm advisers Ian Lean and Peter DeGaris Phosphorus Phosphorus has been considered to contribute to the anionic side of the DCAD equation, but high P concentrations have been associated with increased risk of milk fever (Barton et al. 1987; Julien et al. 1977; Kichura et al. 1982; Lean et al. 2005; Lean et al. 2003). This is consistent with the simplified strong ion model of Constable (1999) that predicts increasing plasma phosphate will increase [ATOT ] and increase plasma pH. Length of exposure Length of exposure to the transition diet pre- calving was a consistently significant variable in models developed by Lean et al. (2006) with this variable and acted to substantially modify coefficients for calcium and magnesium. Therefore, it was necessary to include this variable in models, in contrast to those previously developed by Oetzel (1991) and Enevoldsen (1993). While the optimum time spent on a transition diet pre-calving for milk fever control has not been determined, effective urinary acidification can occur in five to seven days. However, excessive time spent on low DCAD diets may increase the risk of milk fever (Lean et al. 2006). The optimum time spent on a transition diet is likely to be around 21 days. A recent Australian study (DeGaris et al. 2009; DeGaris et al. 2008) examined the effects of pre-calving transition diets formulated to deliver a positive metabolisable energy and protein balance sufficient to meet cow and foetal requirements; a negative DCAD; a level of calcium, magnesium and phosphorus suitable for control of milk fever; a level of micronutrients sufficient to meet cow and foetal requirements and deliver antibiotic rumen modifiers to reduce the risk of ruminal acidosis before and after calving. This study demonstrated statistically significant and economically important increases in milk and milk protein yield, submission rates and six and 21 week in-calf rates. It found the maximum increases in milk yield, milk protein yield and milk fat yield occurred at 24 days of exposure to a well-balanced transition diet (Figures 13 a, b and c). While there were no detrimental effects of exposures greater than 24 days, there was no further increase in production. This study also examined the effects of time spent on pre-calving transition diets on reproductive measures and animal health. Continual improvements in the calving to conception interval were seen with increasing time spent on the transition diets (Figure 14), which would be expected to translate into improvements in six-week in-calf rate and not- in-calf rate. Similar benefits were also seen on the proportion of cows that either died or were culled from the study herds (Figure 15). Although the reproductive and health benefits of feeding a balanced transition diet are likely to improve with increasing days cows are fed a diet, the potential negative effect on the risk of milk fever and the lack of a benefit on production of feeding cows for more than 24 days pre-calving, means the recommendation of 21 days on a transition diet pre-calving is sound. To achieve this target, very accurate predicted calving dates are essential. This necessitates early and accurate pregnancy diagnosis. From the variables included in the equation used to predict milk fever, developed by Lean et al. (2006) and the meta-analysis of Charbonneau et al. (2006) it is clear that both the DCAD as calculated by (Na+ + K+ ) – (Cl- + S2- ) and macro mineral concentration, in particular calcium, magnesium, and phosphorus of the diet are of great importance in determining the risk of milk fever, as is time spent on a pre-calving transition diet and breed of cattle. Figure 12: Effect of phosphorus on milk fever risk. (DeGaris et al. 2010) 0 1 2 3 4 5 6 0 0.2 0.4 0.6 0.8 1 1.2 1.4 1.6 P %of DM Milk fever incidence (%) ! Phosphorus concentrations should be controlled before calving to <0.4%. ! The optimal time spent on a transition diet pre-calving is likely to be about 21 days.
- 31. 29 Transition Cow Management: Ian Lean and Peter DeGaris A review for nutritional professionals, veterinarians and farm advisers Figures 13 a, b and c: Four day moving average and 95% confidence intervals of predicted milk yield, fat and protein yield with increasing days of exposure to pre-calving transition diet. Figure 14: Reproductive performance. Figure 15: Risk of culling and death. 24.0 25.0 26.0 27.0 28.0 29.0 30.0 31.0 32.0 0 7 14 21 28 35 42 Days exposed to pre-calving transition diet Predicted 4.0% fat 3.2% protein corrected milk yield (L/day) (DeGaris et al. 2008) (DeGaris et al. 2008) 0.90 0.95 1.00 1.05 1.10 1.15 1.20 0 7 14 21 28 35 42 Days exposed to pre-calving transition diet Predicted fat yield (kg/day) (DeGaris et al. 2008) 0.80 0.90 1.00 1.10 0 7 14 21 28 35 42 Days exposed to pre-calving transition diet Predicted milk protein yield (kg/day) Calving to conception (days) 180 160 140 120 100 80 60 40 20 0 -20 Proportion of cows pregnant 1.0 0.8 0.6 0.4 0.2 0.0 -0.2 Exposure group > 20 days 11 - 20 days 0 - 10 days (DeGaris et al. 2010) Interval from calving to removal from herd (days) 160 140 120 100 80 60 40 20 0 -20 Proportion of cows removed from herd 0.08 0.06 0.04 0.02 0.00 -0.02 Exposure group > 20 days 11 - 20 days 0 - 10 days (DeGaris et al. 2010)
- 32. 30 Transition Cow Management: A review for nutritional professionals, veterinarians and farm advisers Ian Lean and Peter DeGaris Mineral composition and DCAD of minerals and anionic feeds commonly used in transition diets pre-calving are provided in Table 6. Conversion factors needed to calculate DCAD from % DM are provided in Table 7. Mineral Ca % Mg % Cl % S % Na % K % DCAD* (mEq/Kg) Magnesium sulphate (Epsom salts) MgSO4.7H2O – 9.98 – 13.01 – – -8100 Magnesium chloride MgCl.6H2O – 11.96 34.87 - – – -9830 Calcium sulphate (Gypsum) CaSO4.2H2O 27.26 – 18.63 – – -10590 Calcium chloride CaCl2.2H20 23.28 – 48.22 – – -13800 Ammonium sulphate (NH4)2SO4 – – – 24.26 – – -14950 Ammonium chloride NH4Cl – – 66.26 – – – -18590 Magnesium oxide MgO – 58.0 – – – – 0 Sodium bicarbonate NaHCO2 – – – – 27.00 – +11740 Sodium chloride (Salt) NaCl – – 60.70 – 39.34 – 0 Limestone (Lime) Limestone 37.0 2.06 0.03 0.04 0.06 0.12 +20 BioChlor* BioChlor* 0.09 0.29 10.11 2.36 1.10 1.09 -3540 SoyChlor 16:7* SoyChlor 16:7* 4.04 2.65 10.29 0.35 0.15 0.70 -2870 * As per short DCAD equation: (Na+ + K+ ) – (Cl- + S2- ) Table 6: Mineral composition and DCAD of minerals and anionic feeds commonly used in pre-calving transition diets (DM basis). Example DCAD calculation for typical wheat hay as per Table 8, using the short DCAD equation: DCAD in mEq/kg DM = [(0.08% * 434.98) + (1.77% * 255.74)] – [(0.53% * 282.06) + (0.16% *623.75)] = 487.5 – 249.3 = 238.2 mEq/kg DM Element To convert % DM to mEq/kg DM: multiply by Sodium 434.98 Potassium 255.74 Chloride 282.06 Sulphur 623.75 Table 7: Conversion factors from per cent dry matter to mEq/kg DM.
- 33. 31 Transition Cow Management: Ian Lean and Peter DeGaris A review for nutritional professionals, veterinarians and farm advisers Low Moderate High Low potassium molasses Maize silage High potassium molasses Grains Cereal hays (these can still be high) Pasture treated with effluent Most grain-based byproducts Whole cotton seed Legume pastures Protein meals Sodium bicarbonate Brewers grains Table 9: Risk level of feeds commonly used in pre-calving transition diets for milk fever. Table 8: Mineral composition and DCAD of feeds commonly used in pre-calving transition diets. Feed* Ca % Mg % Cl % S % Na % K % DCAD (mEq/kg DM)# Typical Range Rye / clover pasture 0.63 0.23 2.0 0.28 0.53 3.4 +390 +10 to +750 Kikuyu pasture 0.34 0.37 4.5 .10 .33 1.96 +680 +10 to +750 Lucerne 1.53 0.31 0.61 0.30 0.14 2.57 +360 +10 to +750 Oat Hay 0.35 0.16 1.02 0.14 0.42 1.87 +280 0 to +750 Pasture Hay 0.47 0.18 0.66 0.17 0.02 2.00 +230 +10 to +750 Wheat Hay 0.35 0.16 0.53 0.16 0.08 1.77 +240 0 to +750 Grass Silage 0.57 0.22 0.76 0.20 0.05 2.78 +390 +10 to +750 Maize Silage 0.31 0.22 0.32 0.12 0.01 1.22 +150 +5 to +300 Sorghum Silage 0.49 0.28 0.60 0.12 0.02 1.72 +200 +10 to +750 Trit Silage 0.52 0.17 0.75 0.20 0.08 2.90 +440 +10 to +750 Wheat 0.05 0.16 0.09 0.17 0.02 0.41 -20 0 to +50 Barley 0.05 0.14 0.08 0.13 0.01 0.52 +40 0 to +50 Almond Hulls 0.27 0.11 0.04 0.03 0.02 2.65 +660 Molasses 1.00 0.42 0.75 0.47 0.22 4.01 +620 -10 to 700 Bread 0.20 0.08 1.11 0.16 0.64 0.34 -50 Brewers Grain 1.32 0.35 0.16 0.09 0.02 0.64 +70 Canola 0.75 0.51 0.03 0.63 0.09 1.31 -30 0 to +50 Whole Cottonseed 0.18 0.36 0.08 0.25 0.03 1.19 +140 0 to +50 Palm kernel meal 0 to +240 * Chemical composition expressed on a dry matter basis. # Note that mineral composition of feeds may vary widely depending on source / fertiliser history / season etc. and so too their DCAD value. Feeds should therefore be analysed using wet chemistry rather than relying on ‘book values’.
- 34. 32 Transition Cow Management: A review for nutritional professionals, veterinarians and farm advisers Ian Lean and Peter DeGaris This diet is LOW risk: ✓ DCAD is 0meq /kg DM ✓ Ca is < 0.6% DM as recommended ✓ P is very close to max. 0.4% DM as recommended ✓ Mg is very close to min. 0.45% DM as recommended This diet is HIGH risk: ✗ DCAD is highly positive ✗ Calcium is above recommended max. 0.6% DM ✗ P is above recommended max. 0.4% DM ✗ Mg is below recommended min. 0.45% DM ✗ Contains sodium bicarbonate which has a very high DCAD Table 10: Examples of low and high milk fever risk pre-calving transition diets. a) LOW risk diet Feed ingredient kg DM Na K S Cl DCAD Ca P Mg % g/d % g/d % g/d % g/d mEq/ kg DM % g/d % g/d % g/d Ryegrass silage 4.00 0.63 25.20 3.63 145.20 0.19 7.60 1.70 68.00 600 0.59 23.60 0.32 12.80 0.17 6.80 Wheat hay 2.30 0.08 1.84 2.34 53.82 0.11 2.53 1.12 25.76 250 0.19 4.37 0.29 6.67 0.08 1.84 Kikuyu pasture 2.00 0.10 2.00 3.39 67.80 0.24 4.80 1.96 39.20 210 0.50 10.00 0.42 8.40 0.20 4.00 Wheat 2.70 0.00 0.00 0.42 11.34 0.13 3.51 0.12 3.24 -10 0.06 1.62 0.36 9.72 0.12 3.24 Lupins 0.90 0.50 4.50 0.82 7.38 0.20 1.80 0.08 0.72 280 0.29 2.61 0.33 2.97 0.14 1.26 1kg commercial Anionic concentrate 1.00 1.14 11.40 1.37 13.70 4.14 41.40 6.57 65.70 -3590 0.18 1.80 0.99 9.90 2.13 21.30 Limestone 0.03 0.06 0.02 0.12 0.04 0.04 0.01 0.03 0.01 20 33.00 9.90 0.02 0.01 2.06 0.62 Magnesium oxide 0.03 0.00 0.00 0.00 0.00 0.00 0.00 0.00 0.00 0 3.07 0.92 0.00 0.00 54.00 16.20 Total diet 12.96 0.35 44.96 2.31 299.28 0.48 61.65 1.56 202.63 0 0.42 54.82 0.39 50.47 0.43 55.26 b) HIGH risk diet (using feeds and minerals typically used in a milker diet) Feed ingredient kg DM Na K S Cl DCAD Ca P Mg % g/d % g/d % g/d % g/d mEq/ kg DM % g/d % g/d % g/d Kikuyu pasture 2.00 0.10 2.00 3.39 67.80 0.24 4.80 1.96 39.20 208 0.5 10.00 0.42 8.40 0.20 4.00 Ryegrass silage 4.00 0.63 25.20 3.63 145.20 0.19 7.60 1.70 68.00 604 0.59 23.60 0.32 12.80 0.17 6.80 Wheat hay 2.30 0.08 1.84 2.34 53.82 0.11 2.53 1.12 25.76 249 0.19 4.37 0.29 6.67 0.08 1.84 Wheat 2.70 0.00 0.00 0.42 11.34 0.13 3.51 0.12 3.24 -8 0.06 1.62 0.36 9.72 0.12 3.24 Lupins 0.90 0.50 4.50 0.82 7.38 0.20 1.80 0.08 0.72 280 0.29 2.61 0.33 2.97 0.14 1.26 Limestone 0.06 0.06 0.04 0.12 0.07 0.04 0.02 0.03 0.02 23 37 22.20 0.00 0.00 2.06 1.24 Magnesium oxide 0.02 0.00 0.00 0.00 0.00 0.00 0.00 0.00 0.00 0 0 0.00 0.00 0.00 58.00 11.60 Sodium bicarbonate 0.06 27 16.20 0.00 0.00 0.00 0.00 0.00 0.00 11744 0 0.00 0.00 0.00 0.00 0.00 0.5kg commercial milker premix 0.50 6.6 33.00 0.4 2.00 0.15 0.75 0.12 0.60 2846 6 30.00 2.40 14.00 3.00 15.00 Total diet 12.50 0.66 82.80 2.29 287.60 0.17 21.00 1.10 137.5 460 0.75 94.40 0.43 54.60 0.36 45.00 Steps to calculate DCAD: 1. Analyse all feed ingredients for nutrient and mineral content using wet chemistry methods for minerals. 2. Calculate relative contribution of each feed to total diet mineral content (g/day). 3. Sum total g/d for each mineral delivered in diet. 4. Calculate percentage of each mineral in total diet 5. Calculate DCAD in mEq/Kg DM using [(Na% * 434.98) + (K% * 255.74)] – [(Cl% * 282.06) + (S% *623.75)]
- 35. 33 Transition Cow Management: Ian Lean and Peter DeGaris A review for nutritional professionals, veterinarians and farm advisers There are a number of approaches to transition feeding used on Australian dairy farms. Six commonly used approaches are: a. Pasture / hay b. Pasture / Hay / Anionic salts in fodder or water c. Pasture / Hay / Grain-based concentrate d. Pasture / Hay / Anionic salts / Concentrate e. Pasture / Hay / Professionally formulated, commercially produced anionic transition supplement (lead feed) f. TMR / PMR (fully integrated transition diet). Each of these approaches varies in terms of the extent to which it helps the cow deal with the challenges to successful adaptation to lactation. Pasture / hay (a) typically carries a very high risk of milk fever or hypomagnesaemia when pasture dominates, and high risks for low production and pregnancy toxaemia when hay dominates. The best ways to achieve some basic control over milk fever and hypomagnesaemia are to spray molasses and magnesium sulphate or magnesium chloride onto hays or silages. Measured amounts of the magnesium salts can be applied in water through a calibrated dispenser (b). The provision of grain (c) adapts the rumen to grain and provides energy and metabolisable protein by addition of protein and presence of fermentable carbohydrate. Incorporating anionic salts in a concentrate (d) allows less palatable salt inclusions to provide a lower DCAD and more markedly reduce risk of metabolic disease. Rumen modifiers and other feed additives can also be added as well with benefits to health and production. Some of the mineral anionic salts have a very low palatability. Feed manufacturers can manage this to some degree by using flavour and aroma enhancing agents including molasses. A professionally formulated, commercially produced anionic transition supplement (lead feed) fed with pasture / hay (option e) or a partial or total mixed ration (option f) offers the ability to reduce DCAD more readily and provide the transition cow with all the components of a fully integrated transition diet (energy, protein, macrominerals, microminerals, rumen modifiers and other additives) to achieve the optimal milk production and reproductive benefits possible. Table 11 on the next page provides a summary comparison of these six commonly used approaches to transition feeding with respect to: • the extent to which they meet specific challenges to adaptation to lactation and improve animal health, milk production and fertility; and. • their overall effectiveness in helping the transition cow establish a successful lactation. Table 12 provides a set of partial budgets developed to give an indication of the relative economic benefits of five common approaches. Section 5 Approaches to transition feeding
- 36. 34 Transition Cow Management: A review for nutritional professionals, veterinarians and farm advisers Ian Lean and Peter DeGaris Table 11: Six commonly used approaches to transition feeding. Approach: Pasture / hay only Pasture / hay + anionic salts in fodder or water Pasture / hay + grain / concentrate Pasture / hay + grain / concentrate + DIY anionic salts Pasture / hay + commercial transition supplement (lead feed)* Fully integrated transition diet fed as PMR or TMR Effective in terms of … Rumen adaptation – – ✔✔✔✔ ✔✔✔✔– ✔✔✔✔✔ ✔✔✔✔✔ ✔✔✔✔✔ Positive Metab. Energy balance – – ✔✔✔ ✔✔✔✔ ✔✔✔✔ ✔✔✔✔✔ Positive Metab. Protein balance – – ✔ ✔✔ ✔✔✔– ✔✔✔✔ ✔✔✔✔✔ Milk fever control – ✔– ✔✔ – ✔✔✔ ✔✔✔✔✔ ✔✔✔✔✔ Other metabolic disease control – – ✔✔ ✔✔✔✔ ✔✔✔✔✔ ✔✔✔✔✔ Improved animal health – ✔✔ ✔✔ ✔✔✔ ✔✔✔ – ✔✔✔✔ ✔✔✔✔✔ Improved milk production – ✔ ✔✔ ✔✔✔ ✔✔✔ – ✔✔✔✔ ✔✔✔✔✔ Improved fertility – ✔ ✔✔ ✔✔ ✔✔✔ – ✔✔✔✔ ✔✔✔✔✔ Overall effectiveness – ✔✔ ✔✔ ✔✔– ✔✔✔ ✔✔✔ – ✔✔✔✔ ✔✔✔✔✔ Comments Does not address any needs of the transition cow. Does not address rumen adaptation to grain / conc. Does not address control of macromineral disorders. Possible palatability problems. Can be difficult to control macro mineral disorders. Can be a highly effective strategy if diet is fully integrated. Highly effective strategy. * May or not include all the nutritional components necessary to provide a fully integrated transition diet
- 37. 35 Transition Cow Management: Ian Lean and Peter DeGaris A review for nutritional professionals, veterinarians and farm advisers Other approaches to transition feeding Vitamin D Vitamin D plays a vital role in the regulation of calcium and up regulation of vitamin D production is critical to the success of feeding strategies to control milk fever risk. There are two other ways in which vitamin D may be applied to control milk fever: • Injection of 1α – cholecalciferol (e.g. Vitamec D3 injection®) between 2 to 8 days before anticipated calving can provide a an exogenous source of vitamin D. The timing of the injection is important to ensure that calcium uptake is not subsequently depressed by premature stimulus of calcium uptake. • It is also possible that active forms of oral vitamin D could stimulate calcium uptake. There is evidence that 1α – cholecalciferol fed orally may reduce risk of milk fever (Lean, unpublished). Further investigation of vitamin D feeding options is warranted as part of an integrated feeding strategy. Hydrochloric acid to reduce DCAD In addition to anionic salts, hydrochloric acid has also been used effectively as a source of anions to reduce the DCAD of the transition diet pre-calving (Goff and Horst 1998). In liquid form, HCl is dangerous to handle and corrosive to machinery. However, commercial supplements containing HCl have been developed which overcome these problems. Please refer to Table 5, page 25. Calcium drenches at calving Calcium drenches and boluses can aid in the prevention of milk fever if given within 12 hours of calving and continued for several days after calving. Due to the labour intensive nature of drenching cows, these strategies are best restricted to cows considered be a high risk for developing milk fever. Energy intake restrictions The most notable alternate and well-developed strategy to those detailed in this document is that outlined by Beever (2006). This strategy was developed from studies conducted in the US and European Union and was reported to improve the health of cattle in herds in which the strategy was tested. Cows were fed diets containing chopped straw to provide a diet containing a high fibre, low energy (about 9MJ) and 13% crude protein. These diets are designed to increase feed intake and to control the decrease in dry matter intake often observed before calving. It is hypothesised that the approach may increase the sensitivity of cattle to insulin release around the time of calving following high levels of feeding. Cows have also been limit fed in studies designed to explore ways to control declines in appetite (Winkelman et al. 2008). Cows in higher body condition score have marked decreases in appetite, whereas cows in BCS <3.5/5 (5.5/8) have less decline. Janovick and Drackley (2010) achieved energy restriction before calving by providing chopped straw as 32% of the dry matter in total mixed rations. Interestingly, feed restricted cows produced much less milk (although not significantly less in a small study), but maintained a better energy balance than cows fed more than the NRC (2001) energy requirements. More studies are needed to explore the suitability of feed restricted strategies, either by amount of feed or energy density, in cows that are lower in body condition.