SlideShare a Scribd company logo
1 of 13
Download to read offline
The CHAOS Report 2015 is a model for future CHAOS Reports. There have only been two previous CHAOS Reports, the
original in 1994 and the 21st
edition of 2014. This new type of CHAOS Report focuses on presenting the data in different
forms with many charts. Most of the charts come from the new CHAOS database from the fiscal years 2011 to 2015. The CHAOS
fiscal year starts March 1 and runs until the end of February. A few of the charts are from the new SURF database to highlight
certain information. The purpose of this report is to present the data in the purest form without much analysis and little thought
leadership. Analysis and thought leadership are offered in the CHAOS Manifesto series of reports.
Another major change is how we define success. We have multiple definitions, including our newest. We coded the new CHAOS
database with six individual attributes of success: OnTime, OnBudget, OnTarget, OnGoal, Value, and Satisfaction. Our Traditional
definition is OnTime, OnBudget, and OnTarget. This means the project was resolved within a reasonable estimated time, stayed
within budget, and contained a good number of the estimated features and functions. Our new Modern definition is OnTime,
OnBudget, with a satisfactory result. This means the project was resolved within a reasonable estimated time, stayed within
budget, and delivered customer and user satisfaction regardless of the original scope. We have the flexibility to present the
results for one to six of these attributes in any combination.
Copyright © 2015 The Standish Group International, Inc.
CHAOS REPORT 2015
TRADITIONAL RESOLUTION FOR ALL PROJECTS
ONBUDGET ONTIME ONTARGET
The Traditional resolution of all software projects from FY2011–2015 within the new CHAOS database.
The percentage of projects that were
OnBudget from FY2011–2015 within the
new CHAOS database.
The percentage of projects that were
OnTime from FY2011–2015 within the
new CHAOS database.
The percentage of projects that were
OnTarget from FY2011–2015 within
the new CHAOS database.
*All data, unless otherwise noted, represents results from FY2011-2015. The total number
of software projects is 25,000-plus, with an average of 5,000 per yearly period.
NO
56%
NO
60%
NO
44%
YES
44%
YES
40%
YES
56%
2011 2012 2013 2014 2015
SUCCESSFUL 39% 37% 41% 36% 36%
CHALLENGED 39% 46% 40% 47% 45%
FAILED 22% 17% 19% 17% 19%
Copyright © 2015 The Standish Group International, Inc. 2
2011 2012 2013 2014 2015
SUCCESSFUL 29% 27% 31% 28% 29%
CHALLENGED 49% 56% 50% 55% 52%
FAILED 22% 17% 19% 17% 19%
Our Modern Resolution definition is OnTime, OnBudget, with a satisfactory result. This definition
encompasses both a success rate for the project management of a project and for the project itself.
The Traditional Resolution of OnTime, OnBudget, and OnTarget clearly supports the goals of project
management, but not the customer or user of the product or project. The reason we consider this
to be the best definition is that it combines the project management process and the end results
of a project. We have seen many projects that meet the triple constraints of OnTime, OnBudget,
and OnTarget, but the customer was not satisfied with the outcome. This is evident in the data, which
shows a 7% decrease in the success rate and a 7% increase in the challenged rate.
In changing from the OnTarget constraint to satisfactory we avoid penalizing a project for having an evolving target, which all
projects have, even the very small ones. Customers have a clear opinion on the satisfaction level whether or not all the features
and functions that they asked for in the beginning of the project are realized. In our research we found that both satisfaction
and value are greater when the features and functions delivered are much less than originally specified and only meet obvious
needs. In other research we found that most features and functions of software are not used. These additional features
increase cost, risk, and quality but do not necessarily provide value.
MODERN RESOLUTION FOR ALL PROJECTS
VALUABLE ONGOAL SATISFACTORY
The Modern Resolution (OnTime, OnBudget, with a satisfactory result) of all software projects from FY2011–2015 within the new CHAOS
database. Please note that for the rest of this report CHAOS Resolution will refer to the Modern Resolution definition not the Traditional
Resolution definition.
The percentage of projects considered
valuable from FY2011–2015 within the new
CHAOS database.
The percentage of projects that were
OnGoal from FY2011–2015 within the new
CHAOS database.
The percentage of projects considered
satisfactory from FY2011–2015 within the
new CHAOS database.
NO
38%
NO
44%
NO
41%
YES
59%
YES
62%
YES
56%
Copyright © 2015 The Standish Group International, Inc. 3
Project size has always been a major element in the CHAOS research. It was clear from
the very beginning of the CHAOS research that size was the single most important factor in
the resolution of project outcome. On this page we show two tables: resolution of all software
projects by size; and size of the software projects by resolution. These tables clearly show the
impact of size on the results of Ontime, OnBudget, with a satisfactory result. It is also clear that
the larger the project, the less valuable the return rate. In many cases larger projects never return
value to an organization. The faster the projects go into production the quicker the payback starts
to accumulate.
One of the major services of our Value Portfolio Optimization and Management Service is to break up large software
projects into multiple small projects, with early delivery for success, quicker return on value, and greater customer and
user satisfaction. We have found that most
software projects only require a small team
for a short duration in order to deliver value
to the organization; only in very rare cases
do projects need to be larger and longer.
Most, if not all, large, complex, multi-year
projects are unnecessary. This is especially
true for standard infrastructure software—
such as middleware, databases, and system
management.
PROJECT SIZE BY CHAOS RESOLUTION
CHAOS RESOLUTION BY PROJECT SIZE
SUCCESSFUL CHALLENGED FAILED TOTAL
Grand 6% 51% 43% 100%
Large 11% 59% 30% 100%
Medium 12% 62% 26% 100%
Moderate 24% 64% 12% 100%
Small 61% 32% 7% 100%
SUCCESSFUL CHALLENGED FAILED
Grand 2% 7% 17%
Large 6% 17% 24%
Medium 9% 26% 31%
Moderate 21% 32% 17%
Small 62% 16% 11%
TOTAL 100% 100% 100%
VALUE FOR LARGE PROJECTS
n Very High Value 4%
n High Value 14%
n Average 23%
n Low 16%
n Very Low 43%
The return of value for large projects from FY2011–
to 2015 within the new CHAOS database.
VALUE FOR SMALL PROJECTS
n Very High Value 17%
n High Value 27%
n Average 36%
n Low 9%
n Very Low 11%
The return of value for small projects from FY2011–
2015 within the new CHAOS database.
The size of software projects by the Modern Resolution definition from
FY2011–2015 within the new CHAOS database.
The resolution of all software projects by size from FY2011–2015 within
the new CHAOS database.
Copyright © 2015 The Standish Group International, Inc. 4
Looking at project resolution by industry provides another view of the CHAOS database. The
table on this page shows the resolution of all software projects by industry from FY2011–2015
within the new CHAOS database. The results show that retail projects had the highest success rate
at 35% using the Modern definition of success. The results also show that government projects had
the highest failure rate at 24%, and financial and government projects had the highest challenged
rate at 56%. The comparison of satisfaction level for banking versus retail shows that retail also has
better results.
Many of our Benchmark clients like to compare their results to other organizations in the same industry
and we do this as matter of course. However, we found that industry is not the most accurate or important metric of comparison.
The most accurate is to consider industry as a minor filter, with project type, size, skills, and methodology as primary filters.
Other minor filters would include organizational size and geography. In our Resolution Benchmark Membership we use this
technique to benchmark project portfolios.
CHAOS RESOLUTION BY INDUSTRY
BANKING PROJECTS
n Very Satisfied 9%
n Satisfied 21%
n Somewhat Satisfied 28%
n Not Satisfied 19%
n Disappointed 23%
The satisfaction level for banking projects from FY2011–2015
within the new CHAOS database.
RETAIL PROJECTS
n Very Satisfied 12%
n Satisfied 27%
n Somewhat Satisfied 32%
n Not Satisfied 18%
n Disappointed 11%
The satisfaction level for retail projects from FY2011–2015
within the new CHAOS database.
SUCCESSFUL CHALLENGED FAILED
Banking 30% 55% 15%
Financial 29% 56% 15%
Government 21% 55% 24%
Healthcare 29% 53% 18%
Manufacturing 28% 53% 19%
Retail 35% 49% 16%
Services 29% 52% 19%
Telecom 24% 53% 23%
Other 29% 48% 23%
The resolution of all software projects by industry from FY2011–2015 within the new CHAOS database.
Copyright © 2015 The Standish Group International, Inc. 5
PROJECT SELECTION PROCESS
n Only the boss/senior
executive 27%
n There is a formal process
to do it 50%
n Each sector defines its
own priorities 21%
n It is very varied or I do not know 3%
We asked the 37% of SURF respondents who said that the key
executive sponsor sets the budget with the project team, “In
general, who participates in project selection/approval in your
organization?” This is based on 111 responses in the SURF
database.
In our CHAOS Report 2014 we showed that project resolution differed slightly by most of the
areas of the world. In that report we used the traditional success metrics of OnTime, OnBudget,
and OnTarget. In this report we used the Modern definition of success of Ontime, OnBudget, with a
satisfactory result. We see a major bifurcation with North America and the rest of the world; North
America has a 31% success rate versus Europe at 25%, Asia at 22%, and the rest of world at 24%.
We have seen that North America has some of the highest emotional maturity skills. These skills
include managing expectations and gaining consensus, which in turn would cause a high satisfaction
level. On the other hand, Asia has the lowest emotional maturity scores according to our emotional
maturity appraisals and benchmarks.
As we reported in the Factors of Success 2015 report, emotional maturity is the second-ranked Factor of Success. In that report
we stated that having a skilled emotional maturity environment helps 80% of projects enjoy success. The No. 1 Factor of Success
is a skilled executive sponsor. These two factors, along with the other eight, are appraised as the first step in the Resolution
Benchmark. If we find during the skills appraisal that the executive sponsorships and/or emotional maturity skills are deficient
then we will provide advice on how to improve the score and help improve future Benchmark results. For more information on the
Factors of Success, please see the Factors of Success 2015 report.
CHAOS RESOLUTION BY AREA OF THE WORLD
BUDGET PROCESS
n Key executive sponsor sets the
budget with project team 37%
n Users set the budget with
the project team 7%
n All stakeholders are involved
in the budget 31%
n The CFO sets the limit on the budget 17%
n Other 8%
We asked IT executives, “What is your general practice on project
budgeting and cost collaboration?” This is based on 300 responses
in the SURF database.
The resolution of all software projects from FY2011–2015 by the four major areas of the world.
SUCCESSFUL CHALLENGED FAILED
North America 31% 51% 18%
Europe 25% 56% 19%
Asia 22% 58% 20%
Rest of World 24% 55% 21%
Copyright © 2015 The Standish Group International, Inc. 6
The type of project has a major effect on resolution. The table on this page shows the resolution
of all software projects by project type from FY2011–2015 within the new CHAOS database using
the Modern definition of success. Projects using a purchased application with no modification
had the highest success rate at 57%. Projects that were developed from scratch using modern
methodologies had a 23% failure rate. This is the highest failure rate other than the “other”
category. The results also show that projects that were developed from scratch using traditional
languages and methods had the highest challenged rate at 61%.
Modernization projects had the second highest success rate at 53%. The Standish Group has a very
specific definition and development method for modernization projects. In fact, we modified “modernization” by adding “in
place” so as not to confuse the general modernization of applications by the other techniques such as developing from scratch
using modern methodologies or purchasing components. For more information on modernization in place, please see our
Modernization in Place report.
PROJECT TYPE SUCCESSFUL CHALLENGED FAILED
Developed from scratch using
traditional languages and methods
22% 61% 17%
Developed from scratch using modern
methodologies
23% 54% 23%
Developed some components and
purchased others
24% 59% 17%
Purchased components and assembled
the application
25% 59% 16%
Purchased application and modified 42% 37% 21%
Purchased application and performed
no modifications
57% 28% 15%
Modernization 53% 38% 9%
Other 28% 47% 25%
GAIN VERSUS RISK METRICS
n Painful 31%
n Restrained 68%
n Painless 1%
We asked the 40% of SURF
respondents who said they do not
calculate individual requirements,
“How would you describe your organization’s efforts in
developing and maintaining financial and risk metrics for project
requirements?” This is based on 121 responses in the SURF
database.
CHAOS RESOLUTION BY PROJECT TYPE
ROI FOR REQUIREMENTS
n Calculate overall project and
allocate over individual
requirements 15%
n Calculate each requirement
and add up to overall project
ROI 14%
n Calculate overall project,
calculate major requirements,
and allocate the rest 30%
n Do not calculate individual requirements 40%
We asked IT executives, “How do you calculate ROI for individual
requirements?” This is based on 300 responses in the SURF
database.
The resolution of all software projects by project type from FY2011–2015 within the new CHAOS database.
Copyright © 2015 The Standish Group International, Inc. 7
The table on this page compares the resolution of all software projects from FY2011–2015
within the new CHAOS database, segmented by the agile process and waterfall method. The total
number of software projects is more than 10,000. The results for all projects show that agile
projects have almost four times the success rate as waterfall projects, and waterfall projects
have three times the failure rate as agile projects. The results are also broken down by project
size: large, medium, and small. The overall results clearly show that waterfall projects do not
scale well, while agile projects scale much better. However, note that the smaller the project, the
smaller the difference is between the agile and the waterfall process.
As we stated in the Factors of Success 2015 report, we have identified two trump cards that together create a winning hand.
The trump cards are the agile process and small projects. As measured by Modern metrics, small projects using an agile
process only have a 4% failure rate. For more information on trump cards, please see the Factors of Success 2015 report.
CHAOS RESOLUTION BY AGILE VERSUS WATERFALL
SIZE METHOD SUCCESSFUL CHALLENGED FAILED
All Size
Projects
Agile 39% 52% 9%
Waterfall 11% 60% 29%
Large Size
Projects
Agile 18% 59% 23%
Waterfall 3% 55% 42%
Medium Size
Projects
Agile 27% 62% 11%
Waterfall 7% 68% 25%
Small Size
Projects
Agile 58% 38% 4%
Waterfall 44% 45% 11%
The resolution of all software projects from FY2011–2015 within the new CHAOS database, segmented by the
agile process and waterfall method. The total number of software projects is over 10,000.
TIME BOXES
n Always 14%
n Yes, most of the time 23%
n Yes, some of the time 32%
n No 31%
We asked IT executives, “In general, do you utilize time
boxes to optimize your projects? This is based on 300
responses in the SURF database.
Copyright © 2015 The Standish Group International, Inc. 8
We use two tables to determine and appraise complexity. There are five attributes in
each table. We then add up the points based on the attributes of the project to determine the
complexity level. A complexity level is entered for each project in the CHAOS database. We also
use the level in the Size-Complexity Matrix. Our Size-Complexity Matrix provides a guideline for
categorizing a project either by size or complexity.
For more information about the Size-Complexity Matrix, please review prior CHAOS Manifestos
including CHAOS Manifesto 2014. In addition, The Standish Group’s Portfolio Optimization and
Management Service can help develop strategies for reducing complexity and gaining success.
Complexity is one of the main reasons for project failure. The table on this page shows the resolution of all software projects
by complexity from FY2011–2015 within the new CHAOS database using the Modern definition of success. The results show
that 38% of very easy projects were successful. Very complex projects have both the highest challenged (57%) and failure
(28%) rates. Inside of every complex problem are simple solutions. Complexity is often caused by size, conflicting goals, large
budgets, and executive sponsor egos.
CHAOS RESOLUTION BY COMPLEXITY
COMPLEXITY APPRAISAL
n Yes, for all projects 6%
n Yes, for most projects 35%
n Yes, for few projects 26%
n No 32%
We asked IT executives,
“Does your organization develop
any appraisal of complexity on its projects?” This is based on
300 responses in the SURF database.
LARGE, COMPLEX PROJECTS
n Successful 2%
n Challenged 42%
n Failed 56%
The resolution of large and
complex software projects from
FY2011–2015 within the new CHAOS database.
The resolution of all software projects by complexity from FY2011–2015 within the new CHAOS database.
SUCCESSFUL CHALLENGED FAILED
Very Complex 15% 57% 28%
Complex 18% 56% 26%
Average 28% 54% 18%
Easy 35% 49% 16%
Very Easy 38% 47% 15%
Copyright © 2015 The Standish Group International, Inc. 9
SUCCESSFUL CHALLENGED FAILED
Precise 22% 53% 25%
Close 23% 54% 23%
Loose 27% 52% 21%
Vague 38% 46% 16%
Distant 34% 58% 8%
The Standish Group has stated for many years that clear goals are achieved when all the
stakeholders are focused on and understand the core values of the project. We believed that goal
clarity and focus were essential to a successful project. However, measuring success by both the
Traditional and Modern metrics we found the opposite to be true. We coded the database with a
5-point scale, from precise to distant, in order to measure the effect on success rates. It is clear
from the research that goals closer to the organization’s strategy have the opposite effect on
higher satisfaction and success rates.
The Standish Group uses goal as one of the seven constraints as part of the Optimization Clinic. The
Optimization Clinic is the third step in our Value Portfolio Optimization and Management Service. We also use goal as one of
the measurements for our Resolution Benchmark. The Standish Group is now suggesting that your organization take action
over trying to achieve clarity. Many of the most satisfying projects start out as vague. The business objectives are dynamic as
the project progresses. Project teams should reduce or give up control of the business objectives to encourage and promote
innovation.
CHAOS RESOLUTION BY GOAL
LOW-VALUE BUSINESS PROCESSES
n Yes, we have/had a
concentrated effort 23%
n Yes, but it is
opportunistic 31%
n No, but in our plan 18%
n No plans 28%
We asked IT executives: “Do you have an active program
to optimize business processes by eliminating low-value business
processes?” This is based on 300 responses in the SURF
database.
COST/BENEFIT ANALYSIS
n Yes, we have/had a
concentrated effort 33%
n Yes, but it is
opportunistic 38%
n No, but in our plan 17%
n No plans 12%
We asked IT executives, “Do you have an active program to
optimize business processes by doing cost/benefit analysis for
new business processes?” This is based on 300 responses in the
SURF database.
The resolution of all software projects by goal from FY2011–2015 within the new CHAOS database.
Copyright © 2015 The Standish Group International, Inc. 10
Successful projects need smart, trained people. Not surprisingly, one of the key project
success factors identified in Standish Group’s CHAOS research is a competent staff. There are
five key fundamentals to ensure staff competency. First, identify the required competencies and
alternative skills. Second, provide a good, continuous training program to enhance the staff
skills. Third, recruit both internally and externally to provide a balance of experiences. Fourth,
provide incentive to motivate the staff. Finally, ensure the staff is project-focused. When a project
has both teamwork and skilled resources, it can prevail under even the direst of circumstances. To
ensure a competent staff you must match the skills of the team to correspond with the needed skills
of the project. This is one of the seven constraints we use to prioritize your project portfolio.
Here we look at project resolution by capability. The table on this page shows the resolution of all software projects by
capability from FY2011–2015 within the new CHAOS database using the Modern definition of success. The results show that
38% of gifted resources were on successful projects. Projects that had unskilled people had both the highest challenged
(60%) and failure (23%) rates. The decisions around project priority include: Do you go forward with a project if you lack
skilled capability? This decision is especially pertinent for large projects with a large staff who have a mix of good and poor
resources. This is one of the reasons that small projects have a higher success rate since small projects are easier to staff
with high-performing teams.
CHAOS RESOLUTION BY CAPABILITY
GIFTED AGILE TEAMS
n Very High Value 17%
n High Value 27%
n Average 36%
n Low 9%
n Very Low 11%
The value rating of medium to large original software development
projects with gifted agile teams from FY2011–2015 within the new
CHAOS database.
UNSKILLED AGILE TEAMS
n Very High Value 4%
n High Value 5%
n Average 19%
n Low 44%
n Very Low 28%
The value rating of medium to large original software
development projects with unskilled agile teams from FY2011–
2015 within the new CHAOS database.
The resolution of all software projects by capability from FY2011–2015 within the new CHAOS database.
SUCCESSFUL CHALLENGED FAILED
Gifted 38% 45% 17%
Talented 31% 53% 16%
Competent 28% 53% 19%
Able 24% 54% 22%
Unskilled 17% 60% 23%
Copyright © 2015 The Standish Group International, Inc. 11
As we wrote in the Factors of Success 2015 report, the table below reflects our opinion of the
importance of each attribute and our recommendation of the amount of effort and investment
that should be considered to improve project success. It is clear to us that the four primary
investments should be focused on: executive sponsorship skills, emotional maturity environment,
user involvement, and optimization services. It is our tradition to assign points to each factor to
highlight its relevance. These points should also be considered as an investment guideline for
project management improvement. For example, if you are spending $50 million on IT projects then
2% of the money should be going toward improving the value of those projects. Based on this amount,
our recommended breakdown of money to be allocated to each factor is calculated next to the point value on
the chart. So, if you want your projects to be more successful, with higher value and greater customer satisfaction, you should
carefully consider where you invest your project improvement money.
The law of diminishing returns states that in all productive processes, adding one or more factors of production, while
holding others constant, will at some point yield lower returns. Project management expertise, process methods, and tools
are affected by the physics law of diminishing returns. The proof point of this law is the United States government. The U.S.
government has the highest level of project management expertise, the most sophisticated tools, and the highest level of
governance. Yet, U.S. government projects cost exponentially more than commercial projects and have greater failure rates.
While the Factors of Success can help improve project performance, the key to project management success is moderation.
CHAOS FACTORS OF SUCCESS
FACTORS OF SUCCESS POINTS INVESTMENT
Executive Sponsorship 15 15%
Emotional Maturity 15 15%
User Involvement 15 15%
Optimization 15 15%
Skilled Resources 10 10%
Standard Architecture 8 8%
Agile Process 7 7%
Modest Execution 6 6%
Project Management Expertise 5 5%
Clear Business Objectives 4 4%
The 2015 Factors of Success. This chart reflects our opinion of the importance of each attribute and our recommendation of the amount of
effort and investment that should be considered to improve project success.
Copyright © 2015 The Standish Group International, Inc. 12
Many of the subjects within this report are subjects
of CHAOS Tuesday, our Internet radio program. These
shows include:
CHAOS Tuesday #81 CRAPOLA
CHAOS Tuesday #78 Success Redefined
CHAOS Tuesday #77 Factors of Success
CHAOS Tuesday #76 Haze
Other available research reports:
• Factors of Success 2015
• Modernization in Place
• CHAOS Manifesto 2014
• CHAOS Report 2014
• Exceeding Value
ADDITIONAL RESOURCES AND RESEARCH
RESOLUTION BENCHMARK
Our Resolution Benchmark Membership measures your project portfolio against like organizations with a similar project mix
and skill maturity.
• Count what counts
• Improve customer and user
satisfaction
• Increase project value
• Reduced project overhead
• Improve project environment
MEMBERSHIP BENEFITS
Copyright © 2015 The Standish Group International, Inc. 13
VALUE PORTFOLIO OPTIMIZATION AND MANAGEMENT SERVICE
Our Value Portfolio Optimization and Management Service is a forward-thinking and predictive visualization of the
value of your software investments.
The Value Portfolio Optimization and Management Service offers the following features:
The one thing we are not going to do is immediately change your process or try to sell you new and cumbersome tools.
It really does not matter where you are in project management maturity. Our aim is to reduce or minimize the burden
placed on you by expensive tools and complex processes. We do this through our three unique items:
Our three-step method helps you focus on things that really count.
• STEP 1: Project Skills and Environmental Orientation
• STEP 2: Individual Project Optimization & Assessments
• STEP 3: Value Optimization Clinic
FOLLOW-UP: Each quarter The Standish Group will visit your organization to update your portfolio. Our Value
Portfolio Optimization and Management Service helps you exceed and create value.
STEP 1: GETTING TO KNOW YOU
STEP 2: PROJECT PROFILES
STEP 3: OPTIMIZATION CLINIC
• High Returns on Investment
• More Innovations
• Greater Stakeholder Satisfaction
• Less Management Frustration
• Reduced Project Overhead
• Rapid
• Simple
• Comprehensive
• Inexpensive
• Comprehendible
• Research database of 50,000 projects
• Patented optimization formula
• Our insight into a broad set of projects
By focusing your project portfolio on value, our service frees your organization to create value.
Our service offers the following benefits:

More Related Content

What's hot

はまる!JPA(初学者向けライト版)
はまる!JPA(初学者向けライト版)はまる!JPA(初学者向けライト版)
はまる!JPA(初学者向けライト版)Masatoshi Tada
 
【Oracle Cloud ウェビナー】WebLogic Serverのご紹介
【Oracle Cloud ウェビナー】WebLogic Serverのご紹介【Oracle Cloud ウェビナー】WebLogic Serverのご紹介
【Oracle Cloud ウェビナー】WebLogic Serverのご紹介オラクルエンジニア通信
 
スケジュール遅延が当たり前な状況を少し良くしたいチームがその未来のためにScrumに”再”挑戦した話
スケジュール遅延が当たり前な状況を少し良くしたいチームがその未来のためにScrumに”再”挑戦した話スケジュール遅延が当たり前な状況を少し良くしたいチームがその未来のためにScrumに”再”挑戦した話
スケジュール遅延が当たり前な状況を少し良くしたいチームがその未来のためにScrumに”再”挑戦した話Rakuten Commerce Tech (Rakuten Group, Inc.)
 
Oracle Cloud Infrastructure:2022年2月度サービス・アップデート
Oracle Cloud Infrastructure:2022年2月度サービス・アップデートOracle Cloud Infrastructure:2022年2月度サービス・アップデート
Oracle Cloud Infrastructure:2022年2月度サービス・アップデートオラクルエンジニア通信
 
OCI 購入モデルの整理と Universal Credit 最新情報(2021年2月17日版)
OCI 購入モデルの整理と Universal Credit 最新情報(2021年2月17日版)OCI 購入モデルの整理と Universal Credit 最新情報(2021年2月17日版)
OCI 購入モデルの整理と Universal Credit 最新情報(2021年2月17日版)オラクルエンジニア通信
 
Building Slack's internal developer platform as a product.pdf
Building Slack's internal developer platform as a product.pdfBuilding Slack's internal developer platform as a product.pdf
Building Slack's internal developer platform as a product.pdfJavier Turégano Molina
 
Oracle Cloud Infrastructure:2021年5月度サービス・アップデート
Oracle Cloud Infrastructure:2021年5月度サービス・アップデートOracle Cloud Infrastructure:2021年5月度サービス・アップデート
Oracle Cloud Infrastructure:2021年5月度サービス・アップデートオラクルエンジニア通信
 
失敗事例にみるDbの負荷試験の重要性
失敗事例にみるDbの負荷試験の重要性失敗事例にみるDbの負荷試験の重要性
失敗事例にみるDbの負荷試験の重要性Kazu Onishi
 
Open Liberty: オープンソースになったWebSphere Liberty
Open Liberty: オープンソースになったWebSphere LibertyOpen Liberty: オープンソースになったWebSphere Liberty
Open Liberty: オープンソースになったWebSphere LibertyTakakiyo Tanaka
 
Spring Boot ユーザの方のための Quarkus 入門
Spring Boot ユーザの方のための Quarkus 入門Spring Boot ユーザの方のための Quarkus 入門
Spring Boot ユーザの方のための Quarkus 入門tsukasamannen
 
OpenJDKのコミッタってどんなことしたらなったの?解決してきた技術課題の事例から見えてくる必要な知識と技術(JJUG CCC 2023 Spring)
OpenJDKのコミッタってどんなことしたらなったの?解決してきた技術課題の事例から見えてくる必要な知識と技術(JJUG CCC 2023 Spring)OpenJDKのコミッタってどんなことしたらなったの?解決してきた技術課題の事例から見えてくる必要な知識と技術(JJUG CCC 2023 Spring)
OpenJDKのコミッタってどんなことしたらなったの?解決してきた技術課題の事例から見えてくる必要な知識と技術(JJUG CCC 2023 Spring)NTT DATA Technology & Innovation
 
Oracle Cloud Infrastructure セキュリティの取り組み [2021年8月版]
Oracle Cloud Infrastructure セキュリティの取り組み [2021年8月版]Oracle Cloud Infrastructure セキュリティの取り組み [2021年8月版]
Oracle Cloud Infrastructure セキュリティの取り組み [2021年8月版]オラクルエンジニア通信
 
簡単!AWRをEXCELピボットグラフで分析しよう♪
簡単!AWRをEXCELピボットグラフで分析しよう♪簡単!AWRをEXCELピボットグラフで分析しよう♪
簡単!AWRをEXCELピボットグラフで分析しよう♪Yohei Azekatsu
 
マジックビーンズ
マジックビーンズマジックビーンズ
マジックビーンズAkira Suenami
 

What's hot (20)

はまる!JPA(初学者向けライト版)
はまる!JPA(初学者向けライト版)はまる!JPA(初学者向けライト版)
はまる!JPA(初学者向けライト版)
 
【Oracle Cloud ウェビナー】WebLogic Serverのご紹介
【Oracle Cloud ウェビナー】WebLogic Serverのご紹介【Oracle Cloud ウェビナー】WebLogic Serverのご紹介
【Oracle Cloud ウェビナー】WebLogic Serverのご紹介
 
スケジュール遅延が当たり前な状況を少し良くしたいチームがその未来のためにScrumに”再”挑戦した話
スケジュール遅延が当たり前な状況を少し良くしたいチームがその未来のためにScrumに”再”挑戦した話スケジュール遅延が当たり前な状況を少し良くしたいチームがその未来のためにScrumに”再”挑戦した話
スケジュール遅延が当たり前な状況を少し良くしたいチームがその未来のためにScrumに”再”挑戦した話
 
Oracle Cloud Infrastructure:2022年2月度サービス・アップデート
Oracle Cloud Infrastructure:2022年2月度サービス・アップデートOracle Cloud Infrastructure:2022年2月度サービス・アップデート
Oracle Cloud Infrastructure:2022年2月度サービス・アップデート
 
Oracle Data Masking and Subsettingのご紹介
Oracle Data Masking and Subsettingのご紹介Oracle Data Masking and Subsettingのご紹介
Oracle Data Masking and Subsettingのご紹介
 
はじめてのOracle Cloud Platform
はじめてのOracle Cloud PlatformはじめてのOracle Cloud Platform
はじめてのOracle Cloud Platform
 
OCI GoldenGate Overview 2021年4月版
OCI GoldenGate Overview 2021年4月版OCI GoldenGate Overview 2021年4月版
OCI GoldenGate Overview 2021年4月版
 
OCI 購入モデルの整理と Universal Credit 最新情報(2021年2月17日版)
OCI 購入モデルの整理と Universal Credit 最新情報(2021年2月17日版)OCI 購入モデルの整理と Universal Credit 最新情報(2021年2月17日版)
OCI 購入モデルの整理と Universal Credit 最新情報(2021年2月17日版)
 
Oracle Analytics Cloud のご紹介【2021年3月版】
Oracle Analytics Cloud のご紹介【2021年3月版】Oracle Analytics Cloud のご紹介【2021年3月版】
Oracle Analytics Cloud のご紹介【2021年3月版】
 
Oracle GoldenGate アーキテクチャと基本機能
Oracle GoldenGate アーキテクチャと基本機能Oracle GoldenGate アーキテクチャと基本機能
Oracle GoldenGate アーキテクチャと基本機能
 
Oracle Spatial 概要説明資料
Oracle Spatial 概要説明資料Oracle Spatial 概要説明資料
Oracle Spatial 概要説明資料
 
Building Slack's internal developer platform as a product.pdf
Building Slack's internal developer platform as a product.pdfBuilding Slack's internal developer platform as a product.pdf
Building Slack's internal developer platform as a product.pdf
 
Oracle Cloud Infrastructure:2021年5月度サービス・アップデート
Oracle Cloud Infrastructure:2021年5月度サービス・アップデートOracle Cloud Infrastructure:2021年5月度サービス・アップデート
Oracle Cloud Infrastructure:2021年5月度サービス・アップデート
 
失敗事例にみるDbの負荷試験の重要性
失敗事例にみるDbの負荷試験の重要性失敗事例にみるDbの負荷試験の重要性
失敗事例にみるDbの負荷試験の重要性
 
Open Liberty: オープンソースになったWebSphere Liberty
Open Liberty: オープンソースになったWebSphere LibertyOpen Liberty: オープンソースになったWebSphere Liberty
Open Liberty: オープンソースになったWebSphere Liberty
 
Spring Boot ユーザの方のための Quarkus 入門
Spring Boot ユーザの方のための Quarkus 入門Spring Boot ユーザの方のための Quarkus 入門
Spring Boot ユーザの方のための Quarkus 入門
 
OpenJDKのコミッタってどんなことしたらなったの?解決してきた技術課題の事例から見えてくる必要な知識と技術(JJUG CCC 2023 Spring)
OpenJDKのコミッタってどんなことしたらなったの?解決してきた技術課題の事例から見えてくる必要な知識と技術(JJUG CCC 2023 Spring)OpenJDKのコミッタってどんなことしたらなったの?解決してきた技術課題の事例から見えてくる必要な知識と技術(JJUG CCC 2023 Spring)
OpenJDKのコミッタってどんなことしたらなったの?解決してきた技術課題の事例から見えてくる必要な知識と技術(JJUG CCC 2023 Spring)
 
Oracle Cloud Infrastructure セキュリティの取り組み [2021年8月版]
Oracle Cloud Infrastructure セキュリティの取り組み [2021年8月版]Oracle Cloud Infrastructure セキュリティの取り組み [2021年8月版]
Oracle Cloud Infrastructure セキュリティの取り組み [2021年8月版]
 
簡単!AWRをEXCELピボットグラフで分析しよう♪
簡単!AWRをEXCELピボットグラフで分析しよう♪簡単!AWRをEXCELピボットグラフで分析しよう♪
簡単!AWRをEXCELピボットグラフで分析しよう♪
 
マジックビーンズ
マジックビーンズマジックビーンズ
マジックビーンズ
 

Similar to Chaos Report - 2015

Hp application portfolio management software
Hp application portfolio management softwareHp application portfolio management software
Hp application portfolio management softwareHP Enterprise Italia
 
HP Project and Portfolio Management
HP Project and Portfolio ManagementHP Project and Portfolio Management
HP Project and Portfolio ManagementHP Enterprise Italia
 
Power to the People! Shifting from Project to Product with Tasktop Viz
Power to the People! Shifting from Project to Product with Tasktop VizPower to the People! Shifting from Project to Product with Tasktop Viz
Power to the People! Shifting from Project to Product with Tasktop VizTasktop
 
Integrated Performance Management Scorecard
Integrated Performance Management ScorecardIntegrated Performance Management Scorecard
Integrated Performance Management ScorecardSaravanan Veeraiyan
 
2011 summit office of the cio presentation galit
2011 summit office of the cio presentation galit2011 summit office of the cio presentation galit
2011 summit office of the cio presentation galitGalit Fein
 
World Quality Report 2015 - 16
World Quality Report 2015 - 16World Quality Report 2015 - 16
World Quality Report 2015 - 16Piotr Kula
 
The five most critical project metrics
The five most critical project metricsThe five most critical project metrics
The five most critical project metricsDadunoor Kamati
 
Digital products development: going behind the scene of product development -...
Digital products development: going behind the scene of product development -...Digital products development: going behind the scene of product development -...
Digital products development: going behind the scene of product development -...OgilvyOne Worldwide
 
Business Guide for Supply Chain Leaders for S&OP in the Pandemic
Business Guide for Supply Chain Leaders for S&OP in the PandemicBusiness Guide for Supply Chain Leaders for S&OP in the Pandemic
Business Guide for Supply Chain Leaders for S&OP in the PandemicLora Cecere
 
Sales and Operations Planning: A Guide for the Supply Chain Leader
Sales and Operations Planning: A Guide for the Supply Chain LeaderSales and Operations Planning: A Guide for the Supply Chain Leader
Sales and Operations Planning: A Guide for the Supply Chain LeaderLora Cecere
 
5 must have project management reports
5 must have project management reports5 must have project management reports
5 must have project management reportsOrangescrum
 
Deltek Clarity A&E Industry Study - Houston, TX
Deltek Clarity A&E Industry Study - Houston, TXDeltek Clarity A&E Industry Study - Houston, TX
Deltek Clarity A&E Industry Study - Houston, TXBCS ProSoft
 
BARC BI - Encuesta sobre Business Intelligence
BARC BI - Encuesta sobre Business IntelligenceBARC BI - Encuesta sobre Business Intelligence
BARC BI - Encuesta sobre Business IntelligenceRollup Consulting
 
Online Intelligence- POL
Online Intelligence- POLOnline Intelligence- POL
Online Intelligence- POLDavid Barak
 
2010-11 World Quality Report
2010-11 World Quality Report2010-11 World Quality Report
2010-11 World Quality ReportCapgemini
 
guide-finance-transformation-in-the-digital-age
guide-finance-transformation-in-the-digital-ageguide-finance-transformation-in-the-digital-age
guide-finance-transformation-in-the-digital-ageMagdalena Matell
 
From PPM to Enterprise Portfolio Management - 051214
From PPM to Enterprise Portfolio Management - 051214From PPM to Enterprise Portfolio Management - 051214
From PPM to Enterprise Portfolio Management - 051214UMT360
 
Eurogroup Consulting: a new perspective on operational excellence
Eurogroup Consulting: a new perspective on operational excellenceEurogroup Consulting: a new perspective on operational excellence
Eurogroup Consulting: a new perspective on operational excellenceEurogroup Consulting NEDERLAND
 

Similar to Chaos Report - 2015 (20)

Hp application portfolio management software
Hp application portfolio management softwareHp application portfolio management software
Hp application portfolio management software
 
HP Project and Portfolio Management
HP Project and Portfolio ManagementHP Project and Portfolio Management
HP Project and Portfolio Management
 
Power to the People! Shifting from Project to Product with Tasktop Viz
Power to the People! Shifting from Project to Product with Tasktop VizPower to the People! Shifting from Project to Product with Tasktop Viz
Power to the People! Shifting from Project to Product with Tasktop Viz
 
Integrated Performance Management Scorecard
Integrated Performance Management ScorecardIntegrated Performance Management Scorecard
Integrated Performance Management Scorecard
 
2011 summit office of the cio presentation galit
2011 summit office of the cio presentation galit2011 summit office of the cio presentation galit
2011 summit office of the cio presentation galit
 
World Quality Report 2015 - 16
World Quality Report 2015 - 16World Quality Report 2015 - 16
World Quality Report 2015 - 16
 
The five most critical project metrics
The five most critical project metricsThe five most critical project metrics
The five most critical project metrics
 
Digital products development: going behind the scene of product development -...
Digital products development: going behind the scene of product development -...Digital products development: going behind the scene of product development -...
Digital products development: going behind the scene of product development -...
 
Pbs Erp Economy
Pbs Erp EconomyPbs Erp Economy
Pbs Erp Economy
 
Business Guide for Supply Chain Leaders for S&OP in the Pandemic
Business Guide for Supply Chain Leaders for S&OP in the PandemicBusiness Guide for Supply Chain Leaders for S&OP in the Pandemic
Business Guide for Supply Chain Leaders for S&OP in the Pandemic
 
Sales and Operations Planning: A Guide for the Supply Chain Leader
Sales and Operations Planning: A Guide for the Supply Chain LeaderSales and Operations Planning: A Guide for the Supply Chain Leader
Sales and Operations Planning: A Guide for the Supply Chain Leader
 
5 must have project management reports
5 must have project management reports5 must have project management reports
5 must have project management reports
 
Deltek Clarity A&E Industry Study - Houston, TX
Deltek Clarity A&E Industry Study - Houston, TXDeltek Clarity A&E Industry Study - Houston, TX
Deltek Clarity A&E Industry Study - Houston, TX
 
BARC BI - Encuesta sobre Business Intelligence
BARC BI - Encuesta sobre Business IntelligenceBARC BI - Encuesta sobre Business Intelligence
BARC BI - Encuesta sobre Business Intelligence
 
SOA Migration Services | Torry Harris
SOA Migration Services | Torry HarrisSOA Migration Services | Torry Harris
SOA Migration Services | Torry Harris
 
Online Intelligence- POL
Online Intelligence- POLOnline Intelligence- POL
Online Intelligence- POL
 
2010-11 World Quality Report
2010-11 World Quality Report2010-11 World Quality Report
2010-11 World Quality Report
 
guide-finance-transformation-in-the-digital-age
guide-finance-transformation-in-the-digital-ageguide-finance-transformation-in-the-digital-age
guide-finance-transformation-in-the-digital-age
 
From PPM to Enterprise Portfolio Management - 051214
From PPM to Enterprise Portfolio Management - 051214From PPM to Enterprise Portfolio Management - 051214
From PPM to Enterprise Portfolio Management - 051214
 
Eurogroup Consulting: a new perspective on operational excellence
Eurogroup Consulting: a new perspective on operational excellenceEurogroup Consulting: a new perspective on operational excellence
Eurogroup Consulting: a new perspective on operational excellence
 

More from Mateusz Żeromski

More from Mateusz Żeromski (20)

Nexus - Scaled Scrum - Poster 17x11
Nexus - Scaled Scrum - Poster 17x11Nexus - Scaled Scrum - Poster 17x11
Nexus - Scaled Scrum - Poster 17x11
 
Scrum Cheatsheet
Scrum CheatsheetScrum Cheatsheet
Scrum Cheatsheet
 
The Product Canvas_11.10.16
The Product Canvas_11.10.16The Product Canvas_11.10.16
The Product Canvas_11.10.16
 
Life Change Stress Test
Life Change Stress TestLife Change Stress Test
Life Change Stress Test
 
Scrum Values - POSTER
Scrum Values - POSTERScrum Values - POSTER
Scrum Values - POSTER
 
Scrum Framework - POSTER 17x11
Scrum Framework - POSTER 17x11Scrum Framework - POSTER 17x11
Scrum Framework - POSTER 17x11
 
2019 Scrum Master Trends
2019 Scrum Master Trends2019 Scrum Master Trends
2019 Scrum Master Trends
 
Chaos Report 2015
Chaos Report 2015Chaos Report 2015
Chaos Report 2015
 
Scrum Checklist
Scrum ChecklistScrum Checklist
Scrum Checklist
 
Version one 10th-annual-state-of-agile-report
Version one 10th-annual-state-of-agile-reportVersion one 10th-annual-state-of-agile-report
Version one 10th-annual-state-of-agile-report
 
Typy problemów
Typy problemów Typy problemów
Typy problemów
 
Historia Agile & Scrum
Historia  Agile & ScrumHistoria  Agile & Scrum
Historia Agile & Scrum
 
Jak zastapic Scrum Mastera
Jak zastapic Scrum MasteraJak zastapic Scrum Mastera
Jak zastapic Scrum Mastera
 
Dział to nie zespół
Dział to nie zespółDział to nie zespół
Dział to nie zespół
 
Scrum is not #perfect
Scrum is not #perfectScrum is not #perfect
Scrum is not #perfect
 
Komunikacja w zespole
Komunikacja w zespoleKomunikacja w zespole
Komunikacja w zespole
 
In the Scrum the PO role is a key
In the Scrum the PO role is a keyIn the Scrum the PO role is a key
In the Scrum the PO role is a key
 
Retrospektywa Scrum
Retrospektywa ScrumRetrospektywa Scrum
Retrospektywa Scrum
 
New leader is not a Scrum Master!
New leader is not a Scrum Master!New leader is not a Scrum Master!
New leader is not a Scrum Master!
 
Scrum Master - 8 stances - images for trainings
Scrum Master - 8 stances -  images for trainingsScrum Master - 8 stances -  images for trainings
Scrum Master - 8 stances - images for trainings
 

Recently uploaded

Mythology Quiz-4th April 2024, Quiz Club NITW
Mythology Quiz-4th April 2024, Quiz Club NITWMythology Quiz-4th April 2024, Quiz Club NITW
Mythology Quiz-4th April 2024, Quiz Club NITWQuiz Club NITW
 
ClimART Action | eTwinning Project
ClimART Action    |    eTwinning ProjectClimART Action    |    eTwinning Project
ClimART Action | eTwinning Projectjordimapav
 
Q-Factor HISPOL Quiz-6th April 2024, Quiz Club NITW
Q-Factor HISPOL Quiz-6th April 2024, Quiz Club NITWQ-Factor HISPOL Quiz-6th April 2024, Quiz Club NITW
Q-Factor HISPOL Quiz-6th April 2024, Quiz Club NITWQuiz Club NITW
 
PART 1 - CHAPTER 1 - CELL THE FUNDAMENTAL UNIT OF LIFE
PART 1 - CHAPTER 1 - CELL THE FUNDAMENTAL UNIT OF LIFEPART 1 - CHAPTER 1 - CELL THE FUNDAMENTAL UNIT OF LIFE
PART 1 - CHAPTER 1 - CELL THE FUNDAMENTAL UNIT OF LIFEMISSRITIMABIOLOGYEXP
 
CLASSIFICATION OF ANTI - CANCER DRUGS.pptx
CLASSIFICATION OF ANTI - CANCER DRUGS.pptxCLASSIFICATION OF ANTI - CANCER DRUGS.pptx
CLASSIFICATION OF ANTI - CANCER DRUGS.pptxAnupam32727
 
Tree View Decoration Attribute in the Odoo 17
Tree View Decoration Attribute in the Odoo 17Tree View Decoration Attribute in the Odoo 17
Tree View Decoration Attribute in the Odoo 17Celine George
 
Q-Factor General Quiz-7th April 2024, Quiz Club NITW
Q-Factor General Quiz-7th April 2024, Quiz Club NITWQ-Factor General Quiz-7th April 2024, Quiz Club NITW
Q-Factor General Quiz-7th April 2024, Quiz Club NITWQuiz Club NITW
 
BÀI TẬP BỔ TRỢ TIẾNG ANH 11 THEO ĐƠN VỊ BÀI HỌC - CẢ NĂM - CÓ FILE NGHE (GLOB...
BÀI TẬP BỔ TRỢ TIẾNG ANH 11 THEO ĐƠN VỊ BÀI HỌC - CẢ NĂM - CÓ FILE NGHE (GLOB...BÀI TẬP BỔ TRỢ TIẾNG ANH 11 THEO ĐƠN VỊ BÀI HỌC - CẢ NĂM - CÓ FILE NGHE (GLOB...
BÀI TẬP BỔ TRỢ TIẾNG ANH 11 THEO ĐƠN VỊ BÀI HỌC - CẢ NĂM - CÓ FILE NGHE (GLOB...Nguyen Thanh Tu Collection
 
The role of Geography in climate education: science and active citizenship
The role of Geography in climate education: science and active citizenshipThe role of Geography in climate education: science and active citizenship
The role of Geography in climate education: science and active citizenshipKarl Donert
 
Sulphonamides, mechanisms and their uses
Sulphonamides, mechanisms and their usesSulphonamides, mechanisms and their uses
Sulphonamides, mechanisms and their usesVijayaLaxmi84
 
CHUYÊN ĐỀ ÔN THEO CÂU CHO HỌC SINH LỚP 12 ĐỂ ĐẠT ĐIỂM 5+ THI TỐT NGHIỆP THPT ...
CHUYÊN ĐỀ ÔN THEO CÂU CHO HỌC SINH LỚP 12 ĐỂ ĐẠT ĐIỂM 5+ THI TỐT NGHIỆP THPT ...CHUYÊN ĐỀ ÔN THEO CÂU CHO HỌC SINH LỚP 12 ĐỂ ĐẠT ĐIỂM 5+ THI TỐT NGHIỆP THPT ...
CHUYÊN ĐỀ ÔN THEO CÂU CHO HỌC SINH LỚP 12 ĐỂ ĐẠT ĐIỂM 5+ THI TỐT NGHIỆP THPT ...Nguyen Thanh Tu Collection
 
Scientific Writing :Research Discourse
Scientific  Writing :Research  DiscourseScientific  Writing :Research  Discourse
Scientific Writing :Research DiscourseAnita GoswamiGiri
 
BÀI TẬP BỔ TRỢ TIẾNG ANH 8 - I-LEARN SMART WORLD - CẢ NĂM - CÓ FILE NGHE (BẢN...
BÀI TẬP BỔ TRỢ TIẾNG ANH 8 - I-LEARN SMART WORLD - CẢ NĂM - CÓ FILE NGHE (BẢN...BÀI TẬP BỔ TRỢ TIẾNG ANH 8 - I-LEARN SMART WORLD - CẢ NĂM - CÓ FILE NGHE (BẢN...
BÀI TẬP BỔ TRỢ TIẾNG ANH 8 - I-LEARN SMART WORLD - CẢ NĂM - CÓ FILE NGHE (BẢN...Nguyen Thanh Tu Collection
 
Employablity presentation and Future Career Plan.pptx
Employablity presentation and Future Career Plan.pptxEmployablity presentation and Future Career Plan.pptx
Employablity presentation and Future Career Plan.pptxryandux83rd
 
Indexing Structures in Database Management system.pdf
Indexing Structures in Database Management system.pdfIndexing Structures in Database Management system.pdf
Indexing Structures in Database Management system.pdfChristalin Nelson
 
DiskStorage_BasicFileStructuresandHashing.pdf
DiskStorage_BasicFileStructuresandHashing.pdfDiskStorage_BasicFileStructuresandHashing.pdf
DiskStorage_BasicFileStructuresandHashing.pdfChristalin Nelson
 
Congestive Cardiac Failure..presentation
Congestive Cardiac Failure..presentationCongestive Cardiac Failure..presentation
Congestive Cardiac Failure..presentationdeepaannamalai16
 
Healthy Minds, Flourishing Lives: A Philosophical Approach to Mental Health a...
Healthy Minds, Flourishing Lives: A Philosophical Approach to Mental Health a...Healthy Minds, Flourishing Lives: A Philosophical Approach to Mental Health a...
Healthy Minds, Flourishing Lives: A Philosophical Approach to Mental Health a...Osopher
 
An Overview of the Calendar App in Odoo 17 ERP
An Overview of the Calendar App in Odoo 17 ERPAn Overview of the Calendar App in Odoo 17 ERP
An Overview of the Calendar App in Odoo 17 ERPCeline George
 

Recently uploaded (20)

Faculty Profile prashantha K EEE dept Sri Sairam college of Engineering
Faculty Profile prashantha K EEE dept Sri Sairam college of EngineeringFaculty Profile prashantha K EEE dept Sri Sairam college of Engineering
Faculty Profile prashantha K EEE dept Sri Sairam college of Engineering
 
Mythology Quiz-4th April 2024, Quiz Club NITW
Mythology Quiz-4th April 2024, Quiz Club NITWMythology Quiz-4th April 2024, Quiz Club NITW
Mythology Quiz-4th April 2024, Quiz Club NITW
 
ClimART Action | eTwinning Project
ClimART Action    |    eTwinning ProjectClimART Action    |    eTwinning Project
ClimART Action | eTwinning Project
 
Q-Factor HISPOL Quiz-6th April 2024, Quiz Club NITW
Q-Factor HISPOL Quiz-6th April 2024, Quiz Club NITWQ-Factor HISPOL Quiz-6th April 2024, Quiz Club NITW
Q-Factor HISPOL Quiz-6th April 2024, Quiz Club NITW
 
PART 1 - CHAPTER 1 - CELL THE FUNDAMENTAL UNIT OF LIFE
PART 1 - CHAPTER 1 - CELL THE FUNDAMENTAL UNIT OF LIFEPART 1 - CHAPTER 1 - CELL THE FUNDAMENTAL UNIT OF LIFE
PART 1 - CHAPTER 1 - CELL THE FUNDAMENTAL UNIT OF LIFE
 
CLASSIFICATION OF ANTI - CANCER DRUGS.pptx
CLASSIFICATION OF ANTI - CANCER DRUGS.pptxCLASSIFICATION OF ANTI - CANCER DRUGS.pptx
CLASSIFICATION OF ANTI - CANCER DRUGS.pptx
 
Tree View Decoration Attribute in the Odoo 17
Tree View Decoration Attribute in the Odoo 17Tree View Decoration Attribute in the Odoo 17
Tree View Decoration Attribute in the Odoo 17
 
Q-Factor General Quiz-7th April 2024, Quiz Club NITW
Q-Factor General Quiz-7th April 2024, Quiz Club NITWQ-Factor General Quiz-7th April 2024, Quiz Club NITW
Q-Factor General Quiz-7th April 2024, Quiz Club NITW
 
BÀI TẬP BỔ TRỢ TIẾNG ANH 11 THEO ĐƠN VỊ BÀI HỌC - CẢ NĂM - CÓ FILE NGHE (GLOB...
BÀI TẬP BỔ TRỢ TIẾNG ANH 11 THEO ĐƠN VỊ BÀI HỌC - CẢ NĂM - CÓ FILE NGHE (GLOB...BÀI TẬP BỔ TRỢ TIẾNG ANH 11 THEO ĐƠN VỊ BÀI HỌC - CẢ NĂM - CÓ FILE NGHE (GLOB...
BÀI TẬP BỔ TRỢ TIẾNG ANH 11 THEO ĐƠN VỊ BÀI HỌC - CẢ NĂM - CÓ FILE NGHE (GLOB...
 
The role of Geography in climate education: science and active citizenship
The role of Geography in climate education: science and active citizenshipThe role of Geography in climate education: science and active citizenship
The role of Geography in climate education: science and active citizenship
 
Sulphonamides, mechanisms and their uses
Sulphonamides, mechanisms and their usesSulphonamides, mechanisms and their uses
Sulphonamides, mechanisms and their uses
 
CHUYÊN ĐỀ ÔN THEO CÂU CHO HỌC SINH LỚP 12 ĐỂ ĐẠT ĐIỂM 5+ THI TỐT NGHIỆP THPT ...
CHUYÊN ĐỀ ÔN THEO CÂU CHO HỌC SINH LỚP 12 ĐỂ ĐẠT ĐIỂM 5+ THI TỐT NGHIỆP THPT ...CHUYÊN ĐỀ ÔN THEO CÂU CHO HỌC SINH LỚP 12 ĐỂ ĐẠT ĐIỂM 5+ THI TỐT NGHIỆP THPT ...
CHUYÊN ĐỀ ÔN THEO CÂU CHO HỌC SINH LỚP 12 ĐỂ ĐẠT ĐIỂM 5+ THI TỐT NGHIỆP THPT ...
 
Scientific Writing :Research Discourse
Scientific  Writing :Research  DiscourseScientific  Writing :Research  Discourse
Scientific Writing :Research Discourse
 
BÀI TẬP BỔ TRỢ TIẾNG ANH 8 - I-LEARN SMART WORLD - CẢ NĂM - CÓ FILE NGHE (BẢN...
BÀI TẬP BỔ TRỢ TIẾNG ANH 8 - I-LEARN SMART WORLD - CẢ NĂM - CÓ FILE NGHE (BẢN...BÀI TẬP BỔ TRỢ TIẾNG ANH 8 - I-LEARN SMART WORLD - CẢ NĂM - CÓ FILE NGHE (BẢN...
BÀI TẬP BỔ TRỢ TIẾNG ANH 8 - I-LEARN SMART WORLD - CẢ NĂM - CÓ FILE NGHE (BẢN...
 
Employablity presentation and Future Career Plan.pptx
Employablity presentation and Future Career Plan.pptxEmployablity presentation and Future Career Plan.pptx
Employablity presentation and Future Career Plan.pptx
 
Indexing Structures in Database Management system.pdf
Indexing Structures in Database Management system.pdfIndexing Structures in Database Management system.pdf
Indexing Structures in Database Management system.pdf
 
DiskStorage_BasicFileStructuresandHashing.pdf
DiskStorage_BasicFileStructuresandHashing.pdfDiskStorage_BasicFileStructuresandHashing.pdf
DiskStorage_BasicFileStructuresandHashing.pdf
 
Congestive Cardiac Failure..presentation
Congestive Cardiac Failure..presentationCongestive Cardiac Failure..presentation
Congestive Cardiac Failure..presentation
 
Healthy Minds, Flourishing Lives: A Philosophical Approach to Mental Health a...
Healthy Minds, Flourishing Lives: A Philosophical Approach to Mental Health a...Healthy Minds, Flourishing Lives: A Philosophical Approach to Mental Health a...
Healthy Minds, Flourishing Lives: A Philosophical Approach to Mental Health a...
 
An Overview of the Calendar App in Odoo 17 ERP
An Overview of the Calendar App in Odoo 17 ERPAn Overview of the Calendar App in Odoo 17 ERP
An Overview of the Calendar App in Odoo 17 ERP
 

Chaos Report - 2015

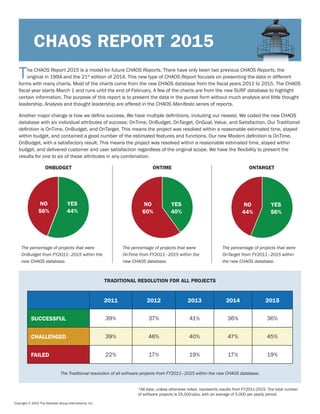
  • 1. The CHAOS Report 2015 is a model for future CHAOS Reports. There have only been two previous CHAOS Reports, the original in 1994 and the 21st edition of 2014. This new type of CHAOS Report focuses on presenting the data in different forms with many charts. Most of the charts come from the new CHAOS database from the fiscal years 2011 to 2015. The CHAOS fiscal year starts March 1 and runs until the end of February. A few of the charts are from the new SURF database to highlight certain information. The purpose of this report is to present the data in the purest form without much analysis and little thought leadership. Analysis and thought leadership are offered in the CHAOS Manifesto series of reports. Another major change is how we define success. We have multiple definitions, including our newest. We coded the new CHAOS database with six individual attributes of success: OnTime, OnBudget, OnTarget, OnGoal, Value, and Satisfaction. Our Traditional definition is OnTime, OnBudget, and OnTarget. This means the project was resolved within a reasonable estimated time, stayed within budget, and contained a good number of the estimated features and functions. Our new Modern definition is OnTime, OnBudget, with a satisfactory result. This means the project was resolved within a reasonable estimated time, stayed within budget, and delivered customer and user satisfaction regardless of the original scope. We have the flexibility to present the results for one to six of these attributes in any combination. Copyright © 2015 The Standish Group International, Inc. CHAOS REPORT 2015 TRADITIONAL RESOLUTION FOR ALL PROJECTS ONBUDGET ONTIME ONTARGET The Traditional resolution of all software projects from FY2011–2015 within the new CHAOS database. The percentage of projects that were OnBudget from FY2011–2015 within the new CHAOS database. The percentage of projects that were OnTime from FY2011–2015 within the new CHAOS database. The percentage of projects that were OnTarget from FY2011–2015 within the new CHAOS database. *All data, unless otherwise noted, represents results from FY2011-2015. The total number of software projects is 25,000-plus, with an average of 5,000 per yearly period. NO 56% NO 60% NO 44% YES 44% YES 40% YES 56% 2011 2012 2013 2014 2015 SUCCESSFUL 39% 37% 41% 36% 36% CHALLENGED 39% 46% 40% 47% 45% FAILED 22% 17% 19% 17% 19%
  • 2. Copyright © 2015 The Standish Group International, Inc. 2 2011 2012 2013 2014 2015 SUCCESSFUL 29% 27% 31% 28% 29% CHALLENGED 49% 56% 50% 55% 52% FAILED 22% 17% 19% 17% 19% Our Modern Resolution definition is OnTime, OnBudget, with a satisfactory result. This definition encompasses both a success rate for the project management of a project and for the project itself. The Traditional Resolution of OnTime, OnBudget, and OnTarget clearly supports the goals of project management, but not the customer or user of the product or project. The reason we consider this to be the best definition is that it combines the project management process and the end results of a project. We have seen many projects that meet the triple constraints of OnTime, OnBudget, and OnTarget, but the customer was not satisfied with the outcome. This is evident in the data, which shows a 7% decrease in the success rate and a 7% increase in the challenged rate. In changing from the OnTarget constraint to satisfactory we avoid penalizing a project for having an evolving target, which all projects have, even the very small ones. Customers have a clear opinion on the satisfaction level whether or not all the features and functions that they asked for in the beginning of the project are realized. In our research we found that both satisfaction and value are greater when the features and functions delivered are much less than originally specified and only meet obvious needs. In other research we found that most features and functions of software are not used. These additional features increase cost, risk, and quality but do not necessarily provide value. MODERN RESOLUTION FOR ALL PROJECTS VALUABLE ONGOAL SATISFACTORY The Modern Resolution (OnTime, OnBudget, with a satisfactory result) of all software projects from FY2011–2015 within the new CHAOS database. Please note that for the rest of this report CHAOS Resolution will refer to the Modern Resolution definition not the Traditional Resolution definition. The percentage of projects considered valuable from FY2011–2015 within the new CHAOS database. The percentage of projects that were OnGoal from FY2011–2015 within the new CHAOS database. The percentage of projects considered satisfactory from FY2011–2015 within the new CHAOS database. NO 38% NO 44% NO 41% YES 59% YES 62% YES 56%
  • 3. Copyright © 2015 The Standish Group International, Inc. 3 Project size has always been a major element in the CHAOS research. It was clear from the very beginning of the CHAOS research that size was the single most important factor in the resolution of project outcome. On this page we show two tables: resolution of all software projects by size; and size of the software projects by resolution. These tables clearly show the impact of size on the results of Ontime, OnBudget, with a satisfactory result. It is also clear that the larger the project, the less valuable the return rate. In many cases larger projects never return value to an organization. The faster the projects go into production the quicker the payback starts to accumulate. One of the major services of our Value Portfolio Optimization and Management Service is to break up large software projects into multiple small projects, with early delivery for success, quicker return on value, and greater customer and user satisfaction. We have found that most software projects only require a small team for a short duration in order to deliver value to the organization; only in very rare cases do projects need to be larger and longer. Most, if not all, large, complex, multi-year projects are unnecessary. This is especially true for standard infrastructure software— such as middleware, databases, and system management. PROJECT SIZE BY CHAOS RESOLUTION CHAOS RESOLUTION BY PROJECT SIZE SUCCESSFUL CHALLENGED FAILED TOTAL Grand 6% 51% 43% 100% Large 11% 59% 30% 100% Medium 12% 62% 26% 100% Moderate 24% 64% 12% 100% Small 61% 32% 7% 100% SUCCESSFUL CHALLENGED FAILED Grand 2% 7% 17% Large 6% 17% 24% Medium 9% 26% 31% Moderate 21% 32% 17% Small 62% 16% 11% TOTAL 100% 100% 100% VALUE FOR LARGE PROJECTS n Very High Value 4% n High Value 14% n Average 23% n Low 16% n Very Low 43% The return of value for large projects from FY2011– to 2015 within the new CHAOS database. VALUE FOR SMALL PROJECTS n Very High Value 17% n High Value 27% n Average 36% n Low 9% n Very Low 11% The return of value for small projects from FY2011– 2015 within the new CHAOS database. The size of software projects by the Modern Resolution definition from FY2011–2015 within the new CHAOS database. The resolution of all software projects by size from FY2011–2015 within the new CHAOS database.
  • 4. Copyright © 2015 The Standish Group International, Inc. 4 Looking at project resolution by industry provides another view of the CHAOS database. The table on this page shows the resolution of all software projects by industry from FY2011–2015 within the new CHAOS database. The results show that retail projects had the highest success rate at 35% using the Modern definition of success. The results also show that government projects had the highest failure rate at 24%, and financial and government projects had the highest challenged rate at 56%. The comparison of satisfaction level for banking versus retail shows that retail also has better results. Many of our Benchmark clients like to compare their results to other organizations in the same industry and we do this as matter of course. However, we found that industry is not the most accurate or important metric of comparison. The most accurate is to consider industry as a minor filter, with project type, size, skills, and methodology as primary filters. Other minor filters would include organizational size and geography. In our Resolution Benchmark Membership we use this technique to benchmark project portfolios. CHAOS RESOLUTION BY INDUSTRY BANKING PROJECTS n Very Satisfied 9% n Satisfied 21% n Somewhat Satisfied 28% n Not Satisfied 19% n Disappointed 23% The satisfaction level for banking projects from FY2011–2015 within the new CHAOS database. RETAIL PROJECTS n Very Satisfied 12% n Satisfied 27% n Somewhat Satisfied 32% n Not Satisfied 18% n Disappointed 11% The satisfaction level for retail projects from FY2011–2015 within the new CHAOS database. SUCCESSFUL CHALLENGED FAILED Banking 30% 55% 15% Financial 29% 56% 15% Government 21% 55% 24% Healthcare 29% 53% 18% Manufacturing 28% 53% 19% Retail 35% 49% 16% Services 29% 52% 19% Telecom 24% 53% 23% Other 29% 48% 23% The resolution of all software projects by industry from FY2011–2015 within the new CHAOS database.
  • 5. Copyright © 2015 The Standish Group International, Inc. 5 PROJECT SELECTION PROCESS n Only the boss/senior executive 27% n There is a formal process to do it 50% n Each sector defines its own priorities 21% n It is very varied or I do not know 3% We asked the 37% of SURF respondents who said that the key executive sponsor sets the budget with the project team, “In general, who participates in project selection/approval in your organization?” This is based on 111 responses in the SURF database. In our CHAOS Report 2014 we showed that project resolution differed slightly by most of the areas of the world. In that report we used the traditional success metrics of OnTime, OnBudget, and OnTarget. In this report we used the Modern definition of success of Ontime, OnBudget, with a satisfactory result. We see a major bifurcation with North America and the rest of the world; North America has a 31% success rate versus Europe at 25%, Asia at 22%, and the rest of world at 24%. We have seen that North America has some of the highest emotional maturity skills. These skills include managing expectations and gaining consensus, which in turn would cause a high satisfaction level. On the other hand, Asia has the lowest emotional maturity scores according to our emotional maturity appraisals and benchmarks. As we reported in the Factors of Success 2015 report, emotional maturity is the second-ranked Factor of Success. In that report we stated that having a skilled emotional maturity environment helps 80% of projects enjoy success. The No. 1 Factor of Success is a skilled executive sponsor. These two factors, along with the other eight, are appraised as the first step in the Resolution Benchmark. If we find during the skills appraisal that the executive sponsorships and/or emotional maturity skills are deficient then we will provide advice on how to improve the score and help improve future Benchmark results. For more information on the Factors of Success, please see the Factors of Success 2015 report. CHAOS RESOLUTION BY AREA OF THE WORLD BUDGET PROCESS n Key executive sponsor sets the budget with project team 37% n Users set the budget with the project team 7% n All stakeholders are involved in the budget 31% n The CFO sets the limit on the budget 17% n Other 8% We asked IT executives, “What is your general practice on project budgeting and cost collaboration?” This is based on 300 responses in the SURF database. The resolution of all software projects from FY2011–2015 by the four major areas of the world. SUCCESSFUL CHALLENGED FAILED North America 31% 51% 18% Europe 25% 56% 19% Asia 22% 58% 20% Rest of World 24% 55% 21%
  • 6. Copyright © 2015 The Standish Group International, Inc. 6 The type of project has a major effect on resolution. The table on this page shows the resolution of all software projects by project type from FY2011–2015 within the new CHAOS database using the Modern definition of success. Projects using a purchased application with no modification had the highest success rate at 57%. Projects that were developed from scratch using modern methodologies had a 23% failure rate. This is the highest failure rate other than the “other” category. The results also show that projects that were developed from scratch using traditional languages and methods had the highest challenged rate at 61%. Modernization projects had the second highest success rate at 53%. The Standish Group has a very specific definition and development method for modernization projects. In fact, we modified “modernization” by adding “in place” so as not to confuse the general modernization of applications by the other techniques such as developing from scratch using modern methodologies or purchasing components. For more information on modernization in place, please see our Modernization in Place report. PROJECT TYPE SUCCESSFUL CHALLENGED FAILED Developed from scratch using traditional languages and methods 22% 61% 17% Developed from scratch using modern methodologies 23% 54% 23% Developed some components and purchased others 24% 59% 17% Purchased components and assembled the application 25% 59% 16% Purchased application and modified 42% 37% 21% Purchased application and performed no modifications 57% 28% 15% Modernization 53% 38% 9% Other 28% 47% 25% GAIN VERSUS RISK METRICS n Painful 31% n Restrained 68% n Painless 1% We asked the 40% of SURF respondents who said they do not calculate individual requirements, “How would you describe your organization’s efforts in developing and maintaining financial and risk metrics for project requirements?” This is based on 121 responses in the SURF database. CHAOS RESOLUTION BY PROJECT TYPE ROI FOR REQUIREMENTS n Calculate overall project and allocate over individual requirements 15% n Calculate each requirement and add up to overall project ROI 14% n Calculate overall project, calculate major requirements, and allocate the rest 30% n Do not calculate individual requirements 40% We asked IT executives, “How do you calculate ROI for individual requirements?” This is based on 300 responses in the SURF database. The resolution of all software projects by project type from FY2011–2015 within the new CHAOS database.
  • 7. Copyright © 2015 The Standish Group International, Inc. 7 The table on this page compares the resolution of all software projects from FY2011–2015 within the new CHAOS database, segmented by the agile process and waterfall method. The total number of software projects is more than 10,000. The results for all projects show that agile projects have almost four times the success rate as waterfall projects, and waterfall projects have three times the failure rate as agile projects. The results are also broken down by project size: large, medium, and small. The overall results clearly show that waterfall projects do not scale well, while agile projects scale much better. However, note that the smaller the project, the smaller the difference is between the agile and the waterfall process. As we stated in the Factors of Success 2015 report, we have identified two trump cards that together create a winning hand. The trump cards are the agile process and small projects. As measured by Modern metrics, small projects using an agile process only have a 4% failure rate. For more information on trump cards, please see the Factors of Success 2015 report. CHAOS RESOLUTION BY AGILE VERSUS WATERFALL SIZE METHOD SUCCESSFUL CHALLENGED FAILED All Size Projects Agile 39% 52% 9% Waterfall 11% 60% 29% Large Size Projects Agile 18% 59% 23% Waterfall 3% 55% 42% Medium Size Projects Agile 27% 62% 11% Waterfall 7% 68% 25% Small Size Projects Agile 58% 38% 4% Waterfall 44% 45% 11% The resolution of all software projects from FY2011–2015 within the new CHAOS database, segmented by the agile process and waterfall method. The total number of software projects is over 10,000. TIME BOXES n Always 14% n Yes, most of the time 23% n Yes, some of the time 32% n No 31% We asked IT executives, “In general, do you utilize time boxes to optimize your projects? This is based on 300 responses in the SURF database.
  • 8. Copyright © 2015 The Standish Group International, Inc. 8 We use two tables to determine and appraise complexity. There are five attributes in each table. We then add up the points based on the attributes of the project to determine the complexity level. A complexity level is entered for each project in the CHAOS database. We also use the level in the Size-Complexity Matrix. Our Size-Complexity Matrix provides a guideline for categorizing a project either by size or complexity. For more information about the Size-Complexity Matrix, please review prior CHAOS Manifestos including CHAOS Manifesto 2014. In addition, The Standish Group’s Portfolio Optimization and Management Service can help develop strategies for reducing complexity and gaining success. Complexity is one of the main reasons for project failure. The table on this page shows the resolution of all software projects by complexity from FY2011–2015 within the new CHAOS database using the Modern definition of success. The results show that 38% of very easy projects were successful. Very complex projects have both the highest challenged (57%) and failure (28%) rates. Inside of every complex problem are simple solutions. Complexity is often caused by size, conflicting goals, large budgets, and executive sponsor egos. CHAOS RESOLUTION BY COMPLEXITY COMPLEXITY APPRAISAL n Yes, for all projects 6% n Yes, for most projects 35% n Yes, for few projects 26% n No 32% We asked IT executives, “Does your organization develop any appraisal of complexity on its projects?” This is based on 300 responses in the SURF database. LARGE, COMPLEX PROJECTS n Successful 2% n Challenged 42% n Failed 56% The resolution of large and complex software projects from FY2011–2015 within the new CHAOS database. The resolution of all software projects by complexity from FY2011–2015 within the new CHAOS database. SUCCESSFUL CHALLENGED FAILED Very Complex 15% 57% 28% Complex 18% 56% 26% Average 28% 54% 18% Easy 35% 49% 16% Very Easy 38% 47% 15%
  • 9. Copyright © 2015 The Standish Group International, Inc. 9 SUCCESSFUL CHALLENGED FAILED Precise 22% 53% 25% Close 23% 54% 23% Loose 27% 52% 21% Vague 38% 46% 16% Distant 34% 58% 8% The Standish Group has stated for many years that clear goals are achieved when all the stakeholders are focused on and understand the core values of the project. We believed that goal clarity and focus were essential to a successful project. However, measuring success by both the Traditional and Modern metrics we found the opposite to be true. We coded the database with a 5-point scale, from precise to distant, in order to measure the effect on success rates. It is clear from the research that goals closer to the organization’s strategy have the opposite effect on higher satisfaction and success rates. The Standish Group uses goal as one of the seven constraints as part of the Optimization Clinic. The Optimization Clinic is the third step in our Value Portfolio Optimization and Management Service. We also use goal as one of the measurements for our Resolution Benchmark. The Standish Group is now suggesting that your organization take action over trying to achieve clarity. Many of the most satisfying projects start out as vague. The business objectives are dynamic as the project progresses. Project teams should reduce or give up control of the business objectives to encourage and promote innovation. CHAOS RESOLUTION BY GOAL LOW-VALUE BUSINESS PROCESSES n Yes, we have/had a concentrated effort 23% n Yes, but it is opportunistic 31% n No, but in our plan 18% n No plans 28% We asked IT executives: “Do you have an active program to optimize business processes by eliminating low-value business processes?” This is based on 300 responses in the SURF database. COST/BENEFIT ANALYSIS n Yes, we have/had a concentrated effort 33% n Yes, but it is opportunistic 38% n No, but in our plan 17% n No plans 12% We asked IT executives, “Do you have an active program to optimize business processes by doing cost/benefit analysis for new business processes?” This is based on 300 responses in the SURF database. The resolution of all software projects by goal from FY2011–2015 within the new CHAOS database.
  • 10. Copyright © 2015 The Standish Group International, Inc. 10 Successful projects need smart, trained people. Not surprisingly, one of the key project success factors identified in Standish Group’s CHAOS research is a competent staff. There are five key fundamentals to ensure staff competency. First, identify the required competencies and alternative skills. Second, provide a good, continuous training program to enhance the staff skills. Third, recruit both internally and externally to provide a balance of experiences. Fourth, provide incentive to motivate the staff. Finally, ensure the staff is project-focused. When a project has both teamwork and skilled resources, it can prevail under even the direst of circumstances. To ensure a competent staff you must match the skills of the team to correspond with the needed skills of the project. This is one of the seven constraints we use to prioritize your project portfolio. Here we look at project resolution by capability. The table on this page shows the resolution of all software projects by capability from FY2011–2015 within the new CHAOS database using the Modern definition of success. The results show that 38% of gifted resources were on successful projects. Projects that had unskilled people had both the highest challenged (60%) and failure (23%) rates. The decisions around project priority include: Do you go forward with a project if you lack skilled capability? This decision is especially pertinent for large projects with a large staff who have a mix of good and poor resources. This is one of the reasons that small projects have a higher success rate since small projects are easier to staff with high-performing teams. CHAOS RESOLUTION BY CAPABILITY GIFTED AGILE TEAMS n Very High Value 17% n High Value 27% n Average 36% n Low 9% n Very Low 11% The value rating of medium to large original software development projects with gifted agile teams from FY2011–2015 within the new CHAOS database. UNSKILLED AGILE TEAMS n Very High Value 4% n High Value 5% n Average 19% n Low 44% n Very Low 28% The value rating of medium to large original software development projects with unskilled agile teams from FY2011– 2015 within the new CHAOS database. The resolution of all software projects by capability from FY2011–2015 within the new CHAOS database. SUCCESSFUL CHALLENGED FAILED Gifted 38% 45% 17% Talented 31% 53% 16% Competent 28% 53% 19% Able 24% 54% 22% Unskilled 17% 60% 23%
  • 11. Copyright © 2015 The Standish Group International, Inc. 11 As we wrote in the Factors of Success 2015 report, the table below reflects our opinion of the importance of each attribute and our recommendation of the amount of effort and investment that should be considered to improve project success. It is clear to us that the four primary investments should be focused on: executive sponsorship skills, emotional maturity environment, user involvement, and optimization services. It is our tradition to assign points to each factor to highlight its relevance. These points should also be considered as an investment guideline for project management improvement. For example, if you are spending $50 million on IT projects then 2% of the money should be going toward improving the value of those projects. Based on this amount, our recommended breakdown of money to be allocated to each factor is calculated next to the point value on the chart. So, if you want your projects to be more successful, with higher value and greater customer satisfaction, you should carefully consider where you invest your project improvement money. The law of diminishing returns states that in all productive processes, adding one or more factors of production, while holding others constant, will at some point yield lower returns. Project management expertise, process methods, and tools are affected by the physics law of diminishing returns. The proof point of this law is the United States government. The U.S. government has the highest level of project management expertise, the most sophisticated tools, and the highest level of governance. Yet, U.S. government projects cost exponentially more than commercial projects and have greater failure rates. While the Factors of Success can help improve project performance, the key to project management success is moderation. CHAOS FACTORS OF SUCCESS FACTORS OF SUCCESS POINTS INVESTMENT Executive Sponsorship 15 15% Emotional Maturity 15 15% User Involvement 15 15% Optimization 15 15% Skilled Resources 10 10% Standard Architecture 8 8% Agile Process 7 7% Modest Execution 6 6% Project Management Expertise 5 5% Clear Business Objectives 4 4% The 2015 Factors of Success. This chart reflects our opinion of the importance of each attribute and our recommendation of the amount of effort and investment that should be considered to improve project success.
  • 12. Copyright © 2015 The Standish Group International, Inc. 12 Many of the subjects within this report are subjects of CHAOS Tuesday, our Internet radio program. These shows include: CHAOS Tuesday #81 CRAPOLA CHAOS Tuesday #78 Success Redefined CHAOS Tuesday #77 Factors of Success CHAOS Tuesday #76 Haze Other available research reports: • Factors of Success 2015 • Modernization in Place • CHAOS Manifesto 2014 • CHAOS Report 2014 • Exceeding Value ADDITIONAL RESOURCES AND RESEARCH RESOLUTION BENCHMARK Our Resolution Benchmark Membership measures your project portfolio against like organizations with a similar project mix and skill maturity. • Count what counts • Improve customer and user satisfaction • Increase project value • Reduced project overhead • Improve project environment MEMBERSHIP BENEFITS
  • 13. Copyright © 2015 The Standish Group International, Inc. 13 VALUE PORTFOLIO OPTIMIZATION AND MANAGEMENT SERVICE Our Value Portfolio Optimization and Management Service is a forward-thinking and predictive visualization of the value of your software investments. The Value Portfolio Optimization and Management Service offers the following features: The one thing we are not going to do is immediately change your process or try to sell you new and cumbersome tools. It really does not matter where you are in project management maturity. Our aim is to reduce or minimize the burden placed on you by expensive tools and complex processes. We do this through our three unique items: Our three-step method helps you focus on things that really count. • STEP 1: Project Skills and Environmental Orientation • STEP 2: Individual Project Optimization & Assessments • STEP 3: Value Optimization Clinic FOLLOW-UP: Each quarter The Standish Group will visit your organization to update your portfolio. Our Value Portfolio Optimization and Management Service helps you exceed and create value. STEP 1: GETTING TO KNOW YOU STEP 2: PROJECT PROFILES STEP 3: OPTIMIZATION CLINIC • High Returns on Investment • More Innovations • Greater Stakeholder Satisfaction • Less Management Frustration • Reduced Project Overhead • Rapid • Simple • Comprehensive • Inexpensive • Comprehendible • Research database of 50,000 projects • Patented optimization formula • Our insight into a broad set of projects By focusing your project portfolio on value, our service frees your organization to create value. Our service offers the following benefits: