Report: Housing and Marcellus Shale Development in PA
•
1 like•672 views

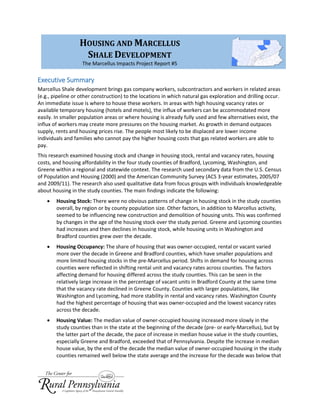
A report from the Center for Rural Pennsylvania, a bipartisan, bicameral legislative agency that serves as a resource for rural policy within the Pennsylvania General Assembly. This latest report looks at how housing is affected in areas impacted by Marcellus drilling.

Recommended
Recommended
More Related Content
Viewers also liked
Viewers also liked (8)
Similar to Report: Housing and Marcellus Shale Development in PA
Similar to Report: Housing and Marcellus Shale Development in PA (20)
More from Marcellus Drilling News
More from Marcellus Drilling News (20)
Recently uploaded
Recently uploaded (12)
Report: Housing and Marcellus Shale Development in PA
- 1. Executive Summary Marcellus Shale development brings gas company workers, subcontractors and workers in related areas (e.g., pipeline or other construction) to the locations in which natural gas exploration and drilling occur. An immediate issue is where to house these workers. In areas with high housing vacancy rates or available temporary housing (hotels and motels), the influx of workers can be accommodated more easily. In smaller population areas or where housing is already fully used and few alternatives exist, the influx of workers may create more pressures on the housing market. As growth in demand outpaces supply, rents and housing prices rise. The people most likely to be displaced are lower income individuals and families who cannot pay the higher housing costs that gas related workers are able to pay. This research examined housing stock and change in housing stock, rental and vacancy rates, housing costs, and housing affordability in the four study counties of Bradford, Lycoming, Washington, and Greene within a regional and statewide context. The research used secondary data from the U.S. Census of Population and Housing (2000) and the American Community Survey (ACS 3-year estimates, 2005/07 and 2009/11). The research also used qualitative data from focus groups with individuals knowledgeable about housing in the study counties. The main findings indicate the following: Housing Stock: There were no obvious patterns of change in housing stock in the study counties overall, by region or by county population size. Other factors, in addition to Marcellus activity, seemed to be influencing new construction and demolition of housing units. This was confirmed by changes in the age of the housing stock over the study period. Greene and Lycoming counties had increases and then declines in housing stock, while housing units in Washington and Bradford counties grew over the decade. Housing Occupancy: The share of housing that was owner-occupied, rental or vacant varied more over the decade in Greene and Bradford counties, which have smaller populations and more limited housing stocks in the pre-Marcellus period. Shifts in demand for housing across counties were reflected in shifting rental unit and vacancy rates across counties. The factors affecting demand for housing differed across the study counties. This can be seen in the relatively large increase in the percentage of vacant units in Bradford County at the same time that the vacancy rate declined in Greene County. Counties with larger populations, like Washington and Lycoming, had more stability in rental and vacancy rates. Washington County had the highest percentage of housing that was owner-occupied and the lowest vacancy rates across the decade. Housing Value: The median value of owner-occupied housing increased more slowly in the study counties than in the state at the beginning of the decade (pre- or early-Marcellus), but by the latter part of the decade, the pace of increase in median house value in the study counties, especially Greene and Bradford, exceeded that of Pennsylvania. Despite the increase in median house value, by the end of the decade the median value of owner-occupied housing in the study counties remained well below the state average and the increase for the decade was below that HOUSING AND MARCELLUS SHALE DEVELOPMENT The Marcellus Impacts Project Report #5
- 2. The Center for Rural Pennsylvania Page | 2 for the state as a whole. Washington County had the highest median housing value among the study counties, but it still was below the state median value. Affordable Housing: Over the decade, the percentage of renters paying 30 percent or more of their income for rent increased, but again there was no clear pattern with Marcellus activity or population size of the study counties. At the end of the decade, both Lycoming County and Greene County had just under half of renters paying rent that was more than 30 percent of their income—close to the Pennsylvania average. Bradford County rental housing remained more affordable, and affordability for renters changed little during the period of Marcellus development. This may reflect displacement of families unable to afford new higher rents as described in the focus groups—the poorest families could not afford housing. Temporary Housing: Data at the county level provided limited information on those who reside in temporary housing or who have been displaced because of increases in rent. This is partly because temporary housing units (e.g., travel trailers or motels and hotels) are not counted as housing units in the U.S. Census or the American Community Survey. Use of temporary housing was identified by focus group participants in both regions as a housing strategy used by gas workers and low income families. Displacement of local people from existing housing due to increases in rents also was mentioned by focus group participants, resulting in increased homelessness among low income individuals and families. The impacts of gas industry and gas- related workers who move to the area and live in rental units or purchase homes are captured in the data. But, it is difficult to determine how many gas-related workers remain in an area long-term when compared to those workers who move with the active drilling and pipeline construction operations.
- 3. The Center for Rural Pennsylvania Page | 3 Table of Contents About This Project:........................................................................................................................................4 Study Counties......................................................................................................................................4 Marcellus Shale Activity........................................................................................................................5 Classifying Counties by Marcellus Shale Activity ..................................................................................6 Potential Impacts of Marcellus Shale Activity on Housing ...........................................................................7 Data and Methods ........................................................................................................................................8 Housing Stock and Occupancy: An Overview ...............................................................................................8 Age of Housing Stock ..................................................................................................................................11 Occupancy and Vacancy of Housing Units..................................................................................................12 Median Value of Owner-Occupied Housing ...............................................................................................15 Housing Affordability ..................................................................................................................................18 Household Incomes of Owners and Renters ..............................................................................................20 Marcellus Shale Development and Housing: Views from Study Counties..................................................22 Issue 1. Higher rents and displacement of local residents. ................................................................23 Issue 2. Gas-related workers living in hotels and motels. ..................................................................23 Issue 3. Low income housing, homelessness and housing quality. ....................................................24 Issue 4. Transience of gas-related workers and alternative housing. ................................................25 Summary and Implications .........................................................................................................................25 Acknowledgements.....................................................................................................................................30 References ..................................................................................................................................................31 Appendix A: Unconventional Wells Drilled by County and Year, 2005-2013 .............................................32 Appendix B. Marcellus Activity County Typology Definitions for Pennsylvania .........................................33 This project was sponsored by a grant from the Center for Rural Pennsylvania, a legislative agency of the Pennsylvania General Assembly. The Center for Rural Pennsylvania is a bipartisan, bicameral legislative agency that serves as a resource for rural policy within the Pennsylvania General Assembly. It was created in 1987 under Act 16, the Rural Revitalization Act, to promote and sustain the vitality of Pennsylvania’s rural and small communities. Information contained in this report does not necessarily reflect the views of individual board members or the Center for Rural Pennsylvania. For more information, contact the Center for Rural Pennsylvania, 625 Forster St., Room 902, Harrisburg, PA 17120, telephone (717) 787-9555, email: info@rural.palegislature.us, www.rural.palegislature.us.
- 4. The Center for Rural Pennsylvania Page | 4 About This Project: The Marcellus Shale Impacts Project chronicles the effects of shale-based energy development in Pennsylvania by focusing on the experiences of four counties with significant extraction and production activity – Bradford, Lycoming, Greene, and Washington counties. The project examines social and economic changes in these counties within the context of regional and statewide trends. A series of nine reports describes the research results as follows: (1) population, (2) health, (3) education, (4) youth, (5) housing, (6) crime, (7) local government, (8) local economy, and (9) agriculture. Study Counties Bradford, Lycoming, Greene, and Washington counties are studied in this project. They have experienced some of the highest levels of Marcellus Shale development in Pennsylvania, yet they have diverse populations, histories, economic bases, and geographic locations. These differences allow comparisons that facilitate understanding of the potential effects of Marcellus Shale development across the commonwealth and by region. The regional comparisons are defined based on adjacency to the four study counties. The northern tier contains 12 counties: Bradford, Lycoming, and the 10 neighboring counties of Clinton, Columbia, Montour, Northumberland, Potter, Sullivan, Susquehanna, Tioga, Union, and Wyoming. The southwest region consists of six counties: Greene, Washington, and the four neighboring counties of Allegheny, Beaver, Fayette, and Westmoreland. All four study counties are classified as rural by the Center for Rural Pennsylvania with population densities of less than 284 people per square mile. Table 1 offers an overview of selected characteristics from 2000 for the four study counties as well as counties in the surrounding region and the state. These data provide important context for understanding differences between the counties and regions prior to Marcellus Shale development. As Table 1 shows how the counties and regions differ across indicators. In the northern tier, Lycoming’s population was nearly twice that of Bradford’s, and Lycoming County had a slightly higher unemployment rate than Bradford County. The percentage employed in mining was very small in 2000 in both northern tier counties, although a larger percentage of people were employed in the industry in Bradford (0.6 percent) than in Lycoming (just 0.1 percent). The two counties had comparable median household incomes. In the southwest, the differences between Greene and Washington are more pronounced. Greene had the smallest population of the four counties (40,672) and 6.7 percent of employed individuals in the county were working in mining. The unemployment rate (9.2 percent) was more than 3 points above the state’s average (5.7 percent), and the median household income ($41,972) was well below average for the region ($52,004) and the state ($55,460). In contrast, the median household income in Washington County was just over $10,000 higher than in Greene. Only 1.3 percent of the employed work in mining and the unemployment rate was notably lower (5.3 percent). The two counties of the southwest had more diversified economies than counties of the northern tier. In Bradford and Lycoming, the same three industries (Manufacturing, Health Care and Social Assistance, and Retail Trade) employed around half the population (52.4 percent and 47.4 percent, respectively (Census 2000). In contrast, just over one-third of the working population in Greene County worked in the same three industries (Health Care and Social Assistance, Retail Trade, and Educational Services). Washington’s top three industries (Manufacturing, Health Care and Social Assistance, Retail Trade, and Manufacturing) employed 41.7 percent of the working population.
- 5. The Center for Rural Pennsylvania Page | 5 Table 1. Pre-Marcellus characteristics of study counties in 2000 Population People per square mile % employed in Mining % Unemployed Median Household Income (adjusted for inflation to 2012 values) Northern Tier* 47,968 83 0.6% 6.0% $47,071 Bradford 62,761 55 0.6% 5.5% $48,451 Lycoming 120,044 97 0.1% 6.3% $47,038 Southwest* 370,881 505 1.8% 6.6% $47,901 Greene 40,672 71 6.7% 9.2% $41,972 Washington 202,897 237 1.3% 5.3% $52,004 Pennsylvania 12,281,054 274 0.3% 5.7% $55,460 The northern tier region contains 12 counties: Bradford, Lycoming, and the 10 neighboring counties of Clinton, Columbia, Montour, Northumberland, Potter, Sullivan, Susquehanna, Tioga, Union, and Wyoming. The southwest region consists of six counties: Greene, Washington, and the four neighboring counties of Allegheny, Beaver, Fayette, and Westmoreland. Source: Social Explorer Tables (SE), Census 2000, U.S. Census Bureau and Social Explorer. * County average, includes study counties. Marcellus Shale Activity Table 2 shows the number of unconventional wells drilled in the Marcellus Shale each year in the six Pennsylvania counties with the highest total number of wells drilled between 2005 and mid-year 2013 (Pennsylvania Department of Environmental Protection). Table 2. Six counties with the most wells drilled and wells drilled each year, 2005-2013* county name 2005 2006 2007 2008 2009 2010 2011 2012 2013* mid- year Total, by county Bradford+ 1 2 2 24 158 373 396 164 66 1186 Washington+ 5 19 45 66 101 166 155 195 120 872 Tioga 0 1 0 15 124 273 272 122 13 820 Lycoming+ 0 0 5 12 23 119 301 202 89 751 Susquehanna 0 1 2 33 88 125 205 191 102 747 Greene+ 0 2 14 67 101 103 121 105 54 567 Total wells drilled in top six counties: 4943 Source: Pennsylvania Department of Environmental Protection, Office of Oil and Gas Management. *Data through June 30, 2013 (accessed July 4, 2013); + Study counties. The four study counties have experienced significant Marcellus Shale well drilling and account for half (3,376) of the 6,833 unconventional wells drilled in the commonwealth. The two counties located in the southwest, Washington and Greene, experienced more well development through 2008 than the other counties. Bradford County experienced significant growth starting in 2009. Despite the late start, Bradford County quickly surpassed all other Pennsylvania counties with nearly 400 new wells drilled in 2011, for a total of 1,186 by June 30, 2013. Lycoming similarly experienced more new drilling activity in 2011 than occurred in the southwest and had the highest number of new wells drilled in 2012.
- 6. The Center for Rural Pennsylvania Page | 6 Figure 1 shows the cumulative number of wells drilled from 2005 to 2012 in each of the study counties. Although some wells may no longer be in production by 2012, and some have not yet been put into production, the lines reveal overall trends in the counties and across regions. The northern tier counties (Bradford and Lycoming) had steeper increases in the past 3 years, whereas those in the southwest (Washington and Greene) had more gradual but steady increases in the number of wells drilled. In 2012, the pace of new drilling slowed in Bradford and Lycoming, likely due to the declining price of natural gas. In contrast, drilling in Greene and Washington counties in 2012 was on par with the previous year. This may be because gas in southwestern Pennsylvania tends to be “wet” gas, meaning it contains more marketable compounds (liquid natural gases such as butane and propane) that can generate higher revenues than “dry” natural gas (i.e. methane) alone. Even so, mid-year figures suggest that new drilling activity across all four counties in 2013 may be comparable to 2012. A table listing well counts for all counties in Pennsylvania is in Appendix A. Classifying Counties by Marcellus Shale Activity To further understand the effects of Marcellus Shale activity, the analyses compared counties based on their level of Marcellus Shale activity using a five-category county typology. The typology was created by combining several definitions based on estimated shale value and actual development activity, including publicly available maps of the thickness, depth, and thermal maturity of the shale (McLaughlin et al., 2012). This typology also differentiates urban counties because the population and economic dynamics in these counties are fundamentally different from that of rural counties. Source: PA Dept. of Environmental Protection, Office of Oil and Gas Management (accessed July 4, 2013).
- 7. The Center for Rural Pennsylvania Page | 7 In Pennsylvania, the number of wells is highly concentrated in a small number of counties. There are 7 counties (including the four study counties) that account for 90 percent of the total number of wells drilled through June 30, 2013. These 7 counties are classified as “core” counties with high drilling activity, and are shaded with the darkest gray in Figure 2. The other four typology categories are: “core” counties with low drilling activity, 2nd tier counties (with lower quality shale and limited drilling activity), urban counties with potential or some Marcellus Shale development, and those counties with no Marcellus Shale. For a full description of the typology, see Appendix B. Potential Impacts of Marcellus Shale Activity on Housing The effects of Marcellus Shale development are likely to vary with overall drilling activity, but also based on the pre-Marcellus status of the housing market. Housing for new residents or workers coming to an area may be readily available or it could be almost non-existent. This depends on numbers of new people compared to the size of the existing population, characteristics of the existing housing market and housing stock, and previous patterns of population change. The influx of the same number of new residents will have very different effects in areas with small populations as compared to those with larger populations. The same housing vacancy rates reflect quite different numbers of available housing units in areas with different size populations. An influx of 3,000 workers is more easily absorbed in an area with a larger population and housing stock than in areas with smaller populations and fewer housing units. In addition, areas that have experienced recent population growth are more likely to have tighter housing markets, with lower vacancy rates of existing housing and potentially higher costs of housing. These areas also are more likely to have more active development of new housing, which translates into greater ability to more effectively meet any increase in demand through new construction. In contrast, those areas with declines in population will have softer housing markets with larger shares of vacant housing and some downward pressure on rents and housing values. Housing also may be older and less attractive to new residents. These areas also are less likely to be experiencing construction of new housing and may not have immediate capacity to respond to demand for additional housing units.
- 8. The Center for Rural Pennsylvania Page | 8 Complicating issues related to housing and the influx of new workers is determining the length of time newcomers intend to stay in the area. A local housing market may not have the mix of housing to meet the preferences of different types of workers. More transient workers – rig workers and workers constructing drill-pads or other infrastructure (pipelines, pumping stations), for example – may be more likely to seek temporary housing, making it easier for them to move on in a few months. Higher turnover of renters may increase the wear-and-tear on existing properties or greater demand for rentals could cause low-income individuals and families to be priced out of rental markets. Other workers may stay for several years or permanently relocate to the area. Gas-related workers in management or maintenance of drilled wells may be more likely to purchase, rather than rent, housing. Those seeking to buy may have difficulty finding suitable housing in areas where the housing stock is older and has not been updated. Questions that face local leaders and developers in active drilling areas include whether they should encourage building of new housing or rental units to meet the housing needs of temporary workers; and if so, what should the characteristics of this housing be? Who will pay for this new or renovated housing and how much will they be willing to pay? How can the impact and trade-offs associated with these decisions be identified, especially given uncertainty about where the next drilling boom will occur and how long activity will last? If decisions are made to build new housing, it is essential for local leaders to consider the long-term housing needs of the existing population. For example, if the population is aging, as is occurring in much of rural Pennsylvania, this housing might be repurposed to safely house elders when drilling activity ends and workers move on. Data and Methods Comparative information on housing over time is available from the U.S. Census through the 2000 Decennial Census and the American Community Survey (ACS). This research used housing data from the 2000 Census of Population and Housing and ACS 3-year estimates of housing data for 2005/07 and 2009/11. The data used include numbers and status of units (owner-occupied, rental, or vacant) combined with information on costs and housing values for 2000, and the 2005-07 and 2009-11 periods to examine whether and how these changed during the periods of increased natural gas development. The 2000 Census data provided information on pre-Marcellus activity, the 2005-07 ACS data were the first county-level data available during the time-frame in which Marcellus drilling started and the 2009- 11 ACS data were the most recently available. The research also used information from focus groups conducted in each region with individuals knowledgeable about human services and housing in the four study counties. The summaries presented in this report are the authors’ interpretations of the information provided in the focus groups. Direct quotes are from the transcripts of the audio-taped focus group conversations. Housing Stock and Occupancy: An Overview Housing stock refers to the number of physical dwellings in a given area. Occupancy indicates whether a home is occupied by the owner, a renter or is vacant. The Northern tier counties exhibited overall growth in housing units from 2000 to 2009/11, but at a slightly slower pace than in the state as a whole (see Table 3). The state as a whole showed an increase in housing units of 320,279 units or 6.1 percent from 2000 to 2009/11. The pattern varied across the study counties: Bradford County showed increases in housing units throughout the period, while Lycoming County gained housing units from 2000 to 2005/07, but then lost units from 2005/07 to 2009/11 to end the period with roughly the same number of housing units as in 2000. All of the counties adjacent to the study counties in the northern tier had increases in the number of housing units throughout the 2000 to 2009/11 period, although the pattern differed across counties. These patterns
- 9. The Center for Rural Pennsylvania Page | 9 of change in the number of housing units were not consistent within the region, by size of the county or Marcellus activity. Housing units in the southwest region increased by 1.9 percent from 2000 to 2005/07, but then declined (-0.4 percent) from 2005/07 to 2009/11 (Table 4). In the study counties, the percentage change in housing units in Greene County mirrored those for the region, but the percentage decline was larger from 2005/07 to 2009/11 at 4 percent. Greene County had a slight decline in housing units over the decade. Washington County had an increase in housing units in each time period, with a larger increase from 2000 to 2005/07. Among the counties adjacent to the study counties, only Westmoreland County had an increase in the number of housing units in both time periods, while only Fayette County had an overall decline in housing units from 2000 to 2009/11. There was little evidence of a pattern in the relationship between Marcellus Shale drilling activity and change in the housing stock in the southwest region. Table 3. Housing Stock: Number of Housing Units and Percentage Change, Northern Tier 2000 % change 2005/07 % change 2009/11 Pennsylvania 5,249,750 3.8 5,451,386 2.2 5,570,029 Northern Tier Region 239,310 2.8 246,079 2.0 250,894 Study counties Bradford 28,664 2.1 29,277 2.5 30,005 Lycoming 52,464 2.4 53,733 -2.4 52,453 Adjacent counties only (average) 158,182 3.1 163,069 3.3 168,436 Susquehanna 21,829 2.8 22,451 2.4 22,985 Tioga 19,893 3.7 20,633 3.8 21,415 Clinton 18,166 3.6 18,813 1.4 19,068 Wyoming 12,713 4.1 13,231 0.1 13,242 Columbia 27,733 3.7 28,771 2.7 29,537 Northumberland 43,164 1.3 43,740 3.2 45,149 Union 14,684 5.1 15,430 10.4 17,040 Source: Social Explorer Tables. Census 2000, ACS 2005 to 2007 and ACS 2009 to 2011 (3-Year Estimates), Social Explorer; U.S. Census Bureau.
- 10. The Center for Rural Pennsylvania Page | 10 Table 4. Housing Stock: Number of Housing Units and Percentage Change, Southwest Region 2000 % change 2005/07 % change 2009/11 Pennsylvania 5,249,750 3.8 5,451,386 2.2 5,570,029 Southwest region 992,904 1.9 1,011,849 -0.4 1,007,664 Study counties Greene 16,678 2.7 17,133 -4.0 16,440 Washington 87,267 4.9 91,575 1.6 93,062 Adjacent counties only 888,959 1.6 903,141 -0.6 898,162 Fayettea 66,490 1.0 67,178 -6.7 62,650 Allegheny 583,646 1.3 591,047 -0.3 589,068 Beaver 77,765 2.0 79,348 -1.5 78,179 Westmoreland 161,058 2.8 165,568 1.6 168,265 Source: Social Explorer Tables. Census 2000, ACS 2005 to 2007 and ACS 2009 to 2011 (3-Year Estimates), Social Explorer; U.S. Census Bureau. The two study counties with increases in housing units had different population size and were in different regions. Bradford County in the northern tier has a much smaller population, while the more urban Washington County in the southwest has a larger population. Any effects associated with Marcellus Shale development would seem to depend on the pace of development and how placement of different types of Marcellus development occurs in response to factors other than population size and housing availability in the host county. The association between Marcellus Shale activity and housing is further examined in Table 5, which shows the number of housing units and the percentage change in units for the five categories of the Marcellus typology. This comparison indicates that the geologic core of the Marcellus Shale (both high- and low-drilling activity) experienced increases in the number of housing units from 2000 to 2005/07, but had fewer housing units in 2009/11 than in 2005/07. The number of housing units in the Marcellus 2nd Tier increased more than that in other areas from 2000 to 2005/07, but that growth slowed by 2009/11. The areas without Marcellus Shale, which include counties concentrated in southeastern Pennsylvania, had the largest percentage increases in housing units in both time periods as well as the largest total number of housing units. Housing growth across areas with Marcellus activity lagged behind the rest of Pennsylvania, and the percent change in housing units was lower in these areas during active drilling than at the beginning of the decade.
- 11. The Center for Rural Pennsylvania Page | 11 Table 5. Housing stock: Number of housing units and percentage change, Marcellus typology 2000 % change 2005/07 % change 2009/11 Core, high-drilling activity (N=7) 293,285 3.0 301,980 -1.0 299,010 Core, low-drilling activity (N=12) 375,399 2.0 382,928 -0.6 380,507 Marcellus 2nd Tier (N=19) 763,853 5.5 805,711 2.0 821,511 Urban, in the Marcellus Shale, Core or 2nd Tier (N=6) 1,176,839 1.8 1,197,794 0.2 1,200,343 No Marcellus Shale (N=23) 2,894,596 4.6 3,027,626 3.7 3,139,203 Source: Social Explorer Tables. Census 2000, ACS 2005/07 and ACS 2009/11 (3-Year Estimates), Social Explorer; U.S. Census Bureau. Age of Housing Stock In 2000, the median year that housing was built in Greene County was 1954. The median year for housing build in Washington and Lycoming counties was 1955 (See Table 6). In Bradford County, the median year that housing was built was 1961. A more recent median year in which structures were built in 2009/11 indicates more recent housing construction, older dilapidated units were torn down, or both. The expectation related to Marcellus Shale activity would be for the counties with smaller populations (Bradford and Greene) to have more difficulty adapting to any influx of population simply because of the smaller number of housing units available and likely lower capacity to build a large number of new units. This would especially be the case if excavation contractors are employed by the gas industry to prepare roads and well pads and are not available to prepare housing lots and dig foundations. Washington and Greene counties experienced the largest change, a 5-year reduction in the median age of housing structures between 2000 and 2009/11. This may reflect new housing due to expansion of the Pittsburgh suburbs into northern Washington County, as well as activity related to economic growth and Marcellus activity. Washington County has become a regional hub for many gas companies and related activities. Greene County’s more recent median year for housing structures in 2009/11 may reflect new construction. It could also reflect the removal of older units as seen in Table 3, where Greene County had a net loss of 238 housing units over the decade.
- 12. The Center for Rural Pennsylvania Page | 12 Table 6. Median year housing structure was built, 2000, 2005/07 and 2009/11, by study counties and regions. 2000 2005/07 2009/11 Pennsylvania 1957 1958 1960 Northern Tier* 1960 1961 1963 Bradford 1961 1962 1964 Lycoming 1955 1955 1957 Southwest* 1954 1956 1958 Greene 1954 1953 1959 Washington 1955 1959 1960 Source: Social Explorer Tables. Census 2000, ACS 2005 to 2007 and ACS 2009 to 2011 (3-Year Estimates), Social Explorer; U.S. Census Bureau. The regional data indicated that by 2009/11, the median age of housing in three of the study counties was younger than that in the corresponding region. The exception is Lycoming County, with the median age of housing stock being 6 years older than that in the region. The 3-year change in the median year that housing units were built in the northern tier, from 1960 to 1963, reflects the increase in the number of housing units, presumably new construction. It should be noted that, overall, the housing stock in the northern tier counties is younger than the southwest counties. Occupancy and Vacancy of Housing Units The demand for housing can be assessed by looking at the occupancy rate, which includes owner- occupied and renter occupied units, and the vacancy rate, which is the percentage of housing units that are not occupied. An increased demand for housing would likely be reflected in an increase in the occupancy rate, as long as the cost of housing is within the ability of potential buyers or renters to pay. Table 7 shows the percentage of housing units that are owner-occupied, renter-occupied and vacant for the northern tier. The percentage of housing that was owner-occupied declined from 2000 to 2009/11 in Pennsylvania, the northern tier and Bradford and Lycoming counties. For Pennsylvania as a whole, this may be attributed to a slight increase in the percentage of units rented and a larger increase (2 percentage points) of vacant housing. In the northern tier, the pattern of change was similar to that for Pennsylvania with larger percentage point increases in vacant housing than in the percentage of rented housing. Bradford and Lycoming counties showed quite different shifts in owner-occupied, rented and vacant housing. In Bradford County, owner-occupied housing declined by 3.2 percentage points, with most of that occurring between 2005/07 and 2009/11. This was mirrored by an overall decline in rented housing, from 20.9 percent in 2000 to 21.6 percent in 2005/07 and to 18.9 percent in 2009/11. In Bradford County, the percentage of vacant housing increased in each time period, with the largest increase of 4.8 percentage points from 2005/07 to 2009/11. This suggests either a decline in the demand for rental or owner-occupied units, an increase in supply (a 2.5 percent increase in housing
- 13. The Center for Rural Pennsylvania Page | 13 units occurred from 2005/07 to 2009/11), or housing that has been priced beyond the ability of people to pay. Table 7. Percentage of owner-occupied, rented, and vacant housing in the Northern Tier % Owner-occupied % Rented % Vacant 2000 2005/07 2009/11 2000 2005/07 2009/11 2000 2005/07 2009/11 Northern Tier 63.4 61.9 61.8 21.7 22.4 22.1 14.9 15.7 16.1 Bradford 64.4 63.3 61.2 20.9 21.6 18.9 14.7 15.1 19.9 Lycoming 62.2 60.5 60.8 27.4 28.3 27.6 10.4 11.2 11.6 Adjacent counties only 63.5 61.9 62.0 21.0 21.7 21.8 15.5 16.4 16.2 Susquehanna 60.2 59.5 59.1 15.5 17.9 15.9 24.3 22.6 25.0 Tioga 61.0 59.7 59.7 19.1 20.9 20.8 19.9 19.5 19.5 Clinton 59.3 57.5 57.9 22.0 22.1 22.6 18.7 20.4 19.5 Wyoming 66.8 65.9 63.9 17.9 17.8 18.8 15.3 16.3 17.3 Columbia 65.0 63.8 61.9 24.8 25.1 26.4 10.2 11.1 11.7 Northumberland 66.2 64.3 62.6 23.8 23.2 24.7 10.0 12.5 12.7 Union 65.8 62.9 68.7 23.9 25.0 23.5 10.3 12.2 7.8 Pennsylvania 64.9 63.9 62.4 26.1 25.2 26.6 9.0 10.9 11.0 Source: Social Explorer Tables. Census 2000, ACS 2005 to 2007 and ACS 2009 to 2011 (3-Year Estimates), Social Explorer; U.S. Census Bureau. Overall, the southwest region had a decline in the share of housing that was owner-occupied (Table 8). The region experienced a decline and then an increase, which remained below 2000 levels, in renter- occupied housing, and a large increase in vacant housing (4 percentage points from 2000 to 2005/07 and an additional 1.4 percentage points from 2005/07 to 2009/11). Housing occupancy in Greene County showed a decline in the share of owner-occupied housing from 66.9 percent in 2000 to 63.1 percent in 2009/11. The percentage of housing units rented dropped from 23.4 percent in 2000 to 19.5 percent in 2005/07, but then increased to 24.2 percent in 2009/11. This suggests volatility in the demand and/or availability of rental units in the county. Vacant housing in Greene County rose markedly from 9.7 percent in 2000 to 15.3 percent in 2005/07, and then to 12.7 percent in 2009/11. This pattern is consistent with the shifts in the percentage of rented housing.
- 14. The Center for Rural Pennsylvania Page | 14 Table 8. Percentage of occupied, rented, and vacant housing in the Southwest % Owner-occupied % Rented % Vacant 2000 2005/07 2009/11 2000 2005/07 2009/11 2000 2005/07 2009/11 Southwest 68.1 65.9 65.2 23.9 22.1 23.4 8.0 12.0 11.4 Greene 66.9 65.2 63.1 23.4 19.5 24.2 9.7 15.3 12.7 Washington 71.7 70.8 69.6 21.3 19.8 20.7 7.0 9.4 9.7 Adjacent counties only 67.5 65.3 64.3 24.6 23.9 25.0 7.9 10.9 10.7 Fayette 66.0 62.3 63.6 24.2 25.2 23.9 9.8 12.5 12.5 Allegheny 61.7 60.1 58.2 30.3 28.0 30.5 8.0 11.9 11.3 Beaver 69.9 68.0 67.0 23.4 21.9 23.3 6.7 10.2 9.7 Westmoreland 72.6 70.6 68.4 20.5 20.3 22.4 7.0 9.0 9.2 Pennsylvania 64.9 63.9 62.4 26.1 25.2 26.6 9.0 10.9 11.0 Source: Social Explorer Tables. Census 2000, ACS 2005 to 2007 and ACS 2009 to 2011 (3-Year Estimates), Social Explorer; U.S. Census Bureau. Washington County had relatively small declines in the percentages of owner-occupied housing from 2000 (71.7 percent) to 2005/07 (70.8 percent) to 2009/11 (69.6 percent). The percentage of units rented was highest in 2000 (21.3 percent). This declined to 19.8 percent in 2005/07 and rose to 20.7 percent by 2009/11. The percentage of vacant housing increased in Washington County from 7.0 percent in 2000 to 9.7 percent in 2009/11. Washington County had relative stability in housing occupancy and vacancy over the period studied, perhaps partly because of the much larger size of the housing stock and the increase in housing of almost 6,000 units over this time frame. The pattern of renter occupied housing differed across regions and study counties. The percentage of rental units was relatively stable in the southwest overall, but Greene and Washington Counties had opposite patterns of change. The relatively low percentage of rental units in Washington County was constant across the time periods, hovering at about 20 to 21 percent. In Greene County, the somewhat higher percentage of rented units in 2000 (23 percent) declined in 2005-07 (20 percent) and then rose again in 2009-11 (24 percent). Only in Greene County was the percentage of renter-occupied housing higher in 2009/11 than in 2000. Comparing the study counties across regions (Tables 7 and 8), Bradford County had a 5.2 percentage point increase in vacant housing from 2000 to 2009/11, while Lycoming County had a modest increase. In the southwest study counties, Greene had a 3 percentage point increase in vacant housing over the same period and Washington County had a 2.7 percentage point increase. By 2009/11, the highest percentage of vacant housing was in Bradford County (19.9 percent) and the lowest percentage was in Washington County (9.7 percent). The variations in vacant housing in Bradford and Washington counties may reflect differences in the timing and or types of Marcellus-related activities in these two counties. Or they may reflect other development activities, such as suburban expansion in Washington County or differences in destruction of older housing. The final comparison of housing occupancy occurs across the five categories of the Marcellus typology of Pennsylvania counties (Table 9). In every category, there was a slow decline in the percentage of owner- occupied housing from 2000 to 2009/11. At the beginning of the period, the highest level of owner-
- 15. The Center for Rural Pennsylvania Page | 15 occupied housing (67.8 percent) was in the ‘No Marcellus’ counties and the lowest was in the Marcellus 2nd Tier counties (62.4 percent). This pattern was the same in 2009/11, when the No Marcellus counties had the highest percentage of owner-occupied units (66.2 percent) and the Marcellus 2nd Tier counties had the lowest (60.8 percent). The counties with the highest percentages of renter-occupied housing in 2000 were in the Urban Marcellus counties (26.5 percent), followed closely by the No Marcellus counties (24.6 percent). In 2000, the lowest percentages of rented housing were located in the Marcellus 2nd Tier counties (20 percent) and Core low-drilling activity counties (20.1 percent). This pattern changed little by 2009/11, when the highest percentage of rented housing was still in the Urban Marcellus counties (27.2 percent) and the lowest percentage was in the Marcellus 2nd Tier (20.4 percent) and Core low-drilling (20.3 percent) counties. By definition, vacancy rates are highest in areas with low percentages of renter and/or owner-occupied housing. In 2000, the highest vacancy rate was in the Marcellus 2nd Tier counties (17.6 percent) and the lowest was in the No Marcellus counties (7.6 percent). This pattern was the same in 2009/11, but vacancy rates were higher, ranging from 9.1 percent in the No Marcellus counties to 18.7 percent in the Marcellus 2nd Tier counties. Table 9. Percentage of occupied, rented, and vacant housing, 2000, 2005-07 and 2009-11, Marcellus Typology % Owner-occupied % Rented % Vacant 2000 2005/07 2009/11 2000 2005/07 2009/11 2000 2005/07 2009/11 Core, high-drilling activity 64.6 63.0 62.5 21.7 21.9 21.7 13.7 15.1 15.8 Core, low-drilling activity 65.6 63.5 63.1 20.1 20.5 20.3 14.3 16.0 16.6 Marcellus 2nd Tier 62.4 61.4 60.8 20.0 20.1 20.4 17.6 18.5 18.7 Urban Marcellus 65.5 63.9 62.5 26.5 25.6 27.2 8.0 10.5 10.2 No Marcellus 67.8 67.4 66.2 24.6 24.0 24.6 7.6 8.6 9.1 Source: Social Explorer Tables. Census 2000, ACS 2005 to 2007 and ACS 2009 to 2011 (3-Year Estimates), Social Explorer; U.S. Census Bureau. The story of housing stock and owner-occupancy, rentals and vacancy rates of housing in the study counties does not portray a clear pattern relative to Marcellus Shale activity, region or population size of the counties. Vacancy rates increased over the study period across the state and in the study counties, while the number of housing units increased in two counties (one in each region) and declined or were stable in the other two counties. The share of renter-occupied housing increased by the middle of the decade in the northern tier and the two northern tier study counties, but then declined somewhat by the end of the decade, suggesting a possible influence of early Marcellus activity. In the southwest study counties the percentage of housing used as rental properties dropped by mid-decade, but then rose again by 2009/11, suggesting different timing or effects of Marcellus activity on rental housing in the southwest. It is important to remember that the data sources used do not capture temporary residents who may be living in temporary housing, such as travel trailers or motels and hotels. Median Value of Owner-Occupied Housing An increased demand for housing would be reflected in an increase in the value of housing in an area. Increasing housing values tend to be associated with increased rents, and also make housing less affordable for those whose incomes have not increased or not increased at the same pace as housing costs. Table 10 shows the median housing value for owner-occupied housing units in inflation adjusted
- 16. The Center for Rural Pennsylvania Page | 16 dollars (2012) and the percent change in median housing values for Pennsylvania and the northern tier. These house values are reported by the owners in the ACS and Census data, so they are not actual current market values of the housing. The inflation-adjusted median value of owner-occupied housing in Pennsylvania increased by 26.2 percent from 2000 to 2005/07. In the northern tier counties, median owner-occupied housing values increased by just 6.6 percent, while the increase in housing values in the southwest was 11.4 percent (See Table 11). The increase in median house values slowed from 2005/07 to 2009/11, when owner-occupied housing values rose 5.7 percent in Pennsylvania and 2.4 percent in the southwest. The northern tier was the exception: median housing values increased by 11.5 percent from 2005/07 to 2009/11. The percent change in owner-reported housing market values used here for the study counties is quite comparable to the average percent change in actual housing market sales values based on State Tax Equalization Board market value data from 2007 to 2009 reported for counties by Marcellus drilling activity (see Kelsey, Adams and Milchak, 2012). In the earlier period, Bradford and Lycoming counties had increases in median home values (1.7 percent and 6.6 percent, respectively) well below the state level of 26.2 percent. In the 2005/07 to 2009/11 period, this pattern reversed. Median house values in Bradford and Lycoming counties increased by 15.6 and 10.1 percent, respectively. This is well above the state increase of 5.7 percent. These shifts suggest different forces affected housing values in these two periods and in the study counties in the northern tier when compared to Pennsylvania. The southwest region experienced an increase of 11.4 percent in median owner-occupied housing values from 2000 to 2005/07, with both Greene (13.1 percent) and Washington (18.7 percent) counties showing larger increases than the region. These increases were below the state average but higher than those in the study counties in the northern tier. From 2005/07 to 2009/11, the southwest saw a 2.4 percent increase in median housing values. Greene and Washington counties continued to have increases in median housing values that were higher than the region (7.8 and 5.7 percent, respectively), but these were below the increases in Bradford (15.6 percent) and Lycoming (10.1 percent) counties. Table 10. Median Housing Values and Percentage Change in Values For All Owner-Occupied Housing Units, Northern Tier, adjusted for inflation to 2012 dollars. 2000 % change 2005/07 % change 2009/11 Pennsylvania $126,829 26.2 $160,110 5.7 $169,195 Northern Tier (county average)* $109,318 6.6 $116,493 11.5 $129,855 Bradford $99,001 1.7 $100,666 15.6 $116,347 Lycoming $113,316 6.6 $120,777 10.1 $132,939 Adjacent counties only (average) $110,220 7.2 $118,142 11.2 $131,344 Susquehanna $113,049 11.5 $125,999 13.9 $143,488 Tioga $96,593 5.6 $102,000 14.6 $116,859 Clinton $100,874 4.0 $104,888 5.1 $110,202 Wyoming $122,548 16.1 $142,333 9.7 $156,188 Columbia $114,788 0.5 $115,333 23.3 $142,157 Northumberland $93,650 -0.8 $92,888 4.7 $97,298 Union $130,040 10.4 $143,555 6.7 $153,218 Dollars adjusted for inflation to 2012. Source: Social Explorer Tables. Census 2000, ACS 2005 to 2007 and ACS 2009 to 2011 (3-Year Estimates), Social Explorer; U.S. Census Bureau. *County average for 9 counties in region. Montour, Potter and Sullivan counties also were adjacent to Bradford and Lycoming counties but are excluded because their population counts were too small to be estimated in the 2005/7 ACS data.
- 17. The Center for Rural Pennsylvania Page | 17 Table 11. Median Housing Values and Percentage Change in Values For All Owner-Occupied Housing Units, Southwest Pennsylvania, adjusted for inflation to 2012 dollars 2000 % change 2005/07 % change 2009/11 Pennsylvania $126,829 26.2 $160,110 5.7 $169,195 Southwest Region* $101,699 11.4 $113,296 2.4 $116,057 Greene $74,652 13.1 $84,444 7.8 $91,050 Washington $114,253 18.7 $135,666 5.7 $143,386 Adjacent counties only $105,323 9.1 $114,916 0.5 $115,477 Fayette $81,074 8.8 $88,222 -4.6 $84,188 Allegheny $111,711 7.3 $119,888 3.6 $124,234 Beaver $111,310 8.2 $120,444 -2.7 $117,167 Westmoreland $117,196 11.9 $131,111 4.0 $136,319 Dollars adjusted for inflation to 2012. Source: Social Explorer Tables. Census 2000, ACS 2005 to 2007 and ACS 2009 to 2011 (3-Year Estimates), Social Explorer; U.S. Census Bureau. * County average for the 6 county region (includes study counties). Overall by 2009/11, median owner-occupied housing values were significantly higher for the county average statewide ($169,195) compared to $129,855 in the northern tier and $116, 057 in the southwest. The highest median housing value among the four study counties was in Washington County and the lowest was in Greene County, both in the southwest. Equally interesting is the shift in the pattern of increase in housing values in the two time periods. In the earlier period, the fastest growth was statewide and then in Greene and Washington counties. By the latter period, the fastest growth in median housing values occurred in the two northern tier study counties. Whether and how these shifting patterns of change in owner-occupied housing values relate to Marcellus Shale activity is unclear. These increases in housing values in the counties with high levels of Marcellus drilling suggest that an increase in demand for housing may have occurred. Individuals who received lease or royalty payments from Marcellus may have invested in housing improvements, increasing the reported estimated value of their homes. The increases in housing value further suggest that the inflation- adjusted cost of housing has increased, which affects the affordability of housing – for owner-occupied and rental housing. Finally, the inflation-adjusted median housing value and percent change in values for the counties categorized in the Marcellus typology are shown in Table 12. The counties in the Core Marcellus area had the lowest average median housing values in the state, with the lowest housing values in the low- drilling activity counties. From 2000 to 2005/07, the median housing values increased rapidly in counties with no Marcellus Shale activity (29 percent) and in 2nd Tier counties (15 percent). This was followed, however, by some of the lowest growth from 2005/07 to 2009/11 (2 percent and 5 percent, respectively). The pattern of change was quite different in Core Marcellus counties: in low-drilling activity counties the increase from 2005/07 to 2009/11 was smaller than from 2000 to 2005/07 (4 percent compared to 7 percent). In contrast, the rate of increase was more constant and higher in high- drilling activity counties (10 percent in 6 years compared to 9 percent over 4 years). Stagnation in the housing market is apparent in the percentage change that occurred from 2005/07 to 2009/11. The smallest percentage increase occurred in the No Marcellus Shale counties, 1.8 percent. The highest
- 18. The Center for Rural Pennsylvania Page | 18 increase, 9.3 percent, was found in the Marcellus Core counties with high-drilling activity. This suggests Marcellus Shale drilling activity may be exerting upward pressures on median housing values of owner- occupied units. Table 12. Median Housing Values and Percentage Change in Values For All Owner-Occupied Housing Units, Marcellus Typology, adjusted for inflation to 2012 dollars. 2000 % change 2005/07 % change 2009/11 Core, high activity $98,848 9.5 $108,253 9.3 $118,322 Core, low activity $92,713 7.0 $99,185 4.3 $103,443 2nd Tier $109,964 15.2 $126,699 4.6 $132,493 Urban Marcellus $114,030 7.7 $122,833 3.9 $127,596 No Marcellus $142,877 29.3 $184,757 1.8 $188,119 Dollars adjusted for inflation to 2012. Source: Social Explorer Tables. Census 2000, ACS 2005 to 2007 and ACS 2009 to 2011 (3-Year Estimates), Social Explorer; U.S. Census Bureau. Housing Affordability An influx of new people to a community can impact housing accessibility by increasing demand and driving up rent for rental units. Housing is considered affordable when a household spends no more than 30 percent of annual income on rent (See: http://www.hud.gov/offices/cpd/affordablehousing/). Across Pennsylvania, the percentage of households spending 30 percent or more of annual income on rent increased by 10.5 percentage points from 2000 to 2009-11 (See Table 13). Almost half of these households (46.1 percent) lived in housing that was not affordable given their income levels in 2009-11. Table 13. Percentage of Renters Spending More Than 30% of Income on Rent, Northern Tier 2000 2005/07 2009/11 Northern Tier (county average)* 32.5 36.8 41.6 Bradford 29.0 36.2 36.7 Lycoming 35.6 43.9 46.2 Adjacent counties only (average) 32.6 35.9 41.7 Susquehanna 31.9 33.0 39.0 Tioga 32.8 38.4 45.7 Clinton 36.0 41.1 40.4 Wyoming 30.5 29.3 35.4 Columbia 33.7 39.4 43.9 Northumberland 29.6 32.8 38.5 Union 33.5 37.2 49.0 Pennsylvania 35.6 43.1 46.1 Source: Social Explorer Tables. Census 2000, ACS 2005 to 2007 and ACS 2009 to 2011 (3-Year Estimates), Social Explorer; U.S. Census Bureau. * County average for 9 counties in region. Montour, Potter and Sullivan counties also were adjacent to Bradford and Lycoming counties but are excluded because their population counts were too small to be estimated in the 2005/7 ACS data.
- 19. The Center for Rural Pennsylvania Page | 19 As with other housing information, the pattern of change is not consistent across regions of Pennsylvania or the study counties. Among all northern tier and southwest counties, Bradford County had the lowest percentage of renters spending 30 percent or more of income on housing in 2000. In 2000, 29 percent of Bradford renter households lived in housing that was not affordable. In 2009-11, 36.7 percent of renter households in Bradford County lived in housing that was not affordable. In Lycoming County, in 2000, 35.6 percent of households paid more than 30 percent of their income on gross rent. In 2009-11 when 46.2 percent of households paid rent that was 30 percent or more of their household income. In Greene County, 46.1 percent of renter households lived in housing that was not affordable in 2009/11 (See Table 14) compared to 32.5 percent of renter households in 2000. Housing affordability among renters by Marcellus Typology is shown in Table 15. In 2000, the largest percentage of renters paying 30 percent or more of income for housing was in the Marcellus 2nd Tier counties. However, there was little variation across typologies. Overall, the largest increases in those paying 30 percent or more of their income on rent occurred from 2000 to 2005/07. Table 14. Percentage of renters spending more than 30% of income on rent, Southwest Pennsylvania 2000 2005/07 2009/11 Southwest* 33.3 40.1 42.1 Greene 32.5 41.5 46.1 Washington 33.5 39.3 42.8 Adjacent counties only 33.5 40.0 40.9 Fayette 34.0 38.6 39.6 Allegheny 36.9 46.0 44.7 Beaver 32.0 37.4 42.4 Westmoreland 30.9 37.9 36.9 Pennsylvania 35.6 43.1 46.1 Source: Social Explorer Tables. Census 2000, ACS 2005 to 2007 and ACS 2009 to 2011 (3-Year Estimates), Social Explorer; U.S. Census Bureau; * County average for the 6-county region (includes study counties).
- 20. The Center for Rural Pennsylvania Page | 20 Table 15. Percentage of renters spending 30% or more of income on rent, Marcellus Typology 2000 2005/07 2009/11 Core, high-drilling activity (N=7) 32.8 38.7 42.3 Core, low-drilling activity (N=12) 31.6 37.1 39.4 Marcellus 2 nd Tier (N=19) 34.6 39.1 44.3 Urban, in the Marcellus Shale, Core or 2 nd Tier (N=6) 33.5 40.7 42.1 No Marcellus Shale (N=23) 31.2 37.6 43.7 Source: Social Explorer Tables. Census 2000, ACS 2005 to 2007 and ACS 2009 to 2011 (3-Year Estimates), Social Explorer; U.S. Census Bureau. Household Incomes of Owners and Renters A lack of affordable housing may develop because of increased housing costs or declining incomes, housing costs that decline more slowly than incomes or increase faster than income, or some combination of these factors. Table 16 shows the median household income adjusted to 2012 dollars for the study counties in each time period. Median household incomes are provided separately for those in owner-occupied units and those in rental units. The changes in median household incomes of those in owner-occupied housing in the four study counties differed. In Bradford County, median household income dipped from 2000 to 2005/07 before rising again, although it did not get back to 2000 levels by 2009-11. In Lycoming County, median household income declined slightly across each time point. In contrast, median household income in the southwest counties showed a slight increase of about $800 over each time period. Greene County median household income declined slightly from 2000 to 2005-07, but then rose to levels above those in 2000 by 2009-11. Washington County’s owner-occupied households experienced an increase in median household income from 2000 to 2005-07 and a slight decline by 2009-11, although it remained above the 2000 values. Owner-occupied households in the two southwest study counties and the region had higher inflation-adjusted median household incomes in 2009/11 than in 2000. This was not the case in the northern tier or in the state overall. Nearly across the board, renters in Pennsylvania, in the two regions, and in Bradford, Lycoming, and Washington counties fared poorly over the study period, with lower inflation-adjusted median household income in 2009/11 than in 2000. Only Greene County renters had median household incomes in 2009/11 that were comparable to those in 2000. The median household income of renters compared to home owners declined from 2000 to 2009/11. In Pennsylvania, renter median household income in 2000 was 51.7 percent of owner median household income, a figure that dropped to 44.6 percent by 2009/11, which is decline of roughly 7 percentage points. In the southwest the decline in household income of renters compared to owners from 2000 to 2009/11 was 6.5 percentage points. The northern tier had the smallest decline in renter median household income relative to that of owners (3.6 percentage points). Renter’s median household income was 52 percent that of owners in 2000 and dropped to 48.4 percent of owners in 2009/11.
- 21. The Center for Rural Pennsylvania Page | 21 Table 16. Median Household Income by Tenure (adjusted to 2012 dollars), Study Counties, Regions and the State 2000 2005/07 2009/11 2000 2005/07 2009/11 Owners Owners Owners Renters Renters Renters Pennsylvania $65,838 $65,003 $64,861 $34,019 $29,830 $28,928 Northern Tier* $54,754 $52,643 $53,153 $28,460 $26,395 $25,751 Bradford $54,836 $48,760 $52,548 $30,407 $27,174 $25,689 Lycoming $56,599 $55,405 $54,607 $29,521 $25,495 $24,614 Southwest* $56,930 $57,181 $57,915 $27,624 $24,377 $24,332 Greene $50,422 $49,251 $54,487 $22,406 $19,379 $22,177 Washington $60,604 $63,398 $62,371 $28,282 $24,990 $24,820 Source: Social Explorer Tables. Census 2000, ACS 2005 to 2007 and ACS 2009 to 2011 (3-Year Estimates), Social Explorer; U.S. Census Bureau. * County average for the region, includes study counties The information on median household income for those in owner-occupied units and those in rental units suggests that the decreasing affordability of rental housing may be attributed, in part, to lower inflation-adjusted income among renters, and likely to higher rents. These figures understate the extent of this decline in housing affordability, as those individuals and families who could no longer afford local rents were doubling up with family or friends, had moved to shelters, or left the area to find more affordable housing. The final comparison of median household incomes is for counties organized by Marcellus Typology shown in Table 17. Among those in owner-occupied housing, median household income of those households in Core counties (both high and low drilling) decreased modestly by 2005/07, but then recovered to near or above 2000 levels by 2009/11. Even at that point, median household incomes in these counties were below those in every other category. In the other three categories of Marcellus Typology, median household income declined from 2000 to 2005/07, and remained below the 2000 level in 2009/11. This signals a decline in median household income among home owners, essentially across the state. Among renters living in these counties, average median household incomes declined by a minimum of roughly $2,000 from 2000 to 2005/07. There was further decline by 2009/11 in every category of the Marcellus Typology, except Core, high-drilling, where the average median household income was basically stable from 2005/07 to 2009/11. In every area, renter average median household incomes were lower in 2009/11 than in 2000. The decline in real household income, especially among renters, likely contributed to decreasing affordability of housing. The decline in median household incomes for home owners and renters suggests that an influx of gas workers with higher incomes and/or increases in earnings due to gas-related activities have not improved the incomes of the median renter or home- owner. It should be noted that temporary gas workers would not influence these income values unless they were living in rental units at the time these data were collected. The information on housing availability, vacancies and median household income of those living in rental units suggests that a combination of changes in household income levels of renters and the availability of units both may contribute to housing becoming less affordable. The data from the 2000 U.S. Census
- 22. The Center for Rural Pennsylvania Page | 22 of Population and Housing and the American Community Surveys can identify patterns of change, but cannot provide information about the forces behind the change in the cost of and demand for housing. To provide insight into the forces affecting housing in the study counties, the research relied on information provided by focus group participants about whether and how the influx of families and workers associated with Marcellus Shale development influenced housing availability and affordability in the four study counties. Table 17. Median Household Income by Tenure (adjusted to 2012 dollars), Marcellus Typology Owners Renters 2000 2005/07 2009/11 2000 2005/07 2009/11 Core, high activity $53,016 $51,975 $53,356 $26,884 $24,255 $24,307 Core, low activity $51,481 $50,244 $51,015 $26,329 $24,536 $23,486 2nd Tier $56,808 $54,968 $55,824 $29,288 $26,977 $24,989 Urban Marcellus $60,323 $59,555 $59,514 $29,848 $26,018 $25,457 No Marcellus $69,453 $67,965 $67,087 $37,377 $33,984 $32,204 Source: Social Explorer Tables. Census 2000, ACS 2005 to 2007 and ACS 2009 to 2011 (3-Year Estimates), Social Explorer; U.S. Census Bureau. Marcellus Shale Development and Housing: Views from Study Counties A major component of the Marcellus Shale Impacts Project was to conduct focus groups with individuals knowledgeable about housing and human services in the study counties. In the two focus groups related to health and human services in the northern tier and southwest, individuals were invited to participate based on their knowledge of human services and housing and/or recommendations of others in the region. While the intent of these focus groups was to gather information on multiple aspects of health and human services, the conversations focused largely on housing and housing-related issues. The focus group conversations identified several processes by which Marcellus Shale development directly and indirectly affected housing availability and affordability in the study counties. The impacts of these processes varied somewhat by their timing and the ability of the affected community to absorb new people. Places with larger populations could more readily accommodate larger numbers of newcomers, but this still can vary by whether an area has recently experienced population growth (or decline) that affects availability of affordable housing. When most people think of housing, they envision single family homes, townhouses and apartments. The influx of natural gas and related industry workers to many communities revealed the existence of a much broader array of non-traditional housing options. These included motels and hotels, mobile home parks, campgrounds, and travel trailers parked in people’s yards and farmer’s fields. As one northern tier focus group participant said ‘It has created some problems….it’s no secret to anybody here, but the housing is the biggest issue.” Housing also was identified as always a problem in the southwest where a focus group participant indicated, “Housing has always been a problem here… ” These existing problems
- 23. The Center for Rural Pennsylvania Page | 23 were exacerbated by the influx of gas-related workers (Lycoming County Department of Planning and Community Development, 2012). In the northern tier focus group, one participant indicated that his/her organization conducted a survey of residents every 3 years, and that the housing issue ranked 20 or so in 2006 but rose to number 7 in 2009 and number 1 in 2012. Four different housing-related issues that capture the variation in situations experienced in both regions are described below. Issue 1. Higher rents and displacement of local residents. Gas workers and many subcontractors or related industry workers (called gas workers) receive a housing allowance, and may have higher incomes than what most local residents earn. As a focus group participant in the southwest stated, “Before Marcellus Shale, we didn’t have many problems with clients finding homes. The landlords worked with the low income….prior to Marcellus Shale, you could probably find an apartment for $300 or $400 easily….but now it’s just, in some cases impossible for people to find housing.” The housing allowance makes it possible for gas workers to offer to pay higher rent to obtain an apartment or rent a house. A southwest focus group participant reported “…they’re paying $1,400 a month rent….The people that are able to afford the $1400 a month rent is because they might be lucky enough to be in the one job….that’s offering them the prevailing wage...where they’re getting $150 a day for living expenses. That is not the case for each one.” The increased demand for housing caused local landlords to raise rents, often displacing local renters who were not able to pay as much as the incoming workers. A northern tier participant talked about the increase in rents noting, “The unavailability of affordable housing for the mid-level employee…especially maybe the lower wage earner that may have been paying $400 or $500 a month for rent, now can’t find anything for that.” In another example, a landlord in a mobile home park gave all current residents notice that the rents would be raised as of a certain date and evicted the current residents. The mobile homes were then improved and rented to gas workers at higher rates. The displaced individuals and families lost their homes and neighbors. A northern tier participant reported, “We’re seeing…the evictions…with the housing costs going up, and rent, and people aren’t able to afford it, so families are moving out...” It is unclear where these displaced individuals and families go to find affordable housing. In the southwest, the influx of gas workers was preceded by foreclosures. “The people that were foreclosed upon took the housing that the low income could afford, because they had nowhere else to go.” “The renters….have to increase their incomes or they end up doubling up with people.” “…there’s a lack of affordable housing—safe, decent housing.” Issue 2. Gas-related workers living in hotels and motels. Other companies rented available hotel and motel rooms for extended periods to provide worker housing. Because rig workers often work 12 hours on and 12 hours off, workers would share rooms so that one worker would be in the room while the other was at work. In other instances, workers and their families lived in hotel or motel rooms. This posed problems for the hotel/motel management in finding an opportunity to clean the rooms and make repairs, but equally important, motel and hotel rooms were no longer available for tourists and visitors to the area. A northern tier resident, noted that, “…the hotels are booked with a lot of Marcellus Shale workers, or they were at least….For a time you couldn’t get a hotel room for 60 miles, anywhere.” This quote also suggests the uncertainty about when hotel and motel rooms would be occupied by gas workers and how quickly the gas workers could move to other locations. A problem for local governments related to this longer-term occupancy of hotel and motel rooms is that the hotel room tax, levied by local government, is only charged the first 30 days the same person stays in a room. After that, the tax is no longer paid (Pennsylvania Code, Chapter 38. Hotel Occupancy Tax). The revenue from this tax is targeted to local tourism boards and used for tourism promotion. The shift in use of hotel and motel rooms to long-term occupancy has reduced this source of revenue, further impacting a part of the local economy already affected by the lack of available hotel and motel rooms.
- 24. The Center for Rural Pennsylvania Page | 24 There has been construction of new hotels in three of the study counties to meet increased demand. In the longer run, this may increase tourism options in the study counties and regions where these facilities are located. Issue 3. Low income housing, homelessness and housing quality. Focus group participants reported that local landlords, who had provided rental units to low-income families through Section 8 housing, raised rents and opted to rent to gas-related workers instead. The rents that gas and gas-related workers are willing to pay are higher than the maximum amount of subsidy available to low-income families. One northern tier focus group participant said “We have seen our public housing waiting list almost triple since…2008.” Another from the southwest indicated “The waiting list (for Section 8) doesn’t even—it hasn’t been open for 2 years.” This means they are not taking new applicants because they have been unable to find housing for those already on the list. Low-income families, often long-time residents of an area, are then displaced from local housing. They end up couch-surfing, moving in with other family members, living in tents or cars, or finally leaving the area in search of affordable housing. One of the related issues that arose in the analysis of Census and ACS data is that county-level census data collection occurs by identifying people through housing units. When people are displaced from permanent residences, they may not be correctly counted in these data. Consistent with this issue, a northern tier participant stated: “You’re not seeing homeless people sleeping on the street, but they’re couch surfing. They are living with their parents. They are living in multiple households in one structure…They’re just finding shelter wherever they can…What worries me about that is that we’re talking about whole families….being displaced.” One homeless shelter in the northern tier indicated they had sheltered 450 individuals, “…100 of them were children.” They indicated this was a large increase and there was difficulty staffing the shelter. Another complication in housing availability and quality identified by focus group participants is elders living in single-family homes they could no longer afford to maintain. The lack of nice, affordable apartments, or senior housing, made it difficult for elders to find alternative housing. Efforts to build or rehabilitate existing units for elders are intended to free up the houses for others. One southwest participant explained, “We are working on a developer for senior housing to come in….to offer them affordable living, because a lot of your seniors are living in these homes that now are starting to fall apart, and they can’t fix them. They don’t have the income….The idea is to be able to offer them affordable housing, to where they’ll sell their houses, then, to possibly a landlord that will then work with us for our low income.” In some cases, however, housing that became available had been neglected for too long and was too dilapidated to remodel. Another southwest participant noted that “…some places…they’re in such bad shape that they can’t live there anymore.” The age of much of the housing stock also made it less attractive to the higher-paid newcomers who sought different, modern amenities in a newer style home. In the northern tier, a participant stated that, “Even with some of the people that are coming in with the influx---number one it is a lack of housing, but it’s the kind of housing that’s available…they don’t want older houses.” Consistent with the earlier concern about the quality of housing, the poor, and in some cases declining quality of available rental housing, was identified as an issue, especially in light of increased rents. One focus group participant in the southwest observed that, “Once they’ve (the gas workers) moved in, they’ve basically destroyed the apartments. Then, the landlords don’t want to redo the apartments, and they’ve raised the rent from…maybe $400 to $1,000 a month. Now the landlord wants that money again, and …your low income, for homeless, there’s no way they can afford that.” Housing thought to be in poor condition now brings double the rent, “They own…a crappy little house that they used to charge $700 a month rent. They did nothing to it, and now they’re getting $1,400.” Housing is now more expensive and less available with little increase in quality. Low income individuals and families have
- 25. The Center for Rural Pennsylvania Page | 25 been displaced with few options but to find other temporary housing situations locally, move elsewhere or become homeless. Issue 4. Transience of gas-related workers and alternative housing. The short term nature of many Marcellus-related jobs, and the uncertainty of where and when Marcellus drilling and development will occur, makes predicting shifts in demand for housing very difficult. Depending on their occupation, some gas workers move frequently for their jobs. This perception was widely held by focus group participants, as one northern tier participant explained: “I believe many of them are temporary. They’ll come on a job and work a couple of months, and then their part of that job is done, and they go back.” Some of these workers have travel trailers or motor homes that they move to each new work location. This may be partly in response to a lack of available rental housing. “These people were bringing those campers in, because…all the apartments were being rented out. There was nothing else left,” stated a southwest participant. The location of these travel trailers has emerged as an issue. These houses on wheels tend to initially be parked in existing private campgrounds. This reduces the availability of these facilities for tourism and local recreation. Local landowners also take the opportunity to set up areas in their yards or in farm fields where these travel trailers can be parked. Some provide water and sewer hook-ups and can generate more income from renting these travel trailer pads than from farming (author conversation with retired farmer in the northern tier). One golf course in the southwest converted a golf driving range to camp sites for travel trailers, “…they used to have a driving range there. They cleared that out and put space for 70 camper sites…they are charging $700 for a little spot to put your trailer.” Local planning and zoning regulations may or may not have requirements related to water and sewer service and density of units for travel trailers and mobile homes. Finally, some of the workers bring their families, creating challenges to local school districts. One challenge is obtaining the school records of these children who may move frequently (See Report #3 on education for more information). Summary and Implications Housing has been identified as an important issue during Marcellus Shale Development. Using largely qualitative data from interviews with local elected and appointed officials, realtors, and gas company employees, Williamson and Kolb (2011) document a substantial set of concerns related to housing that arose in areas of Pennsylvania affected by Marcellus Shale development. Their report also provides specific examples of the processes by which natural gas extraction might affect demand for housing and identifies some alternative factors influencing housing in the study counties. That information is used in the summary that follows. Farren, et al. (2013) used secondary data for 2000 and 2007/11 (Census, Bureau of Economic Analysis Profiles, and ACS 5-year estimates) and multivariate analysis for 144 counties in Pennsylvania, Ohio, New York and West Virginia, to examine the relationship between wells drilled and employment in the gas industry and housing vacancy rates, fair market rent and median home values. They found a positive relationship between wells drilled in intensely drilled counties in Pennsylvania and fair market rent, and no relationship between median homing values and vacancy rates and wells drilled or employment share in the energy sector. These multivariate model results are consistent with our interpretation of the descriptive data used in this report. Previous research has suggested that the largest impacts of Marcellus activity are likely to be seen in the counties with the most active drilling and the smallest populations (Farren, et al., 2013; Williamson and Kolb, 2011). These would be Bradford and Greene counties in this study. Larger population counties are believed to have more capacity to absorb new residents because they have a larger housing stock and likely have more capacity to build new housing. In this study, Lycoming and Washington counties fall in this category. It is important to consider other changes taking place at the time that Marcellus activity
- 26. The Center for Rural Pennsylvania Page | 26 occurred. Williamson and Kolb (2011) noted that a casino was built recently in Washington County and a gas company recently built worker housing in the northern tier of Pennsylvania. The effects of an influx of workers to build and then staff the casino are difficult to distinquish from the effects of an influx of Marcellus Shale-related workers. The Census and ACS data report all housing characteristics and transactions, not just those related to Marcellus activity. A final consideration is that activities supporting the gas industry may not be located proximate to areas of heavy drilling. Regional headquarters and staging areas can be located near drilling areas or where access to transporation routes, office buildings or storage facilities and housing is good. As described in Williamson and Kolb (2011) regional headquarters require employees with different knowledge and skills than those working on gas rigs or who prepare roads and drilling sites. These headquarters employees also are more likely to stay in the area longer and to prefer buying to renting housing. The characteristics of gas and gas-related workers in a county and the timing of various activities influence the demand for different types of housing and related services. Both Bradford and Washington counties are home to regional offices of gas companies. Lycoming County has become a location for companies that support the gas industry. This dispersion of gas-related activity to counties other than those experiencing the largest volume of active drilling may result in smaller differences observed between counties with active drilling and those with minimal or no drilling activity. This research used secondary data and information from focus groups to examine change in housing. The information from the Census and ACS data show few consistent patterns of change in housing characterstics across the study counties. In particular, this study used Census and ACS data to examine changes in housing stock (number of units and age of units), housing occupancy (owner-occupied, rented or vacant), housing value, and housing affordability. The focus groups, on the other hand, suggested more consistency in issues identified in the southwest and northern tier and also that gas workers and residents were affected by changes in the housing market. The focus group findings were more consistent with the details reported by Williamson and Kolb (2011). Information on temporary housing and displacement of individuals or families from housing come from the focus groups, as this is not captured in the secondary data. Housing Stock: There were no obvious patterns of change in housing stock in the study counties overall, by region or county population size. Other factors, in addition to Marcellus activity, seemed to be influencing new construction and demolition of housing units. This was confirmed by changes in the age of the housing stock over the study period. Greene County in particular showed loss of older units at the end of the decade as the number of housing units increased by mid-decade and then declined as the median year that housing was built changed from 1953 to 1959. Williamson and Kolb (2011) attribute an improvement in the housing stock of Greene County to the purchase and demolition of older housing by a coal company that had undermined and destabilized the housing through long-wall mining. Greene County also has become a location for individuals who work in Morgantown, West Virginia to buy or build homes. Lycoming County also had increases and then declines in housing stock, while housing units in Washington and Bradford counties grew over the decade. This growth in housing stock is consistent with the growth in population in Bradford County during the first part of the decade and the growth in Washington County’s population throughout the decade. The growth in Washington County has been attributed to the expansion of the Pittsburgh suburbs (Williamson and Kolb, 2011). The decline in population in Bradford County by the end of the decade may be reflected in the increase in vacancy rates of housing. Occupancy of Housing: Shifts in the demand for housing across counties are reflected in housing used as rental units and vacancy rates of housing across counties. The share of housing that was owner- occupied, rental or vacant varied more over the decade in Greene and Bradford counties—counties with
- 27. The Center for Rural Pennsylvania Page | 27 smaller populations and more limited housing stocks pre-Marcellus. But, the patterns differed over the decade. Different factors affecting the demand for housing across the study counties can be seen in the relatively large increase in the percentage of vacant units in Bradford County at the same time that the vacancy rate declined in Greene County. Washington and Lycoming counties had more stability in rental and vacancy rates consistent with larger populations and housing stock. Washington County had the highest percentage of housing that was owner-occupied and the lowest vacancy rates across the decade. Housing Value: The median value of owner-occupied housing increased more slowly in the study counties than in the state at the beginning of the decade (pre- or early-Marcellus). By the latter part of the decade, median housing values in the northern tier counties increased faster than the state and the southwest study counties. Despite the percentage increase in median housing values, by the end of the decade the median value of owner-occupied housing in the study counties remained well below the state average and the increase for the decade was below that for the state as a whole. Washington County had the highest median housing values across the decade and Greene County the lowest. These data suggest increased demand for housing in the study counties, relative to the state, during the period of Marcellus Shale drilling. Earlier in the decade the increase in median housing values in the study counties lagged well behind the state, especially in Bradford and Lycoming counties where the median housing values increased more at the end of the decade than the beginning. Affordable Housing: Over the decade, the affordability of housing for renters declined, but there was no clear pattern with Marcellus activity or population size of the study counties. At the end of the decade, both Lycoming County and Greene County had just under half of renters paying 30 percent or more of their income in rent—close to the Pennsylvania average. Rental housing in Washington County was more affordable than that in Greene County, possibly reflecting higher incomes in Washington County. Bradford County rental housing remained most affordable among the study counties, despite a decline in median income of renters. This suggests a drop in rent that is consistent with the higher vacancy rates in Bradford County at the end of the decade. The decreased affordability of rental housing in Lycoming County is consistent with the decrease in median household incomes of renters. The decreased affordability of rental housing in Greene County occurred as median renter income increased, suggesting an increase in rent occurred. Displacement of low-income families and individuals from housing may result in housing appearing to be more affordable than it actually is. Only those who can afford the rent and initial costs to rent housing are included in the data. Temporary Housing: The aggregated Census and ACS data at the county level provide limited information on changes since 2011 and do not reflect experiences of those who reside in temporary housing or who have been displaced because of increases in rent or loss of income. Temporary housing units (e.g., travel trailers, motels and hotels) are not counted as housing units in the U.S. Census or the American Community Survey. Use of temporary housing was identified by focus group participants in both regions, and in prior studies, as a housing strategy used by gas workers and low-income families. Gas industry workers were more likely to opt for hotels and motels, especially if they provided house- keeping and meals (Williamson and Kolb 2011). Displacement of local people from existing housing due to increased rent, resulted in increased homelessness among low-income individuals and families. Homeless individuals are very difficult to identify and contact and are not identified in Census or ACS data which are based on sampling housing units. The impacts of gas industry and gas-related workers who move to the area and live in rental units or purchase homes are captured in the Census and ACS data. It is difficult to determine how many gas- related workers remain in an area long-term when compared to those workers who move with the active drilling and pipeline construction operations. Overall, the Census and ACS data did not reveal
- 28. The Center for Rural Pennsylvania Page | 28 clear-cut trends related to housing and Marcellus Shale development. This is partially because of the difficulty of disentangling other changes (e.g., casino construction) from Marcellus Shale development. The unique situations in each region and county, other than Marcellus activity, also influence the changes in housing that occur. Another issue is that those who move in with family or friends temporarily, or “couch surf,” are unlikely to be captured in Census and ACS data. Also missed are those living in temporary housing, such as hotels and motels. These individuals contribute to the local economy by purchasing food and supplies, and through the hotel tax levied the first 30 days a room is occupied by the same individual. A major underlying issue associated with Marcellus Shale development is the lack of prior knowledge on the part of local people about the coming influx of workers and those seeking work, and the uncertainty about how long additional housing and services will be needed (Lycoming County Department of Planning and Community Development, 2012). Short of moving mobile, temporary housing for workers into an area, construction of new housing takes time and resources to address an increase in the demand for housing. Even rehabilitation of single family housing to rooming house situations requires time, money and housing that is available to be rehabilitated. Descriptions of the influx of Marcellus workers suggest varying housing needs in terms of the type of housing and length of time housing is needed. This depends on jobs the workers hold and the phase of natural gas production (Williamson and Kolb, 2011; Farren et al., 2013). Unfortunately, gas companies rarely alert local government officials that they plan to move into an area to drill, how fast they intend to increase drilling activity or how long they plan to stay. This makes preparing for an influx of workers and addressing their housing needs difficult. In addition, the largest numbers of workers moving to an area tend to be those working in the active drilling phases of gas extraction—these workers also are the most mobile and most likely to be moved from one location to another. Gas industries claim that drilling in the Marcellus Shale (or related shales) will continue over decades, however they fail to relay to local officials the more nuanced reality that while drilling and extraction will occur over decades—that activity will be quite mobile and geographically dispersed within the ‘Shales.’ Activity moves from one area to another in response to changes in the price of natural gas, the type of gas produced, the availability of pipelines to carry gas to processing facilities or to markets, and the discovery of new, richer, gas fields elsewhere. Any responses to meeting the housing needs of temporary workers should focus on preparing temporary facilities and building more permanent structures that would meet the needs of gas workers in the short run, but could then be adapted for use for tourism, safe housing for elders and/or units that can be modified to provide comfortable housing that low-income families can afford (Lycoming County Planning Department, 2012). The rapidity with which natural gas activity can move to another region was experienced by Pennsylvania’s northern tier counties when natural gas prices dropped and gas extraction efforts shifted to focus on regions where ‘wet’ natural gas is extracted. A central Pennsylvania staging area filled with equipment, pipe and drilling rig parts was emptied out in four days as the equipment was moved—west to Ohio (researcher observation and conversation with gas worker). Local officials in the northern tier expressed a mixture of concern that the gas rush was slowing down and relief that the slowdown would provide time to make some infrastructure and housing changes that would reduce problems with traffic and housing shortages experienced during the initial gas rush (conversation between local officials and researcher). These officials were concerned about the impact on local retail stores and restaurants that had experienced increased business activity during the gas rush. The displacement of low-income families from housing so that units could be rented to individuals at much higher rents is a major initial problem facing communities, especially those with smaller populations where housing is more limited. Low-income families have few protections from being
- 29. The Center for Rural Pennsylvania Page | 29 displaced, so local social and human service providers need to be aware of the potential for the displacement of these families and the strategies the families and individuals might use to find housing, such as couch-surfing, moving in with relatives, moving to substandard units or a homeless shelter, or, in some cases, living in tents or cars. Some of these families also have been reluctant to use formal social and human services when they are displaced, placing themselves and their children at risk. As indicated in the focus groups, temporary housing for gas workers can take the form of travel trailers or RVs located in rural areas—some in longstanding campgrounds, others in people’s yards, farmer’s fields or converted golf driving ranges. Existence and enforcement of local water and sewage regulations would be essential to ensuring that water sources are safe and that the high density of RVs does not contaminate the ground or local water sources with sewage. Overall, housing related issues associated with Marcellus Shale development are described eloquently by those who work in local government and various nonprofit organizations that address housing concerns. They describe impacts on low-income families, elders and gas workers and their families, as well as difficulties faced by those trying to provide services to families affected. Secondary data, such as the Census of Population and Housing and the American Community Survey, show limited or no patterns of associations between Marcellus Shale drilling activity and housing. The issues that arise seem to be associated with the movement of individuals and families among housing units and the processes by which renters and landlords interact and respond to the influx of gas workers. These types of transitions in housing are not captured in the secondary data used in this report, but they are reflected in the comments and experiences described by those working in human services and housing in the study counties.
- 30. The Center for Rural Pennsylvania Page | 30 Acknowledgements Report authors: Diane K. McLaughlin, professor of Rural Sociology and Demography, Anne DeLessio- Parson, graduate student in Rural Sociology, and Danielle Rhubart, graduate student in Rural Sociology, Pennsylvania State University. The Marcellus Shale Impacts Study Project Team Kathryn J. Brasier, Associate Professor of Rural Sociology Lisa A. Davis, Director of the Pennsylvania Office of Rural Health and Outreach Associate Professor of Health Policy and Administration Leland Glenna, Associate Professor of Rural Sociology Timothy W. Kelsey, Professor of Agricultural Economics and Co-Director of Penn State’s Center for Economic and Community Development Diane K. McLaughlin, Professor of Rural Sociology and Demography Kai A. Schafft, Associate Professor of Education and Director of Penn State Center on Rural Education and Communities Kristin Babbie, Graduate Assistant in Rural Sociology Catharine Biddle, Graduate Assistant in Educational Leadership Anne DeLessio-Parson, Graduate Assistant in Rural Sociology Danielle Rhubart, Graduate Assistant in Rural Sociology and Demography Namrata Uberoi, Ph.D. candidate in Health Policy and Administration The project team gratefully acknowledges support from the following: the Department of Agricultural Economics, Sociology and Education in the College of Agricultural Sciences at Penn State; the Pennsylvania Office of Rural Health; the Department of Education Policy Studies in the College of Education at Penn State; The Pennsylvania State Univeristy Children, Youth, & Families Consortium; and the Penn State Institutes for Energy and the Environment. We also thank Penn State’s Survey Research Center for their assistance with the focus groups. Several individuals contributed to the project through background research, data collection and analysis, including Matthew Filteau, Mark Leach, Kylie Davis, Kirsten Hardy, and Kaitlyn Chajkowski. We appreciate their hard work. We gratefully acknowledge the members of our advisory committees who provided us with important insights at key points in the project and gave us access to data sets. We also thank the community members and county commissioners who shared their experiences through focus groups and interviews. We greatly appreciate their time, assistance, and insights. The authors maintain responsibility for any errors.
- 31. The Center for Rural Pennsylvania Page | 31 References Dell, Ben P., Noam Lockshin, and Scott Gruber. 2008. “Bernstein E&Ps: Where Is the Core of the Marcellus?” Report published by Sanford C. Bernstein & Co., LLC, a subsidiary of AllianceBernstein L.P. New York, NY. DEP Office of Oil and Gas Management: Wells Drilled by County. Pennsylvania Department of Environmental Protection. http://www.depreportingservices.state.pa.us/. Accessed July 4, 2013. Economic Research Service, USDA. 2013. Rural-Urban Continuum Codes: Documentation. http://www.ers.usda.gov/data-products/rural-urban-continuum-codes/. Farren, Michael, Amandan Weinstein, Mark Partridge and Michael Betz. 2013. Too Many Heads and Not Enough Beds: Will Shale Development Cause a Housing Shortage? The Swank Program in Rural- Urban Policy, The Ohio State University, Columbus, Ohio. Retrieved from http://go.osu.edu/shale_housing_rpt. Kelsey, Timothy W., Riley Adams, and Scott Milchak. 2012. Real Property Tax Base, Market Values, and Marcellus Shale: 2007-2009. CECD Research Paper Series. http://cecd.aers.psu.edu. Lycoming County Department of Planning & Community Development. 2012. The Impacts of the Marcellus Shale Industry on Housing in Lycoming County. Retrieved from http://www.lyco.org/Departments/PlanningandCommunityDevelopment.aspx. McLaughlin, Diane K., Molly A. Martin, April L. Gunsallus, Kathy Brasier and Kelly D. Davis. 2012. “Does Marcellus Shale Natural Gas Extraction Contribute to Increasing Inequality Among Pennsylvania’s Families and Communities?” Paper presented at the Annual Meeting of the Rural Sociological Society, Chicago, Il., August. Social Explorer Tables: Census 2000 (SE), Social Explorer; U.S. Census Bureau. http://www.socialexplorer.com/ Accessed July 12, 2013. Williamson, Jonathan and Bonita Kolb. 2011. Marcellus Natural Gas Development’s Effect on Housing in Pennsylvania. Center for the Study of Community and the Economy (CSCE). Retrieved from http://www.housingalliancepa.org/sites/default/files/resources/Lycoming- PHFA%20Marcellus_report.pdf. Wrightstone, G. (2008). Marcellus Shale Geologic Controls on Production. Texas Keystone Incorporated. http://www.papgrocks.org/wrightstone_p.pdf. Accessed October 8, 2012.
- 32. The Center for Rural Pennsylvania Page | 32 Appendix A: Unconventional Wells Drilled by County and Year, 2005-2013 county name 2005 2006 2007 2008 2009 2010 2011 2012 2013* Total, county Bradford+ 1 2 2 24 158 373 396 164 66 1186 Washington+ 5 19 45 66 101 166 155 195 120 872 Tioga 0 1 0 15 124 273 272 122 13 820 Lycoming+ 0 0 5 12 23 119 301 202 89 751 Susquehanna 0 1 2 33 88 125 205 191 102 747 Greene+ 0 2 14 67 101 103 121 105 54 567 Westmoreland 1 0 4 33 39 49 59 42 22 249 Fayette 0 2 6 20 57 44 54 43 12 238 Butler 0 3 12 11 10 35 35 69 44 219 Armstrong 0 3 2 7 19 36 35 44 26 172 Clearfield 0 0 1 6 24 39 58 19 2 149 Wyoming 0 0 0 0 2 24 71 15 25 137 Clinton 0 0 0 4 9 35 39 10 1 98 Sullivan 0 0 0 0 0 22 19 27 5 73 Potter 0 0 8 6 8 36 11 1 0 70 Elk 1 1 6 8 6 16 22 1 3 64 McKean 0 2 1 5 7 22 19 5 3 64 Centre 0 0 1 4 7 41 8 2 0 63 Indiana 0 0 0 5 6 7 21 2 0 41 Jefferson 0 0 0 3 3 7 15 9 0 37 Allegheny 0 0 0 1 3 0 5 13 8 30 Lawrence 0 0 0 0 0 0 2 16 8 26 Beaver 0 0 0 0 1 1 5 17 2 26 Somerset 0 0 1 0 7 4 7 5 1 25 Clarion 0 0 3 1 3 3 10 4 0 24 Forest 0 0 0 0 5 1 0 12 4 22 Cameron 0 0 0 3 2 3 7 0 0 15 Mercer 0 0 0 0 0 0 0 5 3 8 Cambria 0 0 0 0 2 1 3 1 0 7 Blair 0 0 0 0 0 4 2 0 0 6 Venango 0 0 0 0 0 0 2 3 0 5 Warren 0 0 2 0 0 0 1 1 1 5 Wayne 0 0 0 1 0 4 0 0 0 5 Columbia 0 0 0 0 0 1 2 0 0 3 Crawford 0 0 0 0 0 0 0 3 0 3 Lackawanna 0 0 0 0 1 0 1 0 0 2 Luzerne 0 0 0 0 0 2 0 0 0 2 Bedford 0 0 0 0 0 1 0 0 0 1 Huntingdon 0 0 0 0 0 1 0 0 0 1 Total, by year 8 36 115 335 816 1598 1963 1348 614 6833 Source: Pennsylvania Department of Environmental Protection, Office of Oil and Gas Management. *Data through June 30, 2013 (accessed July 4, 2013). + Study counties.
- 33. The Center for Rural Pennsylvania Page | 33 Appendix B. Marcellus Activity County Typology Definitions for Pennsylvaniaa Category Geological Definition Activity level Counties Core Counties with High Drilling Activityb (N=7) More than 50% of the land area is in the core Marcellus formation Annual average 64 or more Marcellus wells 2005 to 2010 Bradford, Fayette, Greene, Lycoming, Susquehanna, Tioga, Washington Core Counties with Low Drilling Activity (N=12) More than 50% of the land area is in the core Marcellus formation Annual average less than 64 Marcellus wells 2005 to 2010 Armstrong, Cambria, Cameronc , Clearfield, Clinton, Elk, Indiana, Jefferson, Potterc , Somerset, Sullivanc , Wyoming Counties in the Marcellus 2nd Tier (N=19) 1%-50% land area is in the core and 25% or more land area is in the less viable areas (2nd tier or gray areas in Figure 2) Not applicable Bedford, Blair, Butler, Carbon, Centre, Clarion, Columbia, Crawford, Forestc , Lawrence, McKean, Mercer, Monroe, Montourc , Pike, Schuylkill, Venango, Warren, Wayne Urban Counties in the Marcellus Shale--Core or 2nd Tier (N=6) Marcellus Core or 2nd Tier and identified as urban by the Center for Rural Pennsylvania Not applicable Allegheny, Beaver, Erie, Lackawanna, Luzerne, Westmoreland Counties with No Marcellus Shale (N=23) 25% or less viable Marcellus land area or no Marcellus land area Not applicable Adams, Berks, Bucks, Chester, Cumberland, Dauphin, Delaware, Franklin, Fultonc , Huntingdon, Juniata, Lancaster, Lebanon, Lehigh, Mifflin, Montgomery, Northampton, Northumberland, Perry, Philadelphia, Snyder, Union, York a See McLaughlin, et al. 2012. b Note this category includes all four study counties. c These counties are excluded from those analyses that use American Community Survey (ACS) three-year estimates, as their populations are too small to be estimated. *For more on maps, see the Penn State University Marcellus Center for Outreach and Research (http://marcellus.psu.edu) and Dell, Lockshin, and Guber (2008).