SlideShare a Scribd company logo
1 of 24
Download to read offline
Drilling for Jobs
What the Marcellus Shale could mean for New York
                                            July 2011
Drilling for Jobs
                                        What the Marcellus Shale could mean for New York
                                                                               July - 2011


                         Table of Contents

 Section                                   Title                                Page
 I.            Executive Summary                                                      3
 II.           Introduction                                                           4
 III.          The Importance of Developing                                           5
               Natural Gas Resources
 IV.           The Marcellus and Other Shale Plays                                    7
 V.            Recent Activity in Pennsylvania and                                    9
               New York
 VI.           Economic Impact of the Marcellus                                   10
               in Pennsylvania
 VII.          Real Property Tax Benefits                                         12
 VIII.         Marcellus Shale Drilling: Effects on                               13
               the County Level
 IX.           Economic Development with and                                      15
               without a Moratorium
 X.            Conclusion                                                         17
 XI.           List of Charts                                                     19
 XII.          Endnotes                                                           20
 XIII.         Bibliography                                                       21

                       This report is produced by
           The Public Policy Institute of New York State, Inc.
               Acting-President: Heather Briccetti, Esq.
      Principal Authors: Robert M. Lillpopp and Sonia A. Lindell
                Production Editor: Robert M. Lillpopp
 Contributing Editors: Michael Moran, Ken Pokalsky and Darren Suarez
                    Copy Editor: Anna M. DeLisle
                               July 2011


The Public Policy Institute of New York State, Inc. • 518/465-7511 • www.ppinys.org       2
Drilling for Jobs
                                                                              What the Marcellus Shale could mean for New York
                                                                                                                     July - 2011

Executive Summary

T      here are very few opportunities available
       to New York State with the same job-
creating potential as exploring and developing the
Marcellus Shale formation. The safe and sustainable
                                                            Once Marcellus Shale development begins, the
                                                            following economic achievements are projected:

                                                            •    In a five-county area outside of the New York
development of the Marcellus can help to transform               City watershed, with 500 wells drilled per year,
the economy in New York’s Southern Tier. The                     Marcellus Shale development could result in a
effects of the recent global recession are still                 total of more than 15,500 direct jobs and an
resonating in much of the state, and it would be                 additional 47,120 jobs by applying the 3.04
unreasonable to disregard the substantial economic               RIMS II multiplier, for a total of 62,620 jobs.
benefits that would come with utilizing this valuable
natural resource. We need only to look south into           •    Even with a moratorium in place, New York
Pennsylvania, where 48,000 private sector jobs                   landowners are seeing income from leasing the
in Marcellus Shale-related sectors were created in               drilling rights to their land. Once development
2010, to see how development of this resource has                begins, many will see royalties from producing
positively affected their citizens and businesses.               wells. In Pennsylvania some landowners have
                                                                 seen signing bonuses as high as $2,000 per
If New York fails to allow the development of this               acre and a royalty rate of 12.5 percent.
resource, the state stands to lose over $11 billion
in economic output and thousands of private sector          •    Local, state and federal tax revenues could
jobs between 2011 and 2020.i By conservative                     increase by more than $214 million (in 2010
estimates the development of the Marcellus has                   dollars) in 2015.iii
the potential to create 37,572 new jobs each year           Anti-drilling apprehension has delayed shale
in New York,ii jobs that may pay over $79,184               gas exploration in New York State, despite
annually — over double the average private sector           recent advances in wastewater technologyiv and
wage upstate.                                               support from diverse sources, including the U.S.
The Public Policy Institute (PPI) report builds off         Environmental Protection Agency.v Although
the findings of earlier studies and examines the            PPI’s report focuses solely on non-environmental
economic impact and potential private sector job            matters, it’s important to note that natural gas is
creation that developing the Marcellus Shale would          a clean burning fossil fuel which emits 60 percent
have in New York State. It compares recent job              less carbon than coal.vi Additionally, New York has
growth in Pennsylvania to counties in New York              some of the most strict environmental standards
(outside of the New York City watershed) where              in the nation — typically exceeding other states’
Marcellus Shale development is expected.                    and federal standards — and the implementation
                                                            of a new regulatory regime governing high-volume
This report compares how individual counties in             hydraulic fracturing will continue this trend.
both states have been affected by Marcellus Shale
development. It examines employment statistics              After analyzing the economic impact and
in Tioga County, New York and Bradford County,              private sector job creation associated with the
Pennsylvania — which had the most wells drilled             development of the Marcellus Shale, PPI concludes
in 2010 and also the second lowest unemployment             that New York must move swiftly to take advantage
rate in Pennsylvania in March 2010.                         of the transformative opportunity that has been
                                                            documented below the state line in Pennsylvania.
The availability of abundant natural gas and
electricity could spur new industrial development           New York has a great opportunity to continue its
and lead to gains in employment, economic output            long history of exploration and development of
and tax revenues.                                           natural gas resources and pursue an extraordinary
                                                            economic opportunity for upstate regions.


                                         The Public Policy Institute of New York State, Inc. • 518/465-7511 • www.ppinys.org   3
Drilling for Jobs
                                                                             What the Marcellus Shale could mean for New York
                                                                                                                    July - 2011

Introduction

A       nywhere from 168 trillion to 516 trillion
        cubic feet of natural gas existsvii in the
Marcellus Shale, a 95,000 square mile black shale
formation spanning from Ohio and West Virginia
                                                            contains small amounts of chemical additives
                                                            including friction reducers, bactericides and
                                                            emulsion elements. New York, along with other
into Pennsylvania and southern New York. While              states, generally require the disclosure of
exposed at the ground surface in certain regions,           chemical additives to its environmental regulatory
the Marcellus formation runs over 7,000 feet deep           agencies, with public disclosure of non-trade secret
in the Delaware River Valley along the Pennsylvania         information.
border.


                                                                           New York gained 42 jobs in Oil and Gas
                                                                           Extraction and Support Activities for Mining


                                                              Pennsylvania gained 4,355 Oil and Gas
                                                              Extraction and Support Activities for
                                                              Mining jobs from 2009 - 2010


                                                            It’s also critical to note the importance of continual
The Marcellus Shale spans the length of the                 drilling, since natural gas wells tend to have steep
Southern Tier in New York State, from Chautauqua            production decline curves (although they continue
to Greene and Ulster Counties. For this report, PPI         to produce for 30-50 years, some even longer). A
assumes no drilling will occur in and around the            certain number of wells must be drilled each year
New York City watershed.                                    in order to continue extracting a high volume of
                                                            natural gas.
The recent improvements in drilling technology
have greatly increased the viability of exploring           Now that the New York State Department of
the Marcellus Shale; namely, the combination of             Environmental Conservation (DEC) has updated
horizontal drilling and hydraulic fracturing (the           current drilling standards to avoid adverse
latter involves pumping a mixture of water, sand            environmental impacts of shale gas exploration, it
and chemicals down the well under high pressure             is important to examine the economic advantages
to create fractures in the gas-bearing rock). The           that natural gas drilling will have in terms of
fractures are held open by the propping material,           private sector job growth and increased tax
and additional gas is then able to escape into              revenue for New York.
the well. Fracking fluid is 99 percent water and


                                        The Public Policy Institute of New York State, Inc. • 518/465-7511 • www.ppinys.org   4
Drilling for Jobs
                                                                     What the Marcellus Shale could mean for New York
                                                                                                            July - 2011


                      The Importance of Developing Natural Gas
                      Resources

                      E      stimates vary on the amount of recoverable gas in the Marcellus
                             Shale — a 20 percent recovery rate would place it at 489 trillion
                             cubic feet.viii Average natural gas consumption in New York
                      State is 1.1 trillion cubic feet per year, according to the Department
                      of Environmental Conservation. Given this figure, utilizing the natural
                      gas resource right in our own backyard would be advantageous for
                      residential, commercial, industrial and electrical needs. Residential
                      consumption made up 36 percent of total natural gas consumption
                      in New York State in 2009, followed by electric generation, which
                      accounted for 31 percent of in-state consumption. Although New York
                      accounted for 5 percent of total U.S. gas consumption in 2009, it
                      produced only 0.2 percent of the nation’s total. Pennsylvania consumed
                      3.5 percent of natural gas in the U.S. and produced 1.3 percent of the
                      nation’s total.


                    New York natural gas delivered to consumers (in millions of cubic feet),
                                                 2005-2009


1,200,000


1,000,000


 800,000
                                                                                                  electric power
                                                                                                  industrial
 600,000
                                                                                                  commerical
                                                                                                  residential
 400,000


 200,000


       0
              05


                         06


                                           07


                                                            08


                                                                              09
            20


                       20


                                         20


                                                          20


                                                                            20


Source: U.S. Energy Information Administration


                      Between 2006 and 2010, U.S. shale gas production grew by an average
                      of 48 percent per year, up from an average of 17 percent annual yearly
                      growth rate from 2000 to 2006. Projections for natural gas production
                      estimate that by the year 2035, the U.S. will be producing 23.4 trillion
                      cubic feet of gas annually, far exceeding other Organization for Economic
                      Cooperation and Development (OECD) countries.


                     The Public Policy Institute of New York State, Inc. • 518/465-7511 • www.ppinys.org            5
Drilling for Jobs
                                                                                                                                 What the Marcellus Shale could mean for New York
                                                                                                                                                                        July - 2011


                                                                              U.S Gas Supply
                                                                               2008 - 2035


                                 14.00

                                 12.00
trillions of cubic feet)


                                 10.00
     production (in


                                   8.00

                                      6.00                                                                                                 Tight Gas
                                                                                                                                           Shale Gas
                                       4.00
                                                                                                                                           Coalbed Methane
                                       2.00                                                                                                Other
                                       0.00
                                        08

                                                11

                                                         14

                                                                  17
                                      20


                                                                           20
                                              20


                                                                                     23
                                                       20


                                                                                               26
                                                                20


                                                                                                        29
                                                                         20


                                                                                                                  32
                                                                                   20


                                                                                                                            35
                                                                                             20


                                                                                                      20


                                                                                                                20


                                                                                                                          20
          Source: U.S. Energy Information Administration


                           OECD natural gas production by country, 1990-2035
                           (trillion cubic feet)


                                 50


                                  40


                                  30                                                                                                       United States
                                                                                                                                           Canada
                                  20                                                                                                       Europe
                                                                                                                                           Australia/New Zealand
                                                                                                                                           Rest of OECD
                                   10
                                                                                                                                           Total

                                       0
                                  90
                                 19


                                                   00
                                                  20


                                                               07
                                                              20


                                                                              15
                                                                            20


                                                                                                25
                                                                                               20


                                                                                                                    35
                                                                                                                  20


              Source: EIA, International Energy Statistics database (as of November 2009), Projections: EIA, International Natural Gas Model (2010); and Annual
                 Source: U.S. Energy Information Administration
                            Energy Outlook 2010, DOE/EIA-0383(2010) (Washington, DC, April 2010), AEO2010 National Energy Modeling System, run AEO2010R.D111809A,
                            web site www.eia.gov/oiaf/aeo.


                                                                      The Public Policy Institute of New York State, Inc. • 518/465-7511 • www.ppinys.org                        6
Drilling for Jobs
                                        What the Marcellus Shale could mean for New York
                                                                               July - 2011


The Marcellus and Other Shale Plays

W            hile the Marcellus is the largest shale formation in the United
             States at 95,000 square miles, other shale plays in the nation
             are generating sizable revenue, output and permanent jobs.


Source: U.S. Energy Information Administration


The Barnett Shale in Texas, which covers approximately 5,000 sq. miles,
is responsible for $5.2 billion in annual output and approximately 55,385
permanent jobs.ix Projections made to the year 2015 estimate that the
effects of the Barnett Shale would result in over 108,000 jobs and $10.4
billion in output per year.x


      The Marcellus is the largest known shale
      formation in the United States, at 95,000
                   square miles.


The Public Policy Institute of New York State, Inc. • 518/465-7511 • www.ppinys.org    7
Drilling for Jobs
                                                                              What the Marcellus Shale could mean for New York
                                                                                                                     July - 2011


T       he Utica Shale exists several thousand feet below the Marcellus, and lies beneath parts of
        Kentucky, Maryland, New York, Ohio, Pennsylvania, Tennessee, West Virginia and Virginia, as well
        as Lake Ontario, Lake Erie and a section of Ontario, Canada.xi At this time there is still limited
information regarding the development of the Utica Shale, although some experts believe that the Utica
Shale in Pennsylvania — with its extreme depths, and subsequent high temperatures — will most likely
convert the natural gas to carbon dioxide, making production unlikely.xii In Ohio and New York, however,
there may be greater development potential. As evidence of the potential of the Utica Shale, Range
Resources has drilled horizontal wells in the Utica Shale and has stated that they plan to drill additional
wells.xiii


                                         The Public Policy Institute of New York State, Inc. • 518/465-7511 • www.ppinys.org   8
Drilling for Jobs
                                                                                    What the Marcellus Shale could mean for New York
                                                                                                                           July - 2011


                                    Recent Activity in Pennsylvania and New York

                                    P     ennsylvania has seen a surge in Marcellus Shale drilling in recent
                                          years. A total of 2,851 wells were drilled in Pennsylvania in 2010,
                                          approximately half of them in the Marcellus Shale. Counties with
                                    the most active Marcellus drilling last year were Bradford, Lycoming,
                                    Tioga and Washington. Over the past decade, a total of 31,914 natural
                                    gas wells were drilled in Pennsylvania.


                                                                                       Pennsylvania, wells drilled from 2008 - 2010
Wells drilled in select PA counties, 2010
                                                                        4000
                                                                        3500
   County       Marcellus       non-Marcellus
                                                                        3000
  Bradford        386                 0                                 2500
  McKean           15               199                                  2000                                                         Marcellus

   Potter          33                19                                  1500                                                         non-Marcellus

Susquehanna        92                 0                                  1000
                                                                          500
    Tioga         266                 0
                                                                            0
Washington        139                30
                                                                                  08


                                                                                                    09
 Lycoming         107                 0                                         20


                                                                                                                     10
                                                                                                  20


                                                                                                                   20
                                                                      Source: PA Department of Environmental
Source: PA Department of Environmental Protection
                                                                      Protection


                               Gas wells drilled in select NY counties, 2006-2010
                                 County            2006             2007                2008              2009              2010      TOTAL
                                 Allegany            0                 0                  2                 0                 0          2
                                 Broome               0                1                  2                 0                 0          3
                               Chautauqua           129              120                 104               22                18        393
                                Chemung               6                8                  10                1                 5         30
                                   Erie              44               64                  69               61                42        280
                                 Steuben             13                5                  5                 0                 0         23
                                  Tioga               0                8                   1                0                 1         10

                               Source: NYS DEC, downloadable well data


                                    Since the William Hart Natural Gas Well was dug in Fredonia, NY, in
                                    1821,xiv New York has seen over 75,000 oil and gas wells drilled and,
                                    according to the DEC, approximately 14,000 of them are still active.
                                    New York has seen recent natural gas drilling activity, although at a
                                    much slower rate than Pennsylvania, and without any horizontal drilling
                                    in the Marcellus Shale formation. Between 2006 and 2010, the largest
                                    number of gas drilled wells drilled was in Chautauqua and Erie Counties.


                                    The Public Policy Institute of New York State, Inc. • 518/465-7511 • www.ppinys.org                               9
Drilling for Jobs
                                                                                                 What the Marcellus Shale could mean for New York
                                                                                                                                        July - 2011

Economic Impact of the Marcellus in                                              Marcellus Shale-related industry, has a significant
                                                                                 wage advantage. The average annual wage for
Pennsylvania

T
                                                                                 Oil and Gas Extraction is $93,722, which is 139
       here are six core Marcellus Shale North                                   percent higher than the average private sector
       American Industry Classification System                                   wage in upstate New York of $39,157. In Chemung
       (NAICS) industries that have been indentified                             County the average wage for this sector is
by the Pennsylvania Department of Environmental                                  $115,387, which is over three times the county’s
Protection: Crude Petroleum & Natural Gas                                        private sector wage of $37,648.
Extraction; Natural Gas Liquid Extraction; Drilling
Oil & Gas Wells; Support Activities for Oil & Gas                                Based on data from the 4th quarter of 2006
Operations; Oil & Gas Pipeline & Related Structures                              through the 4th quarter of 2010, select Shale
Construction; and Pipeline Transportation of Natural                             industries in Pennsylvania enjoyed sizable
Gas. There are also 21 Ancillary Shale industries.                               increases in average employment:

During the lowest economic point of the recent                                   •   Oil and Gas Pipeline Construction employment
recession, private sector employment in                                              increased by 47.2 percent;
Pennsylvania fell sharply between 2008 and 2009,                                 • Sewage Treatment Facilities employment
yet certain Marcellus Shale industries held steady,                              increased by 43.2 percent;
with Oil and Gas Extraction actually gaining jobs                                • Support Activities for Mining, which
during that time period.                                                         encompasses the core Shale industry Support
                                                                                 Activities for Oil and Gas Operations, saw a 172.3
                                                                                 percent increase in employment, gaining 7,126
      Annual average employment in Oil and Gas Extraction,                       jobs — In New York, this sector saw only 1.2
                          2006-2010                                              percent growth, or an increase of eight jobs; and
  4,000                                                                          • Oil and Gas Extraction gained 2,055 jobs (98.2
  3,500                                                                          percent growth); while in New York it grew by only
  3,000                                                                          227 new jobs.
  2,500                                                        Pennsylvania
  2,000
                                                                                 Other Shale sectors with employment gains in
                                                               New York
  1,500
                                                                                 Pennsylvania include:
  1,000
                                                                                 • Pipeline Transportation of Natural Gas (6
    500
                                                                                 percent);
      0
                                                                                 • Water Supply and Irrigation Systems (10.7
        06


                                                                                 percent);
                  07


                            08


                                      09
      20


                20


                                                 10
                          20


                                    20


                                               20


                                                                                 • Other Specialized Trucking, Local (14.5
          Source: Data from PA Department of Labor &
                                                                                 percent);
          Industry and NYS Department of Labor                                   • Heavy Machinery Rental and Leasing, which
Marcellus Shale industries enjoy a significant                                   encompasses the core Shale sector Construction,
advantage over the average private sector weekly                                 Mining & Forestry Machinery and Equipment Rental
wage. In Pennsylvania, the average annual wage in                                and Leasing (19 percent);
the six core Marcellus Shale industries was $73,159                              • Engineering Services (5.1 percent);
in 2010, $27,400 greater than the average wage for                               • Testing Laboratories (9.3 percent); and
all industries statewide.xv The Standard Occupation                              • Environmental Consulting Services (9.7
Classification (SOC) salary ranges for jobs within                               percent).
the core Shale industries indicate annual salaries
ranging from $27,997 for Oil & Gas Roustabouts, to                               In addition, Pennsylvania has enjoyed substantial
$95,659 for Petroleum Engineers. The salary range                                tax benefits from Marcellus Shale drilling. Data
is even greater for ancillary Shale industries, from                             from the Pennsylvania Department of Revenue
$38,938 for Heavy & Tractor Trailer Truck Drivers to                             indicates that the industry paid over $1.1 billion
$108,014 for Engineering Managers.xvi                                            in state taxes since 2006. In terms of Corporate
                                                                                 Net Income Tax, figures for the first four months
In New York State Oil and Gas Extraction, a                                      of 2011 alone are over double what they were in
                                                                                 2010.

                                                             The Public Policy Institute of New York State, Inc. • 518/465-7511 • www.ppinys.org 10
Drilling for Jobs
                                                                                                                 What the Marcellus Shale could mean for New York
                                                                                                                                                        July - 2011


                                                     Another economic benefit from hydraulic fracturing is the revenue paid
                                                     to landowners through leases and royalties. Signing bonuses of over


                                                                              Pennsylvania Corporate Net Income Tax (in millions) from oil
                                                                                   and gas companies and their affiliates, 2006-2011*


                                                                                                                                                                   $250
                                                                                                                                                                  $200
                                                                                                                                                                  $150
                                                                                                                                                                  $100
                                                                                                                                                                  $50
                                                                                                                                                                 $0


                                                                                                                                                  11
                                                                                                                                       10

                                                                                                                                                20
                                                                                                                            09

                                                                                                                                     20
                                                                                                             08

                                                                                                                          20
                                                                                                     07

                                                                                                           20
                                                                                              06

                                                                                                   20
                                                                                            20
                                                                           Source: PA Department of Revenue
                                                                           *Data from 2011 only from Jan. - April

                                                     $2,000 per acre were not unusualxvii after new drilling technologies made
                                                     shale gas extraction more financially viable. Also — after the drilling
                                                     begins — property owners can receive royalties as a percentage of the
                                                     natural gas yield. The typical royalty rate is 12.5 percent. If New York
                                                     were to lift the moratorium on hydraulic fracturing in the Marcellus
                                                     Shale, landowners in the Southern Tier could enjoy these royalties as a
                                                     supplement to their regular income.

                                                     A recent study indicates that the total economic impact, by value added,
                                                     of Marcellus Shale-related industries in Pennsylvania was $3.87 billion
                                                     in 2009 alone, and that Marcellus natural gas producers in Pennsylvania
                                                     planned to spend over $8.7 billion in 2010.xviii This is exactly the type of
                                                     investment and economic activity that upstate New York needs in order
                                                     to recover from the economic recession.


                                                                                                                 New York, Average weekly pay in Oil and Gas Extraction, 2006-2010
Pennsylvania, Average weekly pay in Oil and Gas Extraction, 2006-2010

                                                                                                      $2,000
$1,800
$1,600
$1,400                                                                                                $1,500
$1,200                                                                  Oil and Gas
                                                                        Extraction                                                                                              Oil and Gas
$1,000                                                                                                $1,000
  $800                                                                                                                                                                          Extraction
  $600                                                                  Statewide average                                                                                       Statewide average
                                                                                                          $500
  $400
                                                                        weekly wage                                                                                             weekly wage
  $200
                                                                                                            $0
    $0
           06
                                                                                                               06


                    07         08
                                                                                                                          07


         20                                09
                                                                                                             20


                  20         20                       10
                                                                                                                                    08
                                                                                                                        20


                                         20         20
                                                                                                                                              09
                                                                                                                                  20


                                                                                                                                                         10
                                                                                                                                            20


                                                                                                                                                       20


   Source: PA Department of Labor & Industry                                                                Source: NYS Department of Labor


                                                   The Public Policy Institute of New York State, Inc. • 518/465-7511 • www.ppinys.org                                                         11
Drilling for Jobs
                                                                                 What the Marcellus Shale could mean for New York
                                                                                                                        July - 2011

Real Property Tax Benefits

M
                                                                                 Estimated Real Property Tax Payments
                                                                             Estimated Annual Production (AP) 500 mmcf
          any gas-producing states levy a severance
                                                                         Estimated Unit Production Value (UPV) $9.80 per mcf
          tax on gas production. New York does not
                                                                               Estimated Market Value of Well $ 4,900,000
          have a specific gas severance tax, but
                                                                                  Town of Owego Equalization Rate 81
instead has a significant property tax based upon
the value of gas production. Gas severance taxes               Est. Assessed Value
                                                                                   2011 Tax rate per Est. AV of Well Est. Property Tax
are generally based on either the volume or value              Of Marcellus Well
                                                                                     1,000 of AV     (in 1,000's of $'s)   dollars
of the gas production. To understand why New                        $3,920,000
York does not have a traditional severance tax it is           County Taxes                   $10.85          $3,920.00      $42,516.32
important to understand the history of New York’s              Town of Owego                   $2.95          $3,920.00      $11,564.82
real property tax assessment.                                  Solid Waste                     $0.45          $3,920.00       $1,775.76
                                                               Fire District                   $2.02          $3,920.00       $7,923.64
                                                               School                         $71.75          $3,920.00     $281,244.38
As a result of increased oil and gas prices,
                                                               Total                                                        $345,024.92
exploration and production activity intensified in the
mid 1970s and early 80s. Initially, this phenomenon
was due to increased prices paid for domestic oil
and gas as a result of higher demand, deregulation            Medina Region 3 - $11.32
and rising foreign price levels. As a result of the           Medina Region 4 - $11.32
increased production, laws were enacted in the                Onondaga Reef and Oriskany Sandstone Formation
1980’s to regulate the activities of the industry and         - $9.80
govern the assessment of oil and gas producing                Trenton Black River - $12.12
properties. At the time it was understood that                Formations other than Medina, Onondaga &
additional tax revenue derived from oil and gas               Oriskany - $9.80
production should stay with the locality.
                                                              To understand the cost of the delayed production
Prior to the reforms, assessments of oil and gas              on real property tax collection it is important to
producing properties were not uniform throughout              estimate the real property tax benefits associated
the state. Specifically, the legislation required the         with a Marcellus well. In the interest of illuminating
separate assessment of oil and gas economic units             the effects one Marcellus well has upon a specific
for producing wells.                                          locality, the following estimates are based upon the
                                                              best available information.
The estimated value of all oil and gas wells in New
York State is based upon the annual production                It is estimated that one Marcellus well in the
multiplied by the Unit of Production Value (UPV).             town of Owego, in the County of Tioga, would
The UPV is the value of each MCF (one thousand                generate $345,025 in combined real property tax
cubic feet of gas) produced in the production year.           revenue for the county, town and school districts.
In determining unit of production values, the New             It was estimated that during the first year of full
York State Office of Real Property Tax Services uses          production an average Marcellus well will produce
a discounted net cash flow approach to reflect the            500 million cubic feet (mmcf) of natural gas.
following: depreciation; depletion; income and other
taxes; capital investments; royalty interests not             Currently there is no established unit production
retained by producer; operating and maintenance               value for a Marcellus well. It is highly likely that the
expenses; other pertinent costs; and a rate of                UPV will be greater for a Marcellus well than the
capitalization that shall not be less than 17.5               currently published UPV for formations other than
percent.                                                      Medina, Onondaga and Oriskany.

On April 1, 2011, the state board of Real Property            If the UPV for Marcellus was closer to Trenton
Tax Services established the final 2011 oil and gas           Black River the well would generate $432,038 in
UPV’s. The values are as follows:                             combined real property tax revenue for the county,
                                                              town and school districts.
Medina Region 1 - $11.32
Medina Region 2 - $11.32

                                          The Public Policy Institute of New York State, Inc. • 518/465-7511 • www.ppinys.org 12
Drilling for Jobs
                                           What the Marcellus Shale could mean for New York
                                                                                  July - 2011


Marcellus Shale Drilling: Effects on the County Level

B    radford County sits among the Endless Mountain Range in
     northeastern Pennsylvania. It has 61,276 residents, ranking it 41st
in the state in terms of population. The county recently enjoyed the
lowest unemployment rate and the highest private sector job growth
in the state. This moderately-sized rural area, however, has not always
enjoyed such an economic edge.

In 2001, Bradford ranked 26th in terms of unemployment rate, with an
average slightly below that of Pennsylvania as a whole. Five years later,
in 2006, Bradford ranked 27th.

This changed as hydraulic fracturing became more and more prevalent in
the county. Bradford had the most Marcellus Shale wells drilled in 2010
(386), and the second lowest unemployment rate in the state in March
2011 (5.9 percent).

Bradford County gained 1,632 private sector jobs between Sept. 2009
and Sept. 2010, representing 8.9 percent growth, while Tioga County
(PA),which had the second most wells drilled in 2010, saw a 3.4 percent
increase in private sector growth.


             Unemployment rate, Bradford County vs. Pennsylvania, 2001-2010

           9.0
           8.0
           7.0
           6.0
           5.0
           4.0
           3.0                                                                Bradford County
            2.0                                                               Statewide

            1.0
            0.0
             01

                    02

                       03
           20

                  20


                           04
                     20


                                05
                         20


                                     06
                              20


                                            07
                                   20


                                                   08
                                          20


                                                          09
                                                 20


                                                                 10
                                                        20

                                                               20


     Source: Bureau of Labor Statistics

Comparing Bradford County to one of its neighbors across the state line,
Tioga County (NY), we find that year-to-year private sector employment
growth has steadily increased from Sept. 2006 in Bradford, while the
private sector growth rate has steadily declined in Tioga. Tioga (NY)
has a population of 49,610, according to recent census estimates, and
in March 2011, had an unemployment rate of 8.1 percent. Between
Sept. 2009 and Sept. 2010, private sector employment declined by 4.6
percent. According to NYS DEC data, Tioga (NY) only had one gas well
drilled in 2010.


The Public Policy Institute of New York State, Inc. • 518/465-7511 • www.ppinys.org             13
Drilling for Jobs
                                                                                                                               What the Marcellus Shale could mean for New York
                                                                                                                                                                      July - 2011


                                                                    Private sector employment growth, Bradford (PA) and Tioga (NY)
                                                                                           Sept. '06 - Sept. '10


                                                                                                                                       10.0%
                                                                                                                                       8.0%
                                                                                                                                      6.0%
                                                                                                                                      4.0%
                                                                                                                                      2.0%                      Bradford
                                                                                                                                      0.0%                      Tioga
                                                                                                                                      -2.0%
                                                                                                                                      -4.0%
                                                                                                                                      -6.0%
                                                                                                                                      -8.0%


                                                                                                                                 10
                                                                                                               09


                                                                                                                              20
                                                                                                    08


                                                                                                            20
                                                                            07


                                                                                                 20
                                                       06


                                                                         20
                                                    20


                                    Source: Bureau of Labor Statistics


In comparing McKean, Potter, Susquehanna, Bradford and Tioga counties in Pennsylvania to Allegany,
Steuben, Chemung, Tioga and Broome counties in New York, we find that between 2009 and 2010, private
sector employment grew in the five-county Pennsylvania region by 4.7 percent, or 2,425 jobs, while average
private sector employment in the New York region fell by -0.3 percent, a loss of 389 jobs. The counties
in Pennsylvania also saw a drop in the unemployment rate from 9.2 percent to 8.4 percent during that
same time period, while the New York State region experienced, as an aggregate, a 0.2 percent rise in
unemployment.


   New York private sector employment growth, select counties, Sept. '09 - Sept. '10
                                                                                                            Pennsylvania private sector employment growth, select counties, Sept. '09 - Sept. '10
               3%                                                                                                      9%

               2%                                                                                                      8%

                                                                                                                       7%
                1%
                                                                                       Broome                           6%
                0%                                                                     Allegany                                                                                       McKean
                                                                                                                        5%
                                                                                       Steuben                                                                                        Potter
               -1%                                                                                                      4%
                                                                                       Chemung                                                                                        Tioga
               -2%                                                                     Tioga                            3%
                                                                                                                                                                                      Bradford
                                                                                                                        2%
               -3%                                                                                                                                                                    Susquehanna
                                                                                                                        1%
               -4%
                                                                                                                        0%
               -5%
                                                                                                                       -1%


   Source: Bureau of Labor Statistics                                                                     Source: Bureau of Labor Statistics


                                                                          The Public Policy Institute of New York State, Inc. • 518/465-7511 • www.ppinys.org 14
Drilling for Jobs
                                                                   What the Marcellus Shale could mean for New York
                                                                                                          July - 2011


Economic Development with and without a
Moratorium

L   imited gas-related job growth would be excepted in New York State
    over the next decade had a moratorium on shale gas development
remain in place. For example, under current conditions, data for the
crude petroleum and natural gas extraction sector in New York State
points to an increase of only 180 jobs between 2008 and 2018. While in
Pennsylvania, this industry is expected to grow by 22.5 percent, for an
increase of 600 jobs during this time period.

              Long-Term Industry Projections in select Marcellus Shale-related industries, NY and PA,
                                                    2008-2018


                             60%

                             50%

                             40%

                             30%

   New York                  20%
   Pennsylvania
                             10%

                              0%

                             -10%

                             -20%
                                                       g
                                     on


                                                                                                                    n


                                                                                                                    n
                                                                 on


                                                                                                                  ce
                                                                                                                    s
                                                                          rs
                                                     in


                                                                                                                 ce
                                                                                                                tio


                                                                                                                tio
                                                                         cto


                                                                                                              an
                                 cti


                                                             cti
                                                  in


                                                                                                              vi
                                                                                                             ta


                                                                                                             ta


                                                                                                          ten
                                tr a


                                             M


                                                               u


                                                                                                           er
                                                                       ra


                                                                                                          or


                                                                                                          or
                                                           str


                                                                                                        gS
                                                                     nt
                              Ex


                                           or


                                                                                                      ain
                                                                                sp


                                                                                                       sp
                                                        on


                                                                   Co


                                                                                                     in
                                              f


                                                                              an


                                                                                                   an
                            s


                                                                                                   M
                                           es


                                                     gC
                         Ga


                                                                                                  as
                                                                            Tr


                                                                                                Tr
                                                                   de
                                       iti


                                                                                                d
                                                                                               Le
                                                   in


                                                                                             an
                       nd


                                                                  a
                                    tiv


                                                                          ck


                                                                                             ne
                                                               Tr
                                                   er


                                                                                             d
                      il a


                                 Ac


                                                                           u


                                                                                          ir
                                                                                         an
                                                                                         eli
                                                 ne


                                                                        Tr
                                                            ty


                                                                                       pa
                                                                                  p
                     O


                               rt


                                                              l


                                                                                      al
                                              gi


                                                           cia


                                                                               Pi


                                                                                   Re
                             po


                                                                                   nt
                                            En


                                                         e


                                                                                Re
                            p


                                                      Sp
                                        vil
                         Su


                                     Ci
                                 nda
                                vy
                             ea
                             H


Source: NYS Department of Labor, PA Dept. of Labor & Industry


The natural gas-related industry experiencing the second greatest
expected job growth in New York is Support Activities for Mining at 410
new jobs. Projected growth for these industries is almost exclusively in
the Southern Tier and Western New York. (It’s important to note that
the NYS DOL takes into account national trends and historical data
to determine the expected growth rates, and in the case of Marcellus
Shale-related industries, the moratorium on hydraulic fracturing was
considered when calculating employment projections).

Employment declines, however, are expected in other sectors
that encompass Marcellus industries. Heavy and Civil Engineering
Construction loses 1,710 jobs; Specialty Trade Contracting sees 10,660
jobs lost from 2008 to 2018. Truck Transportation and Rental and
Leasing Services lose 5,000 jobs and 4,130 jobs, respectively.


The Public Policy Institute of New York State, Inc. • 518/465-7511 • www.ppinys.org                                     15
Drilling for Jobs
                                                                                    What the Marcellus Shale could mean for New York
                                                                                                                           July - 2011

Despite the NYS DOL’s predictions for growth in Oil and Gas Extraction and Support Activities for Mining, if
the moratorium on hydraulic fracturing continues, New York will lose out on an estimated 31 (direct) jobs,
$2,267,929 in employee wages, $5.46 million in value added and $2 million in federal, state and local taxes
per well.xix

In contrast, using this same data, we can predict the economic impact of hydraulic fracturing in New York
State if the moratorium were lifted and Marcellus Shale development was permitted. Based on a projection
of 500 wells, the Empire State could gain 62,620 jobs, $2.7 billion in value added and $1 billion in local,
state and federal taxes. PPI arrives at the number for jobs by using the 31 direct jobs-per-well estimate and
applying the 3.04 multiplier for this sector of the economy. Employment multipliers vary greatly by sector: the
Milken Institute, using the BEA’s models, has assumed a 9.20 multiplier for cutting-edge biotechnology and
nanotechnology firmsxx, while the construction sector has a multiplier of 1.89.xxi

Not only will developing the Marcellus Shale result in increased revenue and private sector job growth, it will
remove some individuals from unemployment rolls and expand the tax base, helping to ease the burden on
state government and taxpayers.


       Hydraulic fracturing scenario for New York State
                              Jobs created Jobs created through
        Wells drilled/year      directly      multiplier effect Total jobs created        Value added     Tax revenue
               100                3,100             9,424             12,524              $546 million    $200 million
               200                6,200            18,848             25,048               $1.1 billion   $400 million
               300                9,300            28,272             37,572               $1.6 billion   $600 million
               400               12,400            37,696             50,096               $2.2 billion   $800 million
               500               15,500            47,120             62,620               $2.7 billion    $1 billion

       Source: Projections based on data from The Economic Opportunities of Shale Energy Development (2011)
       *RIMS II multiplier


                                If 500 wells were drilled each year, the
                                 Empire State could gain 62,620 jobs,
                                   $2.7 billion in value added and $1
                                billion in local, state and federal taxes.


                                               The Public Policy Institute of New York State, Inc. • 518/465-7511 • www.ppinys.org 16
Drilling for Jobs
                                        What the Marcellus Shale could mean for New York
                                                                               July - 2011


Conclusion
The Public Policy Institute concludes that, in evaluating the potential
development of Marcellus Shale gas, it is crucial for New York State
to consider the signficant economic potential of this natural resource,
in addition to the environmental and public health aspects. Significant
economic benefits achieved in Pennsylvania provide clear evidence of the
investment and job growth related to shale development. It would be
unreasonable for New York state government to disregard the economic
benefits that are being achieved below the state line in Pennsylvania.

We recognize that protection of public health and environmental
resources – especially public water supplies – will be a crucial element of
the state’s regulatory program for shale gas exploration. However, given
New York’s history of adopting some of the most strict environmental
standards in the nation, we expect the state’s regulation to assure the
safe development of hydraulic fracturing in New York’s Southern Tier.
New York has a great opportunity to expand its historic exploration
and development of natural gas resources, capture an extraordinary
economic opportunity for depressed regions of upstate New York and
help fuel the future of New York and the nation.

Natural gas is a clean-burning energy source and drilling in shale
plays throughout the U.S. has become more economically viable with
well-drilling technology. Exploring this technology will help reduce our
dependence on foreign energy resources, create a more robust business
climate and increase individual wealth, tax revenues and create jobs.

This report has examined the impressive private sector job growth
in Pennsylvania, a state which is at the forefront of Marcellus Shale
development, and found that counties which utilize the natural gas
resource have benefited economically. Bradford County had the highest
number of Marcellus wells drilled in 2010, along with significant job
growth (8.9 percent between Sept. 2009 and Sept. 2010) and one of the
lowest unemployment rates in the state. After examining five counties in
the Southern Tier (Allegany, Broome, Chemung, Steuben and Tioga) and
five counties just south of the New York State border (Bradford, McKean,
Potter, Steuben and Tioga), we found that the region in Pennsylvania
experienced a 4.7 percent increase in private sector employment during
2006-2010, or 2,425 jobs, while the private sector job growth in the
New York region was -0.3 percent, representing a loss of 389 jobs.

In addition, Marcellus Shale industries enjoy a significant wage
advantage. In New York, the aggregate average annual wage for Oil
and Gas Extraction and Support Activities for Mining is $79,184, which
is over double the average private sector wage in upstate New York
of $39,157. In Pennsylvania, the average annual wage in the six core
Marcellus Shale industries was $73,159 in 2010 — $27,400 greater
than the average wage for all industries statewide — according to the
Pennsylvania Department of Labor & Industry.

Pennsylvania has already experienced over $1 billion in tax revenue from
oil and gas companies and their affiliates since 2006.


The Public Policy Institute of New York State, Inc. • 518/465-7511 • www.ppinys.org   17
Drilling for Jobs
                                        What the Marcellus Shale could mean for New York
                                                                               July - 2011


In a time when New York’s economy is slowly returning to fiscal stability
after the devastating global recession, such tax benefits would be
invaluable to the Empire State.

Data from the NYSDOL indicates that Shale-related industries will enjoy
significant growth through 2018, taking into account the possibility
of a continued moratorium. However, using data from the Manhattan
Institute study we find that by banning exploration of this valuable
resource, we lose out on an average of 31 (direct) jobs and $5.46 million
in value added per well.

Restricting the development of natural gas in the Southern Tier would
be detrimental to reviving our state’s economy and a disservice to
New Yorkers who want to see good-paying jobs and investment in the
Empire State. Based on the private sector job growth potential and tax
revenues, PPI fully supports lifting the current restriction on hydraulic
fracturing in the Marcellus Shale and moving forward with a balanced
regulatory program allowing exploration and production in the Marcellus
Shale formation.


The Public Policy Institute of New York State, Inc. • 518/465-7511 • www.ppinys.org   18
Drilling for Jobs
                                                                                   What the Marcellus Shale could mean for New York
                                                                                                                          July - 2011

List of Charts
1.    New York natural gas delivered to consumers (in millions of cubic feet), 2005 - 2009
2.    U.S. gas supply, 2008 - 2035
3.    OECD natural gas production, by country, 1990 - 2035
4.    Wells drilled in select PA counties, 2010
5.    Pennsylvania, wells drilled from 2008 - 2010
6.    Gas wells drilled in select NY counties, 2006 - 2010
7.    Annual average employment in Oil and Gas Extraction, 2006 - 2010
8.    Pennsylvania Corporate New Income Tax (in millions) from oil and gas companies and their affiliates, 2006-2011
9.    Pennsylvania, average weekly pay in Oil and Gas Extraction, 2006 - 2010
10.   New York, average weekly pay in Oil and Gas Extraction, 2006 - 2010
11.   Town of Owego estimated real property tax payments, 2011
12.   Unemployment rate, Bradford County vs. Pennsylvania, 2001 - 2010
13.   Private sector employment growth, Bradford (PA) and Tioga (NY), Sept. ‘06 - Sept. ‘10
14.   Pennsylvania private sector employment growth, select counties, Sept. ‘09 - Sept. ‘10
15.   New York private sector employment growth, select counties, Sept. ‘09 - Sept. ‘10
16.   Long-term industry projections in select Marcellus Shale-related industries, NY and PA, 2008 - 2018
17.   Hydraulic fracturing scenario for New York State


                                               The Public Policy Institute of New York State, Inc. • 518/465-7511 • www.ppinys.org 19
Drilling for Jobs
                                                                                              What the Marcellus Shale could mean for New York
                                                                                                                                     July - 2011

Endnotes
i. pg. 37 of The Economic Impacts of the Marcellus Shale

ii. Data based on 31 direct jobs-per-well estimate used in The Economic Opportunities of Shale Energy Development plus 3.04 multiplier

iii. pg. 28 of The Economic Impacts of the Marcellus Shale

iv. According to the Department of Energy’s National Energy Technology Laboratory, a new water cleaning technology currently being tested has
been found to remove over 99 percent of oil and grease, over 90 percent of dissolved BTEX (benzene, toluene, ethylbenzene and xylenes) and
significant amounts of production chemicals

v. Lisa Jackson touted natural gas as a cleaner alternative to other fossil fuels in her testimony to the House Oversight and Government Reform
Committee

vi. The Economic Impacts of the Marcellus Shale (2010), Intro

vii. NYS DEC

viii. The Economic Impacts of the Marcellus Shale, intro

ix. Bounty from Below, pg. 7

x. Bounty from Below, pg. 8

xi. www.geology.com/articles/utica-shale/

xii. www.citizensvoice.com/news/expert-finding-natural-gas-in-utica-shale-is-unlikely-more-overcooked-than-marcellus-
1.1143799#axzz1PJj6fJK5

xiii. The Economic Impacts of the Marcellus Shale, pg. 27

xiv. www.nyserda.org/programs/Environment/EMEP/conference_2009/presentations/Martin_Dahl.pdf

xv. Marcellus Shale Fast Fasts, pg. 2

xvi. Marcellus Shale Fast Facts, pg. 9

xvii. Pennsylvania’s Buried Treasure

xviii.The Economic Impacts of the Pennsylvania Marcellus Shale Natural Gas Play: An Update , pg. 10-11

xix. The Economic Opportunities of Shale Energy Development, pg. 6

xx. Let’s Make It Here: Keys to a Manufacturing Resurgence in New York, pg. 8

xxi. RIMS II multiplier, www.maine.gov/labor/cwri/publications/pdf/GreenEconomyReport.pdf


                                                      The Public Policy Institute of New York State, Inc. • 518/465-7511 • www.ppinys.org 20
Drilling for Jobs
                                                                             What the Marcellus Shale could mean for New York
                                                                                                                    July - 2011

Bibliography
The Manhattan Institute, The Economic Opportunities of Shale Energy Development, May 2011

The Public Policy Institute, Let’s Make it Here: Keys to a Manufacturing Resurgence in New York, May 2011

Timothy Considine, Robert Watson and Seth Blumsack, The Economic Impacts of the Pennsylvania Marcellus
Shale Natural Gas Play: An Update, May, 2010

Considine, Timothy, The Economic Impacts of the Marcellus Shale: Implications for New York, Pennsylvania,
and West Virginia, July 2010

Bounty from Below: The Impact of Developing Natural Gas Resources Associated with the Barnett Shale on
Business Activity in Forth Worth and the Surrounding 14-County Area, The Perryman Group, May 2007

Walker, Deborah and Sonora, Robert. The Economic Impact of the Natural Gas Industry in La Plata County,
2003 - 2004, November 2005

National Energy Technology Laboratory (Department of Energy), Breakthrough Water Cleaning Technology
Could Lessen Environmental Impacts from Shale Production: DOE-funded Laboratory Testing Leads to
Multiple Field Demonstrations, April 28, 2011

www.geology.com, Utica Shale - The Natural Gas Giant Below the Marcellus?

Skrapits, Elizabeth, Expert: Finding natural gas in Utica Shale is unlikely; more ‘overcooked’ than Marcellus,
May 9, 2011

Pennsylvania Department of Labor & Industry, Marcellus Shale Fast Facts, June 2011 Edition

Environmental Protection Agency, Administrator Lisa P. Jackson Testimony before the U.S. House Oversight
and Government Reform Committee

New York State Department of Environmental Conservation

New York State Department of Labor

Pennsylvania Department of Labor & Industry, Center for Workforce Information and Analysis

Pennsylvania Department of Environmental Protection

Bureau of Economic Analysis

                                         The Public Policy Institute of New York State, Inc. • 518/465-7511 • www.ppinys.org 21
Drilling for Jobs
                                                                            What the Marcellus Shale could mean for New York
                                                                                                                   July - 2011

U.S. Energy Information Administration (EIA)
Annual Energy Outlook 2011, U.S. EIA

Utica Shale – The Natural Gas Giant Below the Marcellus? Stacked plays in the Appalachian Basin produce
multiple natural gas play zones, www.geology.com

Grant, Stephen, Pennsylvania’s Buried Treasure, Spring 2010 (http://pabook.libraries.psu.edu/palitmap/
Marcellus.html)

Maine Department of Labor, Maine’s Green Economy: An Overview of Renewable Energy and Energy
Efficiency Sectors, February 2010

Martin, John, Marcellus Shale Natural Gas: The Resource, New York State Energy Resarch and Development
Authority, October 15, 2009

Maine Department of Labor, Maine’s Green Economy: An Overview of Renewable Energy and Energy
Efficiency Sectors, February 2010


                                        The Public Policy Institute of New York State, Inc. • 518/465-7511 • www.ppinys.org 22
Drilling for Jobs
                                    What the Marcellus Shale could mean for New York
                                                                           July - 2011


         Page left blank


The Public Policy Institute of New York State, Inc. • 518/465-7511 • www.ppinys.org 23
The Public Policy Institute is the research and educational arm of The Business Council of New
York State, Inc. The organization’s purpose is to formulate and promote public policies that will
restore New York’s economic competitiveness.

PPI accomplishes this mission by conducting timely, in-depth research addressing key state
policy issues. The Institute is a non-partisan, tax-exempt, 501 (c) (3) organization. It depends on
the support of corporations, foundations and the public.

It does not accept any government funding. For more information about PPI visit our website at
www.ppinys.org.
Graphic design by Robert M. Lillpopp - Photographs by Sonia A. Lindell


Drilling for Jobs
What the Marcellus Shale could mean for New York

More Related Content

More from Marcellus Drilling News

Five facts about shale: it’s coming back, and coming back strong
Five facts about shale: it’s coming back, and coming back strongFive facts about shale: it’s coming back, and coming back strong
Five facts about shale: it’s coming back, and coming back strongMarcellus Drilling News
 
Quarterly legislative action update: Marcellus and Utica shale region (4Q16)
Quarterly legislative action update: Marcellus and Utica shale region (4Q16)Quarterly legislative action update: Marcellus and Utica shale region (4Q16)
Quarterly legislative action update: Marcellus and Utica shale region (4Q16)Marcellus Drilling News
 
Access Northeast Pipeline Project - Dec 2016 Update
Access Northeast Pipeline Project - Dec 2016 UpdateAccess Northeast Pipeline Project - Dec 2016 Update
Access Northeast Pipeline Project - Dec 2016 UpdateMarcellus Drilling News
 
Rover Pipeline Letter to FERC Requesting Final Certificate
Rover Pipeline Letter to FERC Requesting Final CertificateRover Pipeline Letter to FERC Requesting Final Certificate
Rover Pipeline Letter to FERC Requesting Final CertificateMarcellus Drilling News
 
DOE Order Granting Elba Island LNG Right to Export to Non-FTA Countries
DOE Order Granting Elba Island LNG Right to Export to Non-FTA CountriesDOE Order Granting Elba Island LNG Right to Export to Non-FTA Countries
DOE Order Granting Elba Island LNG Right to Export to Non-FTA CountriesMarcellus Drilling News
 
LSE Study: Fracking is Revitalizing U.S. Manufacturing
LSE Study: Fracking is Revitalizing U.S. ManufacturingLSE Study: Fracking is Revitalizing U.S. Manufacturing
LSE Study: Fracking is Revitalizing U.S. ManufacturingMarcellus Drilling News
 
Letter From 24 States Asking Trump & Congress to Withdraw the Unlawful Clean ...
Letter From 24 States Asking Trump & Congress to Withdraw the Unlawful Clean ...Letter From 24 States Asking Trump & Congress to Withdraw the Unlawful Clean ...
Letter From 24 States Asking Trump & Congress to Withdraw the Unlawful Clean ...Marcellus Drilling News
 
Report: New U.S. Power Costs: by County, with Environmental Externalities
Report: New U.S. Power Costs: by County, with Environmental ExternalitiesReport: New U.S. Power Costs: by County, with Environmental Externalities
Report: New U.S. Power Costs: by County, with Environmental ExternalitiesMarcellus Drilling News
 
U.S. Crude Oil and Natural Gas Proved Reserves, Year-end 2015
U.S. Crude Oil and Natural Gas Proved Reserves, Year-end 2015U.S. Crude Oil and Natural Gas Proved Reserves, Year-end 2015
U.S. Crude Oil and Natural Gas Proved Reserves, Year-end 2015Marcellus Drilling News
 
U.S. EIA's Drilling Productivity Report - December 2015
U.S. EIA's Drilling Productivity Report - December 2015U.S. EIA's Drilling Productivity Report - December 2015
U.S. EIA's Drilling Productivity Report - December 2015Marcellus Drilling News
 
Velocys Plan to "Build the Business" - Gas-to-Liquids Plants
Velocys Plan to "Build the Business" - Gas-to-Liquids PlantsVelocys Plan to "Build the Business" - Gas-to-Liquids Plants
Velocys Plan to "Build the Business" - Gas-to-Liquids PlantsMarcellus Drilling News
 
PA DEP Revised Permit for Natural Gas Compression Stations, Processing Plants...
PA DEP Revised Permit for Natural Gas Compression Stations, Processing Plants...PA DEP Revised Permit for Natural Gas Compression Stations, Processing Plants...
PA DEP Revised Permit for Natural Gas Compression Stations, Processing Plants...Marcellus Drilling News
 
PA DEP Permit for Unconventional NatGas Well Site Operations and Remote Piggi...
PA DEP Permit for Unconventional NatGas Well Site Operations and Remote Piggi...PA DEP Permit for Unconventional NatGas Well Site Operations and Remote Piggi...
PA DEP Permit for Unconventional NatGas Well Site Operations and Remote Piggi...Marcellus Drilling News
 
PA DEP: Methane Reduction Strategies for Natural Gas Operations
PA DEP: Methane Reduction Strategies for Natural Gas OperationsPA DEP: Methane Reduction Strategies for Natural Gas Operations
PA DEP: Methane Reduction Strategies for Natural Gas OperationsMarcellus Drilling News
 
US EIA's December 2016 Short-Term Energy Outlook
US EIA's December 2016 Short-Term Energy OutlookUS EIA's December 2016 Short-Term Energy Outlook
US EIA's December 2016 Short-Term Energy OutlookMarcellus Drilling News
 
Northeast Gas Association's 2016 Statistical Guide
Northeast Gas Association's 2016 Statistical GuideNortheast Gas Association's 2016 Statistical Guide
Northeast Gas Association's 2016 Statistical GuideMarcellus Drilling News
 
PA PUC Responses to Auditor General's Act 13 Impact Fee Audit
PA PUC Responses to Auditor General's Act 13 Impact Fee AuditPA PUC Responses to Auditor General's Act 13 Impact Fee Audit
PA PUC Responses to Auditor General's Act 13 Impact Fee AuditMarcellus Drilling News
 
Pennsylvania Public Utility Commission Act 13/Impact Fees Audit by PA Auditor...
Pennsylvania Public Utility Commission Act 13/Impact Fees Audit by PA Auditor...Pennsylvania Public Utility Commission Act 13/Impact Fees Audit by PA Auditor...
Pennsylvania Public Utility Commission Act 13/Impact Fees Audit by PA Auditor...Marcellus Drilling News
 
Clyde Mine Discharge/Tenmile Creek Water Quality Final Report
Clyde Mine Discharge/Tenmile Creek Water Quality Final ReportClyde Mine Discharge/Tenmile Creek Water Quality Final Report
Clyde Mine Discharge/Tenmile Creek Water Quality Final ReportMarcellus Drilling News
 
FERC Order Denying Stay of Kinder Morgan's Broad Run Expansion Project
FERC Order Denying Stay of Kinder Morgan's Broad Run Expansion ProjectFERC Order Denying Stay of Kinder Morgan's Broad Run Expansion Project
FERC Order Denying Stay of Kinder Morgan's Broad Run Expansion ProjectMarcellus Drilling News
 

More from Marcellus Drilling News (20)

Five facts about shale: it’s coming back, and coming back strong
Five facts about shale: it’s coming back, and coming back strongFive facts about shale: it’s coming back, and coming back strong
Five facts about shale: it’s coming back, and coming back strong
 
Quarterly legislative action update: Marcellus and Utica shale region (4Q16)
Quarterly legislative action update: Marcellus and Utica shale region (4Q16)Quarterly legislative action update: Marcellus and Utica shale region (4Q16)
Quarterly legislative action update: Marcellus and Utica shale region (4Q16)
 
Access Northeast Pipeline Project - Dec 2016 Update
Access Northeast Pipeline Project - Dec 2016 UpdateAccess Northeast Pipeline Project - Dec 2016 Update
Access Northeast Pipeline Project - Dec 2016 Update
 
Rover Pipeline Letter to FERC Requesting Final Certificate
Rover Pipeline Letter to FERC Requesting Final CertificateRover Pipeline Letter to FERC Requesting Final Certificate
Rover Pipeline Letter to FERC Requesting Final Certificate
 
DOE Order Granting Elba Island LNG Right to Export to Non-FTA Countries
DOE Order Granting Elba Island LNG Right to Export to Non-FTA CountriesDOE Order Granting Elba Island LNG Right to Export to Non-FTA Countries
DOE Order Granting Elba Island LNG Right to Export to Non-FTA Countries
 
LSE Study: Fracking is Revitalizing U.S. Manufacturing
LSE Study: Fracking is Revitalizing U.S. ManufacturingLSE Study: Fracking is Revitalizing U.S. Manufacturing
LSE Study: Fracking is Revitalizing U.S. Manufacturing
 
Letter From 24 States Asking Trump & Congress to Withdraw the Unlawful Clean ...
Letter From 24 States Asking Trump & Congress to Withdraw the Unlawful Clean ...Letter From 24 States Asking Trump & Congress to Withdraw the Unlawful Clean ...
Letter From 24 States Asking Trump & Congress to Withdraw the Unlawful Clean ...
 
Report: New U.S. Power Costs: by County, with Environmental Externalities
Report: New U.S. Power Costs: by County, with Environmental ExternalitiesReport: New U.S. Power Costs: by County, with Environmental Externalities
Report: New U.S. Power Costs: by County, with Environmental Externalities
 
U.S. Crude Oil and Natural Gas Proved Reserves, Year-end 2015
U.S. Crude Oil and Natural Gas Proved Reserves, Year-end 2015U.S. Crude Oil and Natural Gas Proved Reserves, Year-end 2015
U.S. Crude Oil and Natural Gas Proved Reserves, Year-end 2015
 
U.S. EIA's Drilling Productivity Report - December 2015
U.S. EIA's Drilling Productivity Report - December 2015U.S. EIA's Drilling Productivity Report - December 2015
U.S. EIA's Drilling Productivity Report - December 2015
 
Velocys Plan to "Build the Business" - Gas-to-Liquids Plants
Velocys Plan to "Build the Business" - Gas-to-Liquids PlantsVelocys Plan to "Build the Business" - Gas-to-Liquids Plants
Velocys Plan to "Build the Business" - Gas-to-Liquids Plants
 
PA DEP Revised Permit for Natural Gas Compression Stations, Processing Plants...
PA DEP Revised Permit for Natural Gas Compression Stations, Processing Plants...PA DEP Revised Permit for Natural Gas Compression Stations, Processing Plants...
PA DEP Revised Permit for Natural Gas Compression Stations, Processing Plants...
 
PA DEP Permit for Unconventional NatGas Well Site Operations and Remote Piggi...
PA DEP Permit for Unconventional NatGas Well Site Operations and Remote Piggi...PA DEP Permit for Unconventional NatGas Well Site Operations and Remote Piggi...
PA DEP Permit for Unconventional NatGas Well Site Operations and Remote Piggi...
 
PA DEP: Methane Reduction Strategies for Natural Gas Operations
PA DEP: Methane Reduction Strategies for Natural Gas OperationsPA DEP: Methane Reduction Strategies for Natural Gas Operations
PA DEP: Methane Reduction Strategies for Natural Gas Operations
 
US EIA's December 2016 Short-Term Energy Outlook
US EIA's December 2016 Short-Term Energy OutlookUS EIA's December 2016 Short-Term Energy Outlook
US EIA's December 2016 Short-Term Energy Outlook
 
Northeast Gas Association's 2016 Statistical Guide
Northeast Gas Association's 2016 Statistical GuideNortheast Gas Association's 2016 Statistical Guide
Northeast Gas Association's 2016 Statistical Guide
 
PA PUC Responses to Auditor General's Act 13 Impact Fee Audit
PA PUC Responses to Auditor General's Act 13 Impact Fee AuditPA PUC Responses to Auditor General's Act 13 Impact Fee Audit
PA PUC Responses to Auditor General's Act 13 Impact Fee Audit
 
Pennsylvania Public Utility Commission Act 13/Impact Fees Audit by PA Auditor...
Pennsylvania Public Utility Commission Act 13/Impact Fees Audit by PA Auditor...Pennsylvania Public Utility Commission Act 13/Impact Fees Audit by PA Auditor...
Pennsylvania Public Utility Commission Act 13/Impact Fees Audit by PA Auditor...
 
Clyde Mine Discharge/Tenmile Creek Water Quality Final Report
Clyde Mine Discharge/Tenmile Creek Water Quality Final ReportClyde Mine Discharge/Tenmile Creek Water Quality Final Report
Clyde Mine Discharge/Tenmile Creek Water Quality Final Report
 
FERC Order Denying Stay of Kinder Morgan's Broad Run Expansion Project
FERC Order Denying Stay of Kinder Morgan's Broad Run Expansion ProjectFERC Order Denying Stay of Kinder Morgan's Broad Run Expansion Project
FERC Order Denying Stay of Kinder Morgan's Broad Run Expansion Project
 

Recently uploaded

Geostrategic significance of South Asian countries.ppt
Geostrategic significance of South Asian countries.pptGeostrategic significance of South Asian countries.ppt
Geostrategic significance of South Asian countries.pptUsmanKaran
 
12042024_First India Newspaper Jaipur.pdf
12042024_First India Newspaper Jaipur.pdf12042024_First India Newspaper Jaipur.pdf
12042024_First India Newspaper Jaipur.pdfFIRST INDIA
 
15042024_First India Newspaper Jaipur.pdf
15042024_First India Newspaper Jaipur.pdf15042024_First India Newspaper Jaipur.pdf
15042024_First India Newspaper Jaipur.pdfFIRST INDIA
 
Emerging issues in migration policies.ppt
Emerging issues in migration policies.pptEmerging issues in migration policies.ppt
Emerging issues in migration policies.pptNandinituteja1
 
Transforming Andhra Pradesh: TDP's Legacy in Road Connectivity
Transforming Andhra Pradesh: TDP's Legacy in Road ConnectivityTransforming Andhra Pradesh: TDP's Legacy in Road Connectivity
Transforming Andhra Pradesh: TDP's Legacy in Road Connectivitynarsireddynannuri1
 
11042024_First India Newspaper Jaipur.pdf
11042024_First India Newspaper Jaipur.pdf11042024_First India Newspaper Jaipur.pdf
11042024_First India Newspaper Jaipur.pdfFIRST INDIA
 
Mitochondrial Fusion Vital for Adult Brain Function and Disease Understanding...
Mitochondrial Fusion Vital for Adult Brain Function and Disease Understanding...Mitochondrial Fusion Vital for Adult Brain Function and Disease Understanding...
Mitochondrial Fusion Vital for Adult Brain Function and Disease Understanding...The Lifesciences Magazine
 
16042024_First India Newspaper Jaipur.pdf
16042024_First India Newspaper Jaipur.pdf16042024_First India Newspaper Jaipur.pdf
16042024_First India Newspaper Jaipur.pdfFIRST INDIA
 
Power in International Relations (Pol 5)
Power in International Relations (Pol 5)Power in International Relations (Pol 5)
Power in International Relations (Pol 5)ssuser583c35
 
Political-Ideologies-and-The-Movements.pptx
Political-Ideologies-and-The-Movements.pptxPolitical-Ideologies-and-The-Movements.pptx
Political-Ideologies-and-The-Movements.pptxSasikiranMarri
 
14042024_First India Newspaper Jaipur.pdf
14042024_First India Newspaper Jaipur.pdf14042024_First India Newspaper Jaipur.pdf
14042024_First India Newspaper Jaipur.pdfFIRST INDIA
 
Foreign Relation of Pakistan with Neighboring Countries.pptx
Foreign Relation of Pakistan with Neighboring Countries.pptxForeign Relation of Pakistan with Neighboring Countries.pptx
Foreign Relation of Pakistan with Neighboring Countries.pptxunark75
 
13042024_First India Newspaper Jaipur.pdf
13042024_First India Newspaper Jaipur.pdf13042024_First India Newspaper Jaipur.pdf
13042024_First India Newspaper Jaipur.pdfFIRST INDIA
 
lok sabha Elections in india- 2024 .pptx
lok sabha Elections in india- 2024 .pptxlok sabha Elections in india- 2024 .pptx
lok sabha Elections in india- 2024 .pptxdigiyvbmrkt
 

Recently uploaded (14)

Geostrategic significance of South Asian countries.ppt
Geostrategic significance of South Asian countries.pptGeostrategic significance of South Asian countries.ppt
Geostrategic significance of South Asian countries.ppt
 
12042024_First India Newspaper Jaipur.pdf
12042024_First India Newspaper Jaipur.pdf12042024_First India Newspaper Jaipur.pdf
12042024_First India Newspaper Jaipur.pdf
 
15042024_First India Newspaper Jaipur.pdf
15042024_First India Newspaper Jaipur.pdf15042024_First India Newspaper Jaipur.pdf
15042024_First India Newspaper Jaipur.pdf
 
Emerging issues in migration policies.ppt
Emerging issues in migration policies.pptEmerging issues in migration policies.ppt
Emerging issues in migration policies.ppt
 
Transforming Andhra Pradesh: TDP's Legacy in Road Connectivity
Transforming Andhra Pradesh: TDP's Legacy in Road ConnectivityTransforming Andhra Pradesh: TDP's Legacy in Road Connectivity
Transforming Andhra Pradesh: TDP's Legacy in Road Connectivity
 
11042024_First India Newspaper Jaipur.pdf
11042024_First India Newspaper Jaipur.pdf11042024_First India Newspaper Jaipur.pdf
11042024_First India Newspaper Jaipur.pdf
 
Mitochondrial Fusion Vital for Adult Brain Function and Disease Understanding...
Mitochondrial Fusion Vital for Adult Brain Function and Disease Understanding...Mitochondrial Fusion Vital for Adult Brain Function and Disease Understanding...
Mitochondrial Fusion Vital for Adult Brain Function and Disease Understanding...
 
16042024_First India Newspaper Jaipur.pdf
16042024_First India Newspaper Jaipur.pdf16042024_First India Newspaper Jaipur.pdf
16042024_First India Newspaper Jaipur.pdf
 
Power in International Relations (Pol 5)
Power in International Relations (Pol 5)Power in International Relations (Pol 5)
Power in International Relations (Pol 5)
 
Political-Ideologies-and-The-Movements.pptx
Political-Ideologies-and-The-Movements.pptxPolitical-Ideologies-and-The-Movements.pptx
Political-Ideologies-and-The-Movements.pptx
 
14042024_First India Newspaper Jaipur.pdf
14042024_First India Newspaper Jaipur.pdf14042024_First India Newspaper Jaipur.pdf
14042024_First India Newspaper Jaipur.pdf
 
Foreign Relation of Pakistan with Neighboring Countries.pptx
Foreign Relation of Pakistan with Neighboring Countries.pptxForeign Relation of Pakistan with Neighboring Countries.pptx
Foreign Relation of Pakistan with Neighboring Countries.pptx
 
13042024_First India Newspaper Jaipur.pdf
13042024_First India Newspaper Jaipur.pdf13042024_First India Newspaper Jaipur.pdf
13042024_First India Newspaper Jaipur.pdf
 
lok sabha Elections in india- 2024 .pptx
lok sabha Elections in india- 2024 .pptxlok sabha Elections in india- 2024 .pptx
lok sabha Elections in india- 2024 .pptx
 

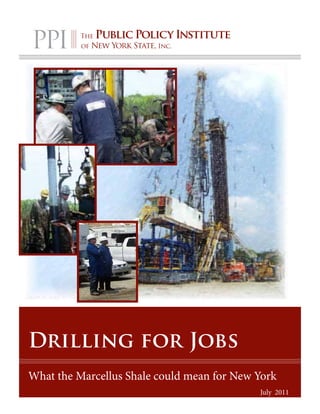
Drilling for Jobs - What the Marcellus Shale could mean for New York

  • 1. Drilling for Jobs What the Marcellus Shale could mean for New York July 2011
  • 2. Drilling for Jobs What the Marcellus Shale could mean for New York July - 2011 Table of Contents Section Title Page I. Executive Summary 3 II. Introduction 4 III. The Importance of Developing 5 Natural Gas Resources IV. The Marcellus and Other Shale Plays 7 V. Recent Activity in Pennsylvania and 9 New York VI. Economic Impact of the Marcellus 10 in Pennsylvania VII. Real Property Tax Benefits 12 VIII. Marcellus Shale Drilling: Effects on 13 the County Level IX. Economic Development with and 15 without a Moratorium X. Conclusion 17 XI. List of Charts 19 XII. Endnotes 20 XIII. Bibliography 21 This report is produced by The Public Policy Institute of New York State, Inc. Acting-President: Heather Briccetti, Esq. Principal Authors: Robert M. Lillpopp and Sonia A. Lindell Production Editor: Robert M. Lillpopp Contributing Editors: Michael Moran, Ken Pokalsky and Darren Suarez Copy Editor: Anna M. DeLisle July 2011 The Public Policy Institute of New York State, Inc. • 518/465-7511 • www.ppinys.org 2
  • 3. Drilling for Jobs What the Marcellus Shale could mean for New York July - 2011 Executive Summary T here are very few opportunities available to New York State with the same job- creating potential as exploring and developing the Marcellus Shale formation. The safe and sustainable Once Marcellus Shale development begins, the following economic achievements are projected: • In a five-county area outside of the New York development of the Marcellus can help to transform City watershed, with 500 wells drilled per year, the economy in New York’s Southern Tier. The Marcellus Shale development could result in a effects of the recent global recession are still total of more than 15,500 direct jobs and an resonating in much of the state, and it would be additional 47,120 jobs by applying the 3.04 unreasonable to disregard the substantial economic RIMS II multiplier, for a total of 62,620 jobs. benefits that would come with utilizing this valuable natural resource. We need only to look south into • Even with a moratorium in place, New York Pennsylvania, where 48,000 private sector jobs landowners are seeing income from leasing the in Marcellus Shale-related sectors were created in drilling rights to their land. Once development 2010, to see how development of this resource has begins, many will see royalties from producing positively affected their citizens and businesses. wells. In Pennsylvania some landowners have seen signing bonuses as high as $2,000 per If New York fails to allow the development of this acre and a royalty rate of 12.5 percent. resource, the state stands to lose over $11 billion in economic output and thousands of private sector • Local, state and federal tax revenues could jobs between 2011 and 2020.i By conservative increase by more than $214 million (in 2010 estimates the development of the Marcellus has dollars) in 2015.iii the potential to create 37,572 new jobs each year Anti-drilling apprehension has delayed shale in New York,ii jobs that may pay over $79,184 gas exploration in New York State, despite annually — over double the average private sector recent advances in wastewater technologyiv and wage upstate. support from diverse sources, including the U.S. The Public Policy Institute (PPI) report builds off Environmental Protection Agency.v Although the findings of earlier studies and examines the PPI’s report focuses solely on non-environmental economic impact and potential private sector job matters, it’s important to note that natural gas is creation that developing the Marcellus Shale would a clean burning fossil fuel which emits 60 percent have in New York State. It compares recent job less carbon than coal.vi Additionally, New York has growth in Pennsylvania to counties in New York some of the most strict environmental standards (outside of the New York City watershed) where in the nation — typically exceeding other states’ Marcellus Shale development is expected. and federal standards — and the implementation of a new regulatory regime governing high-volume This report compares how individual counties in hydraulic fracturing will continue this trend. both states have been affected by Marcellus Shale development. It examines employment statistics After analyzing the economic impact and in Tioga County, New York and Bradford County, private sector job creation associated with the Pennsylvania — which had the most wells drilled development of the Marcellus Shale, PPI concludes in 2010 and also the second lowest unemployment that New York must move swiftly to take advantage rate in Pennsylvania in March 2010. of the transformative opportunity that has been documented below the state line in Pennsylvania. The availability of abundant natural gas and electricity could spur new industrial development New York has a great opportunity to continue its and lead to gains in employment, economic output long history of exploration and development of and tax revenues. natural gas resources and pursue an extraordinary economic opportunity for upstate regions. The Public Policy Institute of New York State, Inc. • 518/465-7511 • www.ppinys.org 3
  • 4. Drilling for Jobs What the Marcellus Shale could mean for New York July - 2011 Introduction A nywhere from 168 trillion to 516 trillion cubic feet of natural gas existsvii in the Marcellus Shale, a 95,000 square mile black shale formation spanning from Ohio and West Virginia contains small amounts of chemical additives including friction reducers, bactericides and emulsion elements. New York, along with other into Pennsylvania and southern New York. While states, generally require the disclosure of exposed at the ground surface in certain regions, chemical additives to its environmental regulatory the Marcellus formation runs over 7,000 feet deep agencies, with public disclosure of non-trade secret in the Delaware River Valley along the Pennsylvania information. border. New York gained 42 jobs in Oil and Gas Extraction and Support Activities for Mining Pennsylvania gained 4,355 Oil and Gas Extraction and Support Activities for Mining jobs from 2009 - 2010 It’s also critical to note the importance of continual The Marcellus Shale spans the length of the drilling, since natural gas wells tend to have steep Southern Tier in New York State, from Chautauqua production decline curves (although they continue to Greene and Ulster Counties. For this report, PPI to produce for 30-50 years, some even longer). A assumes no drilling will occur in and around the certain number of wells must be drilled each year New York City watershed. in order to continue extracting a high volume of natural gas. The recent improvements in drilling technology have greatly increased the viability of exploring Now that the New York State Department of the Marcellus Shale; namely, the combination of Environmental Conservation (DEC) has updated horizontal drilling and hydraulic fracturing (the current drilling standards to avoid adverse latter involves pumping a mixture of water, sand environmental impacts of shale gas exploration, it and chemicals down the well under high pressure is important to examine the economic advantages to create fractures in the gas-bearing rock). The that natural gas drilling will have in terms of fractures are held open by the propping material, private sector job growth and increased tax and additional gas is then able to escape into revenue for New York. the well. Fracking fluid is 99 percent water and The Public Policy Institute of New York State, Inc. • 518/465-7511 • www.ppinys.org 4
  • 5. Drilling for Jobs What the Marcellus Shale could mean for New York July - 2011 The Importance of Developing Natural Gas Resources E stimates vary on the amount of recoverable gas in the Marcellus Shale — a 20 percent recovery rate would place it at 489 trillion cubic feet.viii Average natural gas consumption in New York State is 1.1 trillion cubic feet per year, according to the Department of Environmental Conservation. Given this figure, utilizing the natural gas resource right in our own backyard would be advantageous for residential, commercial, industrial and electrical needs. Residential consumption made up 36 percent of total natural gas consumption in New York State in 2009, followed by electric generation, which accounted for 31 percent of in-state consumption. Although New York accounted for 5 percent of total U.S. gas consumption in 2009, it produced only 0.2 percent of the nation’s total. Pennsylvania consumed 3.5 percent of natural gas in the U.S. and produced 1.3 percent of the nation’s total. New York natural gas delivered to consumers (in millions of cubic feet), 2005-2009 1,200,000 1,000,000 800,000 electric power industrial 600,000 commerical residential 400,000 200,000 0 05 06 07 08 09 20 20 20 20 20 Source: U.S. Energy Information Administration Between 2006 and 2010, U.S. shale gas production grew by an average of 48 percent per year, up from an average of 17 percent annual yearly growth rate from 2000 to 2006. Projections for natural gas production estimate that by the year 2035, the U.S. will be producing 23.4 trillion cubic feet of gas annually, far exceeding other Organization for Economic Cooperation and Development (OECD) countries. The Public Policy Institute of New York State, Inc. • 518/465-7511 • www.ppinys.org 5
  • 6. Drilling for Jobs What the Marcellus Shale could mean for New York July - 2011 U.S Gas Supply 2008 - 2035 14.00 12.00 trillions of cubic feet) 10.00 production (in 8.00 6.00 Tight Gas Shale Gas 4.00 Coalbed Methane 2.00 Other 0.00 08 11 14 17 20 20 20 23 20 26 20 29 20 32 20 35 20 20 20 20 Source: U.S. Energy Information Administration OECD natural gas production by country, 1990-2035 (trillion cubic feet) 50 40 30 United States Canada 20 Europe Australia/New Zealand Rest of OECD 10 Total 0 90 19 00 20 07 20 15 20 25 20 35 20 Source: EIA, International Energy Statistics database (as of November 2009), Projections: EIA, International Natural Gas Model (2010); and Annual Source: U.S. Energy Information Administration Energy Outlook 2010, DOE/EIA-0383(2010) (Washington, DC, April 2010), AEO2010 National Energy Modeling System, run AEO2010R.D111809A, web site www.eia.gov/oiaf/aeo. The Public Policy Institute of New York State, Inc. • 518/465-7511 • www.ppinys.org 6
  • 7. Drilling for Jobs What the Marcellus Shale could mean for New York July - 2011 The Marcellus and Other Shale Plays W hile the Marcellus is the largest shale formation in the United States at 95,000 square miles, other shale plays in the nation are generating sizable revenue, output and permanent jobs. Source: U.S. Energy Information Administration The Barnett Shale in Texas, which covers approximately 5,000 sq. miles, is responsible for $5.2 billion in annual output and approximately 55,385 permanent jobs.ix Projections made to the year 2015 estimate that the effects of the Barnett Shale would result in over 108,000 jobs and $10.4 billion in output per year.x The Marcellus is the largest known shale formation in the United States, at 95,000 square miles. The Public Policy Institute of New York State, Inc. • 518/465-7511 • www.ppinys.org 7
  • 8. Drilling for Jobs What the Marcellus Shale could mean for New York July - 2011 T he Utica Shale exists several thousand feet below the Marcellus, and lies beneath parts of Kentucky, Maryland, New York, Ohio, Pennsylvania, Tennessee, West Virginia and Virginia, as well as Lake Ontario, Lake Erie and a section of Ontario, Canada.xi At this time there is still limited information regarding the development of the Utica Shale, although some experts believe that the Utica Shale in Pennsylvania — with its extreme depths, and subsequent high temperatures — will most likely convert the natural gas to carbon dioxide, making production unlikely.xii In Ohio and New York, however, there may be greater development potential. As evidence of the potential of the Utica Shale, Range Resources has drilled horizontal wells in the Utica Shale and has stated that they plan to drill additional wells.xiii The Public Policy Institute of New York State, Inc. • 518/465-7511 • www.ppinys.org 8
  • 9. Drilling for Jobs What the Marcellus Shale could mean for New York July - 2011 Recent Activity in Pennsylvania and New York P ennsylvania has seen a surge in Marcellus Shale drilling in recent years. A total of 2,851 wells were drilled in Pennsylvania in 2010, approximately half of them in the Marcellus Shale. Counties with the most active Marcellus drilling last year were Bradford, Lycoming, Tioga and Washington. Over the past decade, a total of 31,914 natural gas wells were drilled in Pennsylvania. Pennsylvania, wells drilled from 2008 - 2010 Wells drilled in select PA counties, 2010 4000 3500 County Marcellus non-Marcellus 3000 Bradford 386 0 2500 McKean 15 199 2000 Marcellus Potter 33 19 1500 non-Marcellus Susquehanna 92 0 1000 500 Tioga 266 0 0 Washington 139 30 08 09 Lycoming 107 0 20 10 20 20 Source: PA Department of Environmental Source: PA Department of Environmental Protection Protection Gas wells drilled in select NY counties, 2006-2010 County 2006 2007 2008 2009 2010 TOTAL Allegany 0 0 2 0 0 2 Broome 0 1 2 0 0 3 Chautauqua 129 120 104 22 18 393 Chemung 6 8 10 1 5 30 Erie 44 64 69 61 42 280 Steuben 13 5 5 0 0 23 Tioga 0 8 1 0 1 10 Source: NYS DEC, downloadable well data Since the William Hart Natural Gas Well was dug in Fredonia, NY, in 1821,xiv New York has seen over 75,000 oil and gas wells drilled and, according to the DEC, approximately 14,000 of them are still active. New York has seen recent natural gas drilling activity, although at a much slower rate than Pennsylvania, and without any horizontal drilling in the Marcellus Shale formation. Between 2006 and 2010, the largest number of gas drilled wells drilled was in Chautauqua and Erie Counties. The Public Policy Institute of New York State, Inc. • 518/465-7511 • www.ppinys.org 9
  • 10. Drilling for Jobs What the Marcellus Shale could mean for New York July - 2011 Economic Impact of the Marcellus in Marcellus Shale-related industry, has a significant wage advantage. The average annual wage for Pennsylvania T Oil and Gas Extraction is $93,722, which is 139 here are six core Marcellus Shale North percent higher than the average private sector American Industry Classification System wage in upstate New York of $39,157. In Chemung (NAICS) industries that have been indentified County the average wage for this sector is by the Pennsylvania Department of Environmental $115,387, which is over three times the county’s Protection: Crude Petroleum & Natural Gas private sector wage of $37,648. Extraction; Natural Gas Liquid Extraction; Drilling Oil & Gas Wells; Support Activities for Oil & Gas Based on data from the 4th quarter of 2006 Operations; Oil & Gas Pipeline & Related Structures through the 4th quarter of 2010, select Shale Construction; and Pipeline Transportation of Natural industries in Pennsylvania enjoyed sizable Gas. There are also 21 Ancillary Shale industries. increases in average employment: During the lowest economic point of the recent • Oil and Gas Pipeline Construction employment recession, private sector employment in increased by 47.2 percent; Pennsylvania fell sharply between 2008 and 2009, • Sewage Treatment Facilities employment yet certain Marcellus Shale industries held steady, increased by 43.2 percent; with Oil and Gas Extraction actually gaining jobs • Support Activities for Mining, which during that time period. encompasses the core Shale industry Support Activities for Oil and Gas Operations, saw a 172.3 percent increase in employment, gaining 7,126 Annual average employment in Oil and Gas Extraction, jobs — In New York, this sector saw only 1.2 2006-2010 percent growth, or an increase of eight jobs; and 4,000 • Oil and Gas Extraction gained 2,055 jobs (98.2 3,500 percent growth); while in New York it grew by only 3,000 227 new jobs. 2,500 Pennsylvania 2,000 Other Shale sectors with employment gains in New York 1,500 Pennsylvania include: 1,000 • Pipeline Transportation of Natural Gas (6 500 percent); 0 • Water Supply and Irrigation Systems (10.7 06 percent); 07 08 09 20 20 10 20 20 20 • Other Specialized Trucking, Local (14.5 Source: Data from PA Department of Labor & percent); Industry and NYS Department of Labor • Heavy Machinery Rental and Leasing, which Marcellus Shale industries enjoy a significant encompasses the core Shale sector Construction, advantage over the average private sector weekly Mining & Forestry Machinery and Equipment Rental wage. In Pennsylvania, the average annual wage in and Leasing (19 percent); the six core Marcellus Shale industries was $73,159 • Engineering Services (5.1 percent); in 2010, $27,400 greater than the average wage for • Testing Laboratories (9.3 percent); and all industries statewide.xv The Standard Occupation • Environmental Consulting Services (9.7 Classification (SOC) salary ranges for jobs within percent). the core Shale industries indicate annual salaries ranging from $27,997 for Oil & Gas Roustabouts, to In addition, Pennsylvania has enjoyed substantial $95,659 for Petroleum Engineers. The salary range tax benefits from Marcellus Shale drilling. Data is even greater for ancillary Shale industries, from from the Pennsylvania Department of Revenue $38,938 for Heavy & Tractor Trailer Truck Drivers to indicates that the industry paid over $1.1 billion $108,014 for Engineering Managers.xvi in state taxes since 2006. In terms of Corporate Net Income Tax, figures for the first four months In New York State Oil and Gas Extraction, a of 2011 alone are over double what they were in 2010. The Public Policy Institute of New York State, Inc. • 518/465-7511 • www.ppinys.org 10
  • 11. Drilling for Jobs What the Marcellus Shale could mean for New York July - 2011 Another economic benefit from hydraulic fracturing is the revenue paid to landowners through leases and royalties. Signing bonuses of over Pennsylvania Corporate Net Income Tax (in millions) from oil and gas companies and their affiliates, 2006-2011* $250 $200 $150 $100 $50 $0 11 10 20 09 20 08 20 07 20 06 20 20 Source: PA Department of Revenue *Data from 2011 only from Jan. - April $2,000 per acre were not unusualxvii after new drilling technologies made shale gas extraction more financially viable. Also — after the drilling begins — property owners can receive royalties as a percentage of the natural gas yield. The typical royalty rate is 12.5 percent. If New York were to lift the moratorium on hydraulic fracturing in the Marcellus Shale, landowners in the Southern Tier could enjoy these royalties as a supplement to their regular income. A recent study indicates that the total economic impact, by value added, of Marcellus Shale-related industries in Pennsylvania was $3.87 billion in 2009 alone, and that Marcellus natural gas producers in Pennsylvania planned to spend over $8.7 billion in 2010.xviii This is exactly the type of investment and economic activity that upstate New York needs in order to recover from the economic recession. New York, Average weekly pay in Oil and Gas Extraction, 2006-2010 Pennsylvania, Average weekly pay in Oil and Gas Extraction, 2006-2010 $2,000 $1,800 $1,600 $1,400 $1,500 $1,200 Oil and Gas Extraction Oil and Gas $1,000 $1,000 $800 Extraction $600 Statewide average Statewide average $500 $400 weekly wage weekly wage $200 $0 $0 06 06 07 08 07 20 09 20 20 20 10 08 20 20 20 09 20 10 20 20 Source: PA Department of Labor & Industry Source: NYS Department of Labor The Public Policy Institute of New York State, Inc. • 518/465-7511 • www.ppinys.org 11
  • 12. Drilling for Jobs What the Marcellus Shale could mean for New York July - 2011 Real Property Tax Benefits M Estimated Real Property Tax Payments Estimated Annual Production (AP) 500 mmcf any gas-producing states levy a severance Estimated Unit Production Value (UPV) $9.80 per mcf tax on gas production. New York does not Estimated Market Value of Well $ 4,900,000 have a specific gas severance tax, but Town of Owego Equalization Rate 81 instead has a significant property tax based upon the value of gas production. Gas severance taxes Est. Assessed Value 2011 Tax rate per Est. AV of Well Est. Property Tax are generally based on either the volume or value Of Marcellus Well 1,000 of AV (in 1,000's of $'s) dollars of the gas production. To understand why New $3,920,000 York does not have a traditional severance tax it is County Taxes $10.85 $3,920.00 $42,516.32 important to understand the history of New York’s Town of Owego $2.95 $3,920.00 $11,564.82 real property tax assessment. Solid Waste $0.45 $3,920.00 $1,775.76 Fire District $2.02 $3,920.00 $7,923.64 School $71.75 $3,920.00 $281,244.38 As a result of increased oil and gas prices, Total $345,024.92 exploration and production activity intensified in the mid 1970s and early 80s. Initially, this phenomenon was due to increased prices paid for domestic oil and gas as a result of higher demand, deregulation Medina Region 3 - $11.32 and rising foreign price levels. As a result of the Medina Region 4 - $11.32 increased production, laws were enacted in the Onondaga Reef and Oriskany Sandstone Formation 1980’s to regulate the activities of the industry and - $9.80 govern the assessment of oil and gas producing Trenton Black River - $12.12 properties. At the time it was understood that Formations other than Medina, Onondaga & additional tax revenue derived from oil and gas Oriskany - $9.80 production should stay with the locality. To understand the cost of the delayed production Prior to the reforms, assessments of oil and gas on real property tax collection it is important to producing properties were not uniform throughout estimate the real property tax benefits associated the state. Specifically, the legislation required the with a Marcellus well. In the interest of illuminating separate assessment of oil and gas economic units the effects one Marcellus well has upon a specific for producing wells. locality, the following estimates are based upon the best available information. The estimated value of all oil and gas wells in New York State is based upon the annual production It is estimated that one Marcellus well in the multiplied by the Unit of Production Value (UPV). town of Owego, in the County of Tioga, would The UPV is the value of each MCF (one thousand generate $345,025 in combined real property tax cubic feet of gas) produced in the production year. revenue for the county, town and school districts. In determining unit of production values, the New It was estimated that during the first year of full York State Office of Real Property Tax Services uses production an average Marcellus well will produce a discounted net cash flow approach to reflect the 500 million cubic feet (mmcf) of natural gas. following: depreciation; depletion; income and other taxes; capital investments; royalty interests not Currently there is no established unit production retained by producer; operating and maintenance value for a Marcellus well. It is highly likely that the expenses; other pertinent costs; and a rate of UPV will be greater for a Marcellus well than the capitalization that shall not be less than 17.5 currently published UPV for formations other than percent. Medina, Onondaga and Oriskany. On April 1, 2011, the state board of Real Property If the UPV for Marcellus was closer to Trenton Tax Services established the final 2011 oil and gas Black River the well would generate $432,038 in UPV’s. The values are as follows: combined real property tax revenue for the county, town and school districts. Medina Region 1 - $11.32 Medina Region 2 - $11.32 The Public Policy Institute of New York State, Inc. • 518/465-7511 • www.ppinys.org 12
  • 13. Drilling for Jobs What the Marcellus Shale could mean for New York July - 2011 Marcellus Shale Drilling: Effects on the County Level B radford County sits among the Endless Mountain Range in northeastern Pennsylvania. It has 61,276 residents, ranking it 41st in the state in terms of population. The county recently enjoyed the lowest unemployment rate and the highest private sector job growth in the state. This moderately-sized rural area, however, has not always enjoyed such an economic edge. In 2001, Bradford ranked 26th in terms of unemployment rate, with an average slightly below that of Pennsylvania as a whole. Five years later, in 2006, Bradford ranked 27th. This changed as hydraulic fracturing became more and more prevalent in the county. Bradford had the most Marcellus Shale wells drilled in 2010 (386), and the second lowest unemployment rate in the state in March 2011 (5.9 percent). Bradford County gained 1,632 private sector jobs between Sept. 2009 and Sept. 2010, representing 8.9 percent growth, while Tioga County (PA),which had the second most wells drilled in 2010, saw a 3.4 percent increase in private sector growth. Unemployment rate, Bradford County vs. Pennsylvania, 2001-2010 9.0 8.0 7.0 6.0 5.0 4.0 3.0 Bradford County 2.0 Statewide 1.0 0.0 01 02 03 20 20 04 20 05 20 06 20 07 20 08 20 09 20 10 20 20 Source: Bureau of Labor Statistics Comparing Bradford County to one of its neighbors across the state line, Tioga County (NY), we find that year-to-year private sector employment growth has steadily increased from Sept. 2006 in Bradford, while the private sector growth rate has steadily declined in Tioga. Tioga (NY) has a population of 49,610, according to recent census estimates, and in March 2011, had an unemployment rate of 8.1 percent. Between Sept. 2009 and Sept. 2010, private sector employment declined by 4.6 percent. According to NYS DEC data, Tioga (NY) only had one gas well drilled in 2010. The Public Policy Institute of New York State, Inc. • 518/465-7511 • www.ppinys.org 13
  • 14. Drilling for Jobs What the Marcellus Shale could mean for New York July - 2011 Private sector employment growth, Bradford (PA) and Tioga (NY) Sept. '06 - Sept. '10 10.0% 8.0% 6.0% 4.0% 2.0% Bradford 0.0% Tioga -2.0% -4.0% -6.0% -8.0% 10 09 20 08 20 07 20 06 20 20 Source: Bureau of Labor Statistics In comparing McKean, Potter, Susquehanna, Bradford and Tioga counties in Pennsylvania to Allegany, Steuben, Chemung, Tioga and Broome counties in New York, we find that between 2009 and 2010, private sector employment grew in the five-county Pennsylvania region by 4.7 percent, or 2,425 jobs, while average private sector employment in the New York region fell by -0.3 percent, a loss of 389 jobs. The counties in Pennsylvania also saw a drop in the unemployment rate from 9.2 percent to 8.4 percent during that same time period, while the New York State region experienced, as an aggregate, a 0.2 percent rise in unemployment. New York private sector employment growth, select counties, Sept. '09 - Sept. '10 Pennsylvania private sector employment growth, select counties, Sept. '09 - Sept. '10 3% 9% 2% 8% 7% 1% Broome 6% 0% Allegany McKean 5% Steuben Potter -1% 4% Chemung Tioga -2% Tioga 3% Bradford 2% -3% Susquehanna 1% -4% 0% -5% -1% Source: Bureau of Labor Statistics Source: Bureau of Labor Statistics The Public Policy Institute of New York State, Inc. • 518/465-7511 • www.ppinys.org 14
  • 15. Drilling for Jobs What the Marcellus Shale could mean for New York July - 2011 Economic Development with and without a Moratorium L imited gas-related job growth would be excepted in New York State over the next decade had a moratorium on shale gas development remain in place. For example, under current conditions, data for the crude petroleum and natural gas extraction sector in New York State points to an increase of only 180 jobs between 2008 and 2018. While in Pennsylvania, this industry is expected to grow by 22.5 percent, for an increase of 600 jobs during this time period. Long-Term Industry Projections in select Marcellus Shale-related industries, NY and PA, 2008-2018 60% 50% 40% 30% New York 20% Pennsylvania 10% 0% -10% -20% g on n n on ce s rs in ce tio tio cto an cti cti in vi ta ta ten tr a M u er ra or or str gS nt Ex or ain sp sp on Co in f an an s M es gC Ga as Tr Tr de iti d Le in an nd a tiv ck ne Tr er d il a Ac u ir an eli ne Tr ty pa p O rt l al gi cia Pi Re po nt En e Re p Sp vil Su Ci nda vy ea H Source: NYS Department of Labor, PA Dept. of Labor & Industry The natural gas-related industry experiencing the second greatest expected job growth in New York is Support Activities for Mining at 410 new jobs. Projected growth for these industries is almost exclusively in the Southern Tier and Western New York. (It’s important to note that the NYS DOL takes into account national trends and historical data to determine the expected growth rates, and in the case of Marcellus Shale-related industries, the moratorium on hydraulic fracturing was considered when calculating employment projections). Employment declines, however, are expected in other sectors that encompass Marcellus industries. Heavy and Civil Engineering Construction loses 1,710 jobs; Specialty Trade Contracting sees 10,660 jobs lost from 2008 to 2018. Truck Transportation and Rental and Leasing Services lose 5,000 jobs and 4,130 jobs, respectively. The Public Policy Institute of New York State, Inc. • 518/465-7511 • www.ppinys.org 15
  • 16. Drilling for Jobs What the Marcellus Shale could mean for New York July - 2011 Despite the NYS DOL’s predictions for growth in Oil and Gas Extraction and Support Activities for Mining, if the moratorium on hydraulic fracturing continues, New York will lose out on an estimated 31 (direct) jobs, $2,267,929 in employee wages, $5.46 million in value added and $2 million in federal, state and local taxes per well.xix In contrast, using this same data, we can predict the economic impact of hydraulic fracturing in New York State if the moratorium were lifted and Marcellus Shale development was permitted. Based on a projection of 500 wells, the Empire State could gain 62,620 jobs, $2.7 billion in value added and $1 billion in local, state and federal taxes. PPI arrives at the number for jobs by using the 31 direct jobs-per-well estimate and applying the 3.04 multiplier for this sector of the economy. Employment multipliers vary greatly by sector: the Milken Institute, using the BEA’s models, has assumed a 9.20 multiplier for cutting-edge biotechnology and nanotechnology firmsxx, while the construction sector has a multiplier of 1.89.xxi Not only will developing the Marcellus Shale result in increased revenue and private sector job growth, it will remove some individuals from unemployment rolls and expand the tax base, helping to ease the burden on state government and taxpayers. Hydraulic fracturing scenario for New York State Jobs created Jobs created through Wells drilled/year directly multiplier effect Total jobs created Value added Tax revenue 100 3,100 9,424 12,524 $546 million $200 million 200 6,200 18,848 25,048 $1.1 billion $400 million 300 9,300 28,272 37,572 $1.6 billion $600 million 400 12,400 37,696 50,096 $2.2 billion $800 million 500 15,500 47,120 62,620 $2.7 billion $1 billion Source: Projections based on data from The Economic Opportunities of Shale Energy Development (2011) *RIMS II multiplier If 500 wells were drilled each year, the Empire State could gain 62,620 jobs, $2.7 billion in value added and $1 billion in local, state and federal taxes. The Public Policy Institute of New York State, Inc. • 518/465-7511 • www.ppinys.org 16
  • 17. Drilling for Jobs What the Marcellus Shale could mean for New York July - 2011 Conclusion The Public Policy Institute concludes that, in evaluating the potential development of Marcellus Shale gas, it is crucial for New York State to consider the signficant economic potential of this natural resource, in addition to the environmental and public health aspects. Significant economic benefits achieved in Pennsylvania provide clear evidence of the investment and job growth related to shale development. It would be unreasonable for New York state government to disregard the economic benefits that are being achieved below the state line in Pennsylvania. We recognize that protection of public health and environmental resources – especially public water supplies – will be a crucial element of the state’s regulatory program for shale gas exploration. However, given New York’s history of adopting some of the most strict environmental standards in the nation, we expect the state’s regulation to assure the safe development of hydraulic fracturing in New York’s Southern Tier. New York has a great opportunity to expand its historic exploration and development of natural gas resources, capture an extraordinary economic opportunity for depressed regions of upstate New York and help fuel the future of New York and the nation. Natural gas is a clean-burning energy source and drilling in shale plays throughout the U.S. has become more economically viable with well-drilling technology. Exploring this technology will help reduce our dependence on foreign energy resources, create a more robust business climate and increase individual wealth, tax revenues and create jobs. This report has examined the impressive private sector job growth in Pennsylvania, a state which is at the forefront of Marcellus Shale development, and found that counties which utilize the natural gas resource have benefited economically. Bradford County had the highest number of Marcellus wells drilled in 2010, along with significant job growth (8.9 percent between Sept. 2009 and Sept. 2010) and one of the lowest unemployment rates in the state. After examining five counties in the Southern Tier (Allegany, Broome, Chemung, Steuben and Tioga) and five counties just south of the New York State border (Bradford, McKean, Potter, Steuben and Tioga), we found that the region in Pennsylvania experienced a 4.7 percent increase in private sector employment during 2006-2010, or 2,425 jobs, while the private sector job growth in the New York region was -0.3 percent, representing a loss of 389 jobs. In addition, Marcellus Shale industries enjoy a significant wage advantage. In New York, the aggregate average annual wage for Oil and Gas Extraction and Support Activities for Mining is $79,184, which is over double the average private sector wage in upstate New York of $39,157. In Pennsylvania, the average annual wage in the six core Marcellus Shale industries was $73,159 in 2010 — $27,400 greater than the average wage for all industries statewide — according to the Pennsylvania Department of Labor & Industry. Pennsylvania has already experienced over $1 billion in tax revenue from oil and gas companies and their affiliates since 2006. The Public Policy Institute of New York State, Inc. • 518/465-7511 • www.ppinys.org 17
  • 18. Drilling for Jobs What the Marcellus Shale could mean for New York July - 2011 In a time when New York’s economy is slowly returning to fiscal stability after the devastating global recession, such tax benefits would be invaluable to the Empire State. Data from the NYSDOL indicates that Shale-related industries will enjoy significant growth through 2018, taking into account the possibility of a continued moratorium. However, using data from the Manhattan Institute study we find that by banning exploration of this valuable resource, we lose out on an average of 31 (direct) jobs and $5.46 million in value added per well. Restricting the development of natural gas in the Southern Tier would be detrimental to reviving our state’s economy and a disservice to New Yorkers who want to see good-paying jobs and investment in the Empire State. Based on the private sector job growth potential and tax revenues, PPI fully supports lifting the current restriction on hydraulic fracturing in the Marcellus Shale and moving forward with a balanced regulatory program allowing exploration and production in the Marcellus Shale formation. The Public Policy Institute of New York State, Inc. • 518/465-7511 • www.ppinys.org 18
  • 19. Drilling for Jobs What the Marcellus Shale could mean for New York July - 2011 List of Charts 1. New York natural gas delivered to consumers (in millions of cubic feet), 2005 - 2009 2. U.S. gas supply, 2008 - 2035 3. OECD natural gas production, by country, 1990 - 2035 4. Wells drilled in select PA counties, 2010 5. Pennsylvania, wells drilled from 2008 - 2010 6. Gas wells drilled in select NY counties, 2006 - 2010 7. Annual average employment in Oil and Gas Extraction, 2006 - 2010 8. Pennsylvania Corporate New Income Tax (in millions) from oil and gas companies and their affiliates, 2006-2011 9. Pennsylvania, average weekly pay in Oil and Gas Extraction, 2006 - 2010 10. New York, average weekly pay in Oil and Gas Extraction, 2006 - 2010 11. Town of Owego estimated real property tax payments, 2011 12. Unemployment rate, Bradford County vs. Pennsylvania, 2001 - 2010 13. Private sector employment growth, Bradford (PA) and Tioga (NY), Sept. ‘06 - Sept. ‘10 14. Pennsylvania private sector employment growth, select counties, Sept. ‘09 - Sept. ‘10 15. New York private sector employment growth, select counties, Sept. ‘09 - Sept. ‘10 16. Long-term industry projections in select Marcellus Shale-related industries, NY and PA, 2008 - 2018 17. Hydraulic fracturing scenario for New York State The Public Policy Institute of New York State, Inc. • 518/465-7511 • www.ppinys.org 19
  • 20. Drilling for Jobs What the Marcellus Shale could mean for New York July - 2011 Endnotes i. pg. 37 of The Economic Impacts of the Marcellus Shale ii. Data based on 31 direct jobs-per-well estimate used in The Economic Opportunities of Shale Energy Development plus 3.04 multiplier iii. pg. 28 of The Economic Impacts of the Marcellus Shale iv. According to the Department of Energy’s National Energy Technology Laboratory, a new water cleaning technology currently being tested has been found to remove over 99 percent of oil and grease, over 90 percent of dissolved BTEX (benzene, toluene, ethylbenzene and xylenes) and significant amounts of production chemicals v. Lisa Jackson touted natural gas as a cleaner alternative to other fossil fuels in her testimony to the House Oversight and Government Reform Committee vi. The Economic Impacts of the Marcellus Shale (2010), Intro vii. NYS DEC viii. The Economic Impacts of the Marcellus Shale, intro ix. Bounty from Below, pg. 7 x. Bounty from Below, pg. 8 xi. www.geology.com/articles/utica-shale/ xii. www.citizensvoice.com/news/expert-finding-natural-gas-in-utica-shale-is-unlikely-more-overcooked-than-marcellus- 1.1143799#axzz1PJj6fJK5 xiii. The Economic Impacts of the Marcellus Shale, pg. 27 xiv. www.nyserda.org/programs/Environment/EMEP/conference_2009/presentations/Martin_Dahl.pdf xv. Marcellus Shale Fast Fasts, pg. 2 xvi. Marcellus Shale Fast Facts, pg. 9 xvii. Pennsylvania’s Buried Treasure xviii.The Economic Impacts of the Pennsylvania Marcellus Shale Natural Gas Play: An Update , pg. 10-11 xix. The Economic Opportunities of Shale Energy Development, pg. 6 xx. Let’s Make It Here: Keys to a Manufacturing Resurgence in New York, pg. 8 xxi. RIMS II multiplier, www.maine.gov/labor/cwri/publications/pdf/GreenEconomyReport.pdf The Public Policy Institute of New York State, Inc. • 518/465-7511 • www.ppinys.org 20
  • 21. Drilling for Jobs What the Marcellus Shale could mean for New York July - 2011 Bibliography The Manhattan Institute, The Economic Opportunities of Shale Energy Development, May 2011 The Public Policy Institute, Let’s Make it Here: Keys to a Manufacturing Resurgence in New York, May 2011 Timothy Considine, Robert Watson and Seth Blumsack, The Economic Impacts of the Pennsylvania Marcellus Shale Natural Gas Play: An Update, May, 2010 Considine, Timothy, The Economic Impacts of the Marcellus Shale: Implications for New York, Pennsylvania, and West Virginia, July 2010 Bounty from Below: The Impact of Developing Natural Gas Resources Associated with the Barnett Shale on Business Activity in Forth Worth and the Surrounding 14-County Area, The Perryman Group, May 2007 Walker, Deborah and Sonora, Robert. The Economic Impact of the Natural Gas Industry in La Plata County, 2003 - 2004, November 2005 National Energy Technology Laboratory (Department of Energy), Breakthrough Water Cleaning Technology Could Lessen Environmental Impacts from Shale Production: DOE-funded Laboratory Testing Leads to Multiple Field Demonstrations, April 28, 2011 www.geology.com, Utica Shale - The Natural Gas Giant Below the Marcellus? Skrapits, Elizabeth, Expert: Finding natural gas in Utica Shale is unlikely; more ‘overcooked’ than Marcellus, May 9, 2011 Pennsylvania Department of Labor & Industry, Marcellus Shale Fast Facts, June 2011 Edition Environmental Protection Agency, Administrator Lisa P. Jackson Testimony before the U.S. House Oversight and Government Reform Committee New York State Department of Environmental Conservation New York State Department of Labor Pennsylvania Department of Labor & Industry, Center for Workforce Information and Analysis Pennsylvania Department of Environmental Protection Bureau of Economic Analysis The Public Policy Institute of New York State, Inc. • 518/465-7511 • www.ppinys.org 21
  • 22. Drilling for Jobs What the Marcellus Shale could mean for New York July - 2011 U.S. Energy Information Administration (EIA) Annual Energy Outlook 2011, U.S. EIA Utica Shale – The Natural Gas Giant Below the Marcellus? Stacked plays in the Appalachian Basin produce multiple natural gas play zones, www.geology.com Grant, Stephen, Pennsylvania’s Buried Treasure, Spring 2010 (http://pabook.libraries.psu.edu/palitmap/ Marcellus.html) Maine Department of Labor, Maine’s Green Economy: An Overview of Renewable Energy and Energy Efficiency Sectors, February 2010 Martin, John, Marcellus Shale Natural Gas: The Resource, New York State Energy Resarch and Development Authority, October 15, 2009 Maine Department of Labor, Maine’s Green Economy: An Overview of Renewable Energy and Energy Efficiency Sectors, February 2010 The Public Policy Institute of New York State, Inc. • 518/465-7511 • www.ppinys.org 22
  • 23. Drilling for Jobs What the Marcellus Shale could mean for New York July - 2011 Page left blank The Public Policy Institute of New York State, Inc. • 518/465-7511 • www.ppinys.org 23
  • 24. The Public Policy Institute is the research and educational arm of The Business Council of New York State, Inc. The organization’s purpose is to formulate and promote public policies that will restore New York’s economic competitiveness. PPI accomplishes this mission by conducting timely, in-depth research addressing key state policy issues. The Institute is a non-partisan, tax-exempt, 501 (c) (3) organization. It depends on the support of corporations, foundations and the public. It does not accept any government funding. For more information about PPI visit our website at www.ppinys.org. Graphic design by Robert M. Lillpopp - Photographs by Sonia A. Lindell Drilling for Jobs What the Marcellus Shale could mean for New York