1. Expl.: BSC Case Study Pader-Optic Group
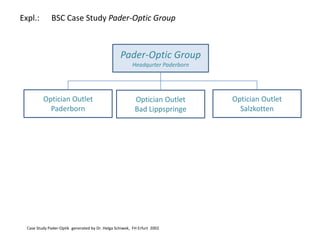
Pader-Optic Group
Headqurter Paderborn
Optician Outlet Optician Outlet Optician Outlet
Paderborn Bad Lippspringe Salzkotten
Case Study Pader-Optik generated by Dr. Helga Schiwek, FH Erfurt 2002
2. Generation of Key Performer Indicators KPI Plan and Actual Case Study Pader-Optik
Optician Outlet Paderborn
Pader-Optik Headquarter
3. quarter 2002 2. quarter 2002 1. quarter 2002 4. quarter 2001
Metrics Direction Dimension plan actual Deviation plan actual Deviation plan actual Deviation plan actual Deviation
Financial
1 Return on Investment Max! % 9,00 10,00 11,11 9,00 9,00 0,00 8,50 8,00 -5,88 8,00 6,00 -25,00
2 Market share Max! % 8,00 6,66 -16,75 8,00 7,00 -12,50 6,00 7,00 16,67 5,00 4,50 -10,00
3 Turnover growth Max! % 6,00 7,00 16,67 6,00 5,00 -16,67 5,00 5,50 10,00 4,00 3,00 -25,00
Customer Satisfaction
4 Customer satisfaction Max! points 6,00 7,07 17,83 6,00 5,80 -3,33 5,00 5,50 10,00 5,00 5,00 0,00
5 Customer loyalty Max! % 60,00 65,00 8,33 60,00 60,00 0,00 60,00 53,00 -11,67 60,00 50,00 -16,67
6 Aquisition new Custumer Max! customer/quar. 550,00 650,00 18,18 500,00 530,00 6,00 500,00 500,00 0,00 500,00 450,00 -10,00
Internal processes
7 order lead time Min! days/order 3,00 4,00 -33,33 3,50 4,50 -28,57 3,50 5,00 -42,86 4,00 6,00 -50,00
8 capacity load Max! % 80,00 77,00 -3,75 80,00 60,00 -25,00 80,00 67,00 -16,25 80,00 65,00 -18,75
9 Number of complains Min! pcs./quar. 12,00 16,00 -33,33 12,00 11,00 8,33 12,00 14,00 -16,67 15,00 12,00 20,00
Personnel /Growth
10 Employee satisfaction Max! points 8,00 9,00 12,50 8,00 8,00 0,00 8,00 6,00 -25,00 8,00 7,00 -12,50
11 Absenteeism Min! days/quar. 21,00 18,00 14,29 21,00 20,00 4,76 21,00 22,00 -4,76 21,00 25,00 -19,05
12 Improvement proposals Max! pcs./quar. 8,00 8,00 0,00 8,00 12,00 50,00 8,00 5,00 -37,50 8,00 2,00 -75,00
Plan and Actual are generated by the responsible departments e.g. Sales,
Marketing, Accounting and Logistics coordinated by Controlling on a
quarterly basis