
Recommended
Recommended
More Related Content
What's hot
What's hot (20)
Similar to PostgreSQL High_Performance_Cheatsheet
Similar to PostgreSQL High_Performance_Cheatsheet (20)
Recently uploaded
Recently uploaded (20)
PostgreSQL High_Performance_Cheatsheet
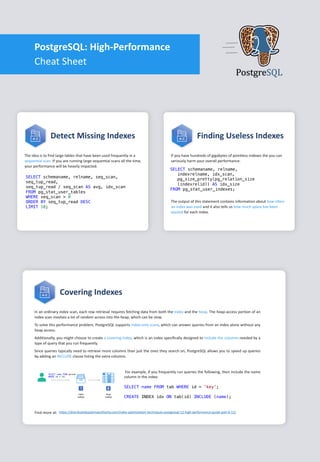
- 1. The idea is to find large tables that have been used frequently in a sequential scan. If you are running large sequential scans all the time, your performance will be heavily impacted. Detect Missing Indexes SELECT schemaname, relname, seq_scan, seq_tup_read, seq_tup_read / seq_scan AS avg, idx_scan FROM pg_stat_user_tables WHERE seq_scan > 0 ORDER BY seq_tup_read DESC LIMIT 10; If you have hundreds of gigabytes of pointless indexes the you can seriously harm your overall performance. Finding Useless Indexes SELECT schemaname, relname, indexrelname, idx_scan, pg_size_pretty(pg_relation_size (indexrelid)) AS idx_size FROM pg_stat_user_indexes; The output of this statement contains information about how often an index was used and it also tells us how much space has been wasted for each index. Covering Indexes In an ordinary index scan, each row retrieval requires fetching data from both the index and the heap. The heap-access portion of an index scan involves a lot of random access into the heap, which can be slow. To solve this performance problem, PostgreSQL supports index-only scans, which can answer queries from an index alone without any heap access. Additionally, you might choose to create a covering index, which is an index specifically designed to include the columns needed by a type of query that you run frequently. Since queries typically need to retrieve more columns than just the ones they search on, PostgreSQL allows you to speed up queries by adding an INCLUDE clause listing the extra columns. For example, if you frequently run queries the following, then include the name column in the index: SELECT name FROM tab WHERE id = 'key’; CREATE INDEX idx ON tab(id) INCLUDE (name); PostgreSQL: High-Performance Cheat Sheet PostgreSQL https://distributedsystemsauthority.com/index-optimization-techniques-postgresql-12-high-performance-guide-part-6-12/Find more at:
- 2. It is by far the easiest way to track down performance problems. It helps us figure out which types of queries are slow and how often these queries are called. Top 10 Time-consuming Queries SELECT round((100 * total_time / sum(total_time) OVER ())::numeric, 2) percent, round(total_time::numeric, 2) AS total, calls, round(mean_time::numeric, 2) AS mean, substring(query, 1, 40) FROM pg_stat_statements ORDER BY total_time DESC LIMIT 10; This extension is not installed by default. It needs to be installed in each database . Here's how you can install it: 1. In postgresql.conf file, you should search for shared_preload_libraries and if necessary uncomment it. Then add “pg_stat_statements” as value 2. Restart the database server 3. Run “CREATE EXTENSION pg_stat_statements;” for the database of interest When you have a feeling that a query is not performing well, EXPLAIN will help you to reveal the real performance problem. The purpose of EXPLAIN is to see what the planner has come up with to run the query efficiently. EXPLAIN command EXPLAIN SELECT * FROM t_test LIMIT 10; Limit (cost=0.00..3.39 rows=10 width=233) -> Seq Scan on post (cost=0.00..1562.12 rows=23042 width=233) estimated total cost estimated start-up cost until first row is returned estimated number of rows output by this plan node estimated average width of rows output by this plan node (in bytes) You should read the from the plan inner part to outer part, or bottom to top. PostgreSQ
- 3. EXPLAIN ANALYZE SELECT * FROM post LIMIT 50; Limit (cost=0.00..3.39 rows=50 width=422) (actual time=0.000..0.044 rows=50 loops=1) -> Seq Scan on post (cost=0.00..15629.12 rows=999 width=422) (actual time=0.227..0.227 rows=999 loops=1) “actual time” values are in milliseconds of real time, whereas the cost estimates are expressed in arbitrary units; so they are unlikely to match up. Estimated cost are needed to compare different ways to execute a query. EXPLAIN ANALYZE command With ANALYZE option, EXPLAIN actually executes the query, and then displays the true row counts and true runtime accumulated within each plan node, along with the same estimates that a plain EXPLAIN shows. ? Use index Use bitmap scan 0.2 0.8 0.5 Cost Estimates PostgreSQL https://distributedsystemsauthority.com/spotting-query-problems-postgresql-12-high-performance-guide-part-8-12/Find more at:
- 4. VACUUM Any time you UPDATE or DELETE, you will leave a dead row behind (and potentially a dead index entry) that needs to be cleaned up later by some form of vacuum. When tables grow very large because of excessive dead tuples then performance will tend to decrease. Therefore the VACUUM process should never be avoided. The VACUUM simply recovers space and makes it available for reuse. Please note that space is not returned to the operating system (in most cases); it is only available for reuse within the same table. SELECT schemaname, relname, n_live_tup, n_dead_tup FROM pg_stat_user_tables; Maintain Performance VACUUM configs If the VACUUM is taking too much time or resources, it means that we must do it more frequently, so that each operation has less to clean. AUTOVACUUM takes care of cleanup works in the background. It wakes as specified in postgresql.conf # time betweenautovacuum runs autovacuum_naptime = 1 # fraction of table size before vacuum autovacuum_vacuum_scale_factor = 0.2 # min number of row updates before vacuum autovacuum_vacuum_threshold = 50 # limit the duration of a transaction # which prevents free space reclaim old_snapshot_threshold = 1min VACUUM ANALYZE VACUUM ANALYZE. In adiition to vacuum, ANALYZE collects statistics on the contents of the tables and stores the results in pg_statistic. Subsequently, the query planner uses these statistics to help determine the most efficient execution plans for queries. https://distributedsystemsauthority.com/configuring-vacuum-for-performance-postgresql-12-high- performance-guide-part-4-12/ Find more at:
- 5. CLOG buffer Shared buffers WAL buffer Other buffers Shared Memory work_mem maintenance_work_mem Buffer per backend PostgreSQL Memory System work_mem Specifies the amount of memory that will be used by the internal operations such as ORDER BY, DISTINCT, JOIN, and hash tables before writing to the temporary files on disk. When configuring this value, we must take into account that several sessions be executing these operations at the same time, and each session can execute several sort operations concurrently. Therefore, the total memory used could be many times the value of work_mem. maintenance_work_mem Specifies the maximum amount of memory that maintenance operations will use, such as VACUUM, CREATE INDEX, and ALTER TABLE ADD FOREIGN KEY. Since only one of these operations can be executed at the same time by a session, and an installation usually does not have many of them running simultaneously, it can be larger than the work_mem. Larger configurations can improve performance for VACUUM and database restores. OS cache When there are thousands of users trying to read or write data to many different tables, reading from the files will result in a poor, non-scalable system. The reads and writes will result in searching for many files, opening these files, looking for specific data records, locking, editing, and unlocking. To make this a lot more scalable and faster, the concept of shared buffers is introduced. PostgreSQL default allocation for the shared_buffers is extremely low, and we need to increase it to allow proper shared memory size for the database. A reasonable initial value for shared_buffers is 25% of your system's memory. However, if you want to do better than allocating a percentage to the shared_buffers relative to the OS cache, you need to analyze the buffers cache content to see if a bigger amount would benefit your use cases. shared_buffers PostgreSQL Configuration parameters https://distributedsystemsauthority.com/optimizing-postgresql-shared-buffers/(opens in a new tab)Find more at:
- 6. Checkpoint Process max_wal_size When a user makes changes to the data, it first goes through the buffer. Now that buffer is dirty. The fact that a user has committed a change does not mean that the modification has been written to the data file. The checkpointer process is responsible to write the change to the data file. There is a trade-off between performance (infrequent checkpoints) and time needed for recovery (frequent checkpoints) There are multiple parameters to control how often the checkpoints are done but the main one is based on size: max_wal_size. This sets the maximum size the WAL is allowed to grow between the control points. Check Course on Udemy PostgreSQL High-Performance Course