1. Future perspectives
Introduction
Acute myeloid leukemia (AML) is an aggressive cancer with a survival rate < 30%. Despite
increased understanding of the pathogenesis, the therapeutic landscape of AML has
remained unchanged for decades, indicating the urgency for novel therapeutic targets.
Aims:
1. Elucidate the role of KAT2A in normal haematopoiesis, and the extent to which
KAT2A loss promotes cell fate transitions key to defining therapeutic utility.
2. Investigate whether KAT2A loss increases heterogeneity of cell fate between
sister cells.
Investigating the role of KAT2A in cell fate
transitions in human haematopoiesis.
A single-cell investigation into the impact of transcriptional heterogeneity on cell fate.
Leia Judge1,2, Cristina Pina1
1Department of Haematology, University of Cambridge, UK; 2University College Dublin, Ireland
Results
Conclusions
From stem cell to colony
Single CD34+
HSC/MPP + SCF, TPO, EPO,
G-CSF, IL-3 & Flt3L
8-10d
Antibody stain + flow
cytometry
Wells containing 2 cells
after 24hr selected for
daughter cell assays.
Contents distributed
between 6 new wells to
divide daughter cells.
Myeloidmarkers
Erythroid markers
Assessment of
proliferation and
colony composition.
Many thanks to all in the Pina lab, particularly Dr. Cristina Pina, to the
Department of Haematology at Cambridge University and to the Amgen
Foundation for the financial support provided throughout the Amgen
Scholars Programme.
Non-targeting shRNA (control) KAT2Ash
Days
20.3%
Days
7.2%
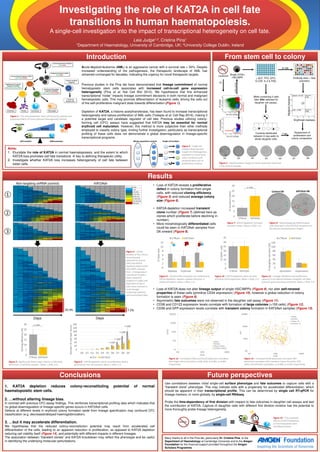
• Loss of KAT2A reveals a proliferative
defect in colony formation from single-
cells, with reduced cloning efficiency
(Figure 5) and reduced average colony
size (Figure 6).
• KAT2A depletion increased transient
clone number (Figure 7) (defined here as
clones which proliferate before declining in
number).
• More morphologically differentiated cells
could be seen in KAT2Ash samples from
D6 onward (Figure 8).
Figure 5– Significantly fewer large colonies (>100 cells)
were seen in KAT2Ash samples. Mean ± SEM, n=3.
Figure 7– KAT2A depletion increases
transient clones. Mean ± SEM, n=3.
Figure 6 – KAT2A depletion elicits a proliferative defect,
particularly from D6 onwards. Mean ± SEM, n=3.
Figure 9 – Terminal fate outcomes are unaltered by
KAT2A depletion, despite a global reduction in
colony formation. Mean ± SEM, n=3.
Figure 10 – KAT2A depletion does not alter
primitive CD34 expression. Mean ± SEM, n=3.
Figure 11 – Lineage affiliation and proliferative
capacity is not altered between daughter cell pairs.
Colonies were exclusively erythroid. Mean ± SEM, n=2.
• Loss of KAT2A does not alter lineage output of single HSC/MPPs (Figure 9), nor alter self-renewal
properties of these cells (primitive CD34 expression) (Figure 10), however a global reduction in colony
formation is seen (Figure 9).
• Asymmetric fate outcomes were not observed in the daughter cell assay (Figure 11).
• CD38 and CD123 expression levels correlate with formation of large colonies (>100 cells) (Figure 12).
• CD38 and GFP expression levels correlate with transient colony formation in KAT2Ash samples (Figure 13).
0
5
10
15
20
25
30
35
%CD34+cells
CTRLsh KAT2Ash
Control D8 KAT2Ash D8
Figure 8 – Morphologically differentiated
cells observed in the KAT2Ash samples from
D6 onward (representative image).
0
20
40
60
80
100
120
140
D0 D1 D2 D3 D4 D5 D6 D7 D8 D9
Numberofcells(perclone)
Ctrl KAT2Ash
p = 0.014
p = 0.016
p = 0.001
p < 0.001
Figure 4 – Clonal
analysis of the culture-
reconstituting
potential of control
(left) and KAT2A
depleted (right) CD34+
HSC/MPPs isolated
from 3 independent
cord blood samples.
Rows represent
progeny of single cells
deposited at day 0.
Cells were cultured in
multi-lineage
sustaining cytokines
and enumerated daily.
0 cells
1 cell
2-10 cells
11-25 cells
26-50 cells
51-100 cells
101-250 cells
>250 cells
0
5
10
15
20
25
30
Cloningefficiency(%)
CTRLsh KAT2Ash
p = 0.001
0
5
10
15
20
25
30
%Transientclones
CTRLsh KAT2Ash
p = 0.002
Depletion of KAT2A, a histone acetyltransferase, has been found to increase transcriptional
heterogeneity and reduce proliferation of AML cells (Tzelepis et al. Cell Rep 2016), making it
a potential target and candidate regulator of cell fate. Previous studies utilizing colony-
forming cell (CFC) assays have suggested that KAT2A may be essential for normal
erythroid cell maturation. However, this method is more subjective than other methods
employed to classify colony type, inviting further investigation, particularly as transcriptional
profiling of these cells does not demonstrate a global downregulation in lineage-specific
transcriptional programs.
Previous studies in the Pina lab have demonstrated that lineage commitment of normal
hematopoietic stem cells associates with increased cell-to-cell gene expression
heterogeneity (Pina et al. Nat Cell Biol 2012). We hypothesize that this enhanced
transcriptional “noise” impacts lineage commitment decisions in both normal and malignant
hematopoietic cells. This may promote differentiation of leukemic cells, driving the cells out
of the self-proliferative malignant state towards differentiation (Figure 1).
Figure 1 – The haematopoietic stem cell hierarchy (above) and
proposed effects of transcriptional heterogeneity (below).
1. KAT2A depletion reduces colony-reconstituting potential of normal
haematopoietic stem cells.
2. …without altering lineage bias.
In contrast with previous CFC-assay findings. This reinforces transcriptional profiling data which indicates that
no global downregulation of lineage-specific genes occurs in KAT2Ash cells.
Defects at different levels in erythroid colony formation aside from lineage specification may confound CFC
classification (e.g. decreased/delayed haemoglobinization).
3. …but it may accelerate differentiation.
We hypothesise that the reduced colony-reconstitution potential may result from accelerated cell
differentiation of the cells, leading to an apparent reduction in proliferation, as opposed to KAT2A depletion
reducing cell viability itself (Figure 14), and potentially with different impacts in different lineages.
The association between “transient clones” and KAT2A knockdown may reflect this phenotype and be useful
in identifying the underlying molecular perturbations.
Use correlations between initial single-cell surface phenotype and fate outcomes to capture cells with a
“transient clone” phenotype. This may indicate cells with a propensity for accelerated differentiation, which
should be apparent in their transcriptional profile. This can be determined by single cell RT-qPCR for
lineage markers, or more globally, by single-cell RNAseq.
Probe the time-dependency of first division with respect to fate outcomes in daughter cell assays and test
the contribution of KAT2A. Capture of daughter cells with different first division kinetics has the potential to
more thoroughly probe lineage heterogeneity.
KAT2A
Figure 14 – The proposed
effects of KAT2A depletion
on haematopoietic stem
cell differentiation.
KAT2A
HSC/MPP
CD34+CD38-
D2 D3 D4 D5 D6 D7 D8
Figure 3 – Representative images of clonal expansion observed
in the control samples.
Figure 13 – Increased CD38 expression and lower GFP
expression correlates with transient colony formation (TC)
within the KAT2Ash population. p=0.005, p=0.035 respectively.
Figure 12 – Increased CD38 and CD123 expression correlates
with large colony formation (>100 cells). p<0.001, p=0.005
respectively.
100
1000
10000
100000
100 1000 10000
GFP
CD38
CTRLsh
KAT2Ash
CTRLsh, TC
KAT2Ash, TC
0
2
4
6
8
10
12
Myeloid Erythroid Mixed
%Totalcells
CTRLsh KAT2Ash
10
100
1,000
10,000
100,000
100 1000 10000
CD123
CD38
CTRLsh
KAT2Ash
CTRLsh, Colony
KAT2Ash, Colony
Whole population analysis
Figure 2 – Single cell
analysis allows greater
insight into heterogenous
populations, particularly
when combined with
temporal data such as
proliferation kinetics.
Single cell analysis
7-9d
HSCs/AML
NOISE
Self-renewal Differentiation
HSC
CMP
CLP
MEP GMP
Haematopoietic Stem Cell (HSC)
CD34+CD38-
Multipotent Progenitor (MPP)
CD34+CD38-
Common Lymphoid
Progenitor
Common Myeloid Progenitor (CMP)
CD34+CD38+CD45RA-
Erythrocytes Platelets Granulocytes Macrophages
Megakaryocyte–Erythroid
Progenitor Cell (MEP)
CD34+CD38+CD123+CD45RA+
Granulocyte-Macrophage
Progenitor Cell (GMP)
CD34+CD38+CD123-CD45RA-
T, B, NK and
Dendritic Cells
3d
Lentiviral
0
20
40
60
80
100
120
Symmetric Asymmetric
%Daughtercellpairs(32)
CTRLsh KAT2Ash
Indexsorting