More Related Content
Similar to NSIT Financial Overview Analysis
Similar to NSIT Financial Overview Analysis (20)
More from Leon Liang (20)
NSIT Financial Overview Analysis
- 1. NSIT
Financial
Overview
Gangming
Liang
1)
Due
to
the
downturn
of
the
global
economy
during
2012
Q3-‐
Q4,
NSIT
reduced
long-‐
term
debt
weight
for
high
business
risk
in
IT
direct
market
and
improving
solvency.
Poor
liquidity
caused
by
poor
receivable
management
offsets
the
positive
sides
of
inventory
turnover
and
sales.
Operating
cash
flow
and
capital
management
maintain
NSIT's
profitability.
2)
Various
valuation
methods
double
confirm
that
NSIT
is
undervalued.
EV/
EBITDA
multiple
has
potential
increase
as
a
result
of
economic
recovery,
SaaS
sales
increse,
and
cloud
capitalization.
Current
price
breaks
out
from
distribution
range,
$14-‐
$19,
and
might
fall
back
to
$15-‐
$17
in
short-‐
run.
However,
NSIT
is
worth
more
than
the
current
price
fundamentally.
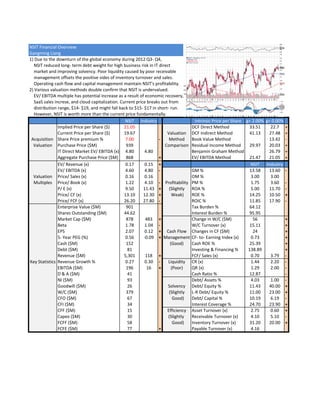
NSIT Industry Intrinsic
Price
per
Share g=
2.00% g=
0.00%
Implied
Price
per
Share
($) 21.05 DCF
Direct
Method 33.51 22.7 +
Current
Price
per
Share
($) 19.67 Valuation DCF
Indirect
Method 41.13 27.48 +
Acquisition
Share
Price
premium
% 7.00 -‐ Method Book
Value
Method 13.42 -‐
Valuation Purchase
Price
($M) 939 Comparison Residual
Income
Method 29.97 20.03 +
IT
Direct
Market
EV/
EBITDA
(x) 4.80 4.80 Benjamin
Graham
Method 26.79 +
Aggregate
Purchase
Price
($M) 868 + EV/
EBITDA
Method 21.47 21.05 +
EV/
Revenue
(x) 0.17 0.15 + NSIT Industry
EV/
EBITDA
(x) 4.60 4.80 -‐ GM
% 13.58 13.60 -‐
Valuation Price/
Sales
(x) 0.16 0.16 OM
% 3.00 3.00
Multiples Price/
Book
(x) 1.22 4.10 -‐ Profitability PM
% 1.75 3.60 -‐
P/
E
(x) 9.50 11.43 + (Slightly ROA
% 5.00 11.70 -‐
Price/
CF
(x) 13.10 12.30 +
Weak) ROE
% 14.25 10.50 +
Price/
FCF
(x) 26.20 27.80 -‐ ROIC
% 11.85 17.90 -‐
Enterprise
Value
($M) 901 Tax
Burden
% 64.12
Shares
Outstanding
($M) 44.62 Interest
Burden
% 95.95
Market
Cap
($M) 878 483 + Change
in
W/C
($M) 56 +
Beta 1.78 1.04 -‐ W/C
Turnover
(x) 15.11 +
EPS 2.07 0.12 + Cash
Flow Changes
in
CF
($M) 24 +
5-‐
Year
PEG
(%)
0.56 -‐0.09 + Management CF-‐
to-‐
Earning
Index
(x) 0.73 +
Cash
($M) 152 (Good) Cash
ROE
% 25.39 +
Debt
($M) 81 Investing
&
Financing
% 138.89 +
Revenue
($M) 5,301 118 + FCF/
Sales
(x) 0.70 3.79 -‐
Key
Statistics Revenue
Growth
% 0.27 0.30 -‐ Liquidity CR
(x) 1.44 2.20 -‐
EBITDA
($M) 196 16 + (Poor) QR
(x) 1.29 2.00 -‐
D
&
A
($M) 41 Cash
Ratio
% 12.87 -‐
NI
($M) 93 Debt/
Assets
% 4.03 1.00 -‐
Goodwill
($M) 26 Solvency Debt/
Equity
% 11.43 40.00 +
W/C
($M) 379 (Slightly L-‐R
Debt/
Equity
% 11.00 23.00 +
CFO
($M) 67
Good) Debt/
Capital
% 10.19 6.19 -‐
CFI
($M) 34 Interest
Coverage
% 24.70 23.90 +
CFF
($M) 15 Efficiency Asset
Turnover
(x) 2.75 0.60 +
Capex
($M) 30 (Slightly
Receivable
Turnover
(x) 4.10 5.10 -‐
FCFF
($M) 58
Good) Inventory
Turnover
(x) 31.20 20.00 +
FCFE
($M) 77 + Payable
Turnover
(x) 4.16