
Recommended
Recommended
More Related Content
What's hot
What's hot (19)
Similar to KHI.ORG: Kansas Medicaid and CHIP Enrollment Surges in 2014
Similar to KHI.ORG: Kansas Medicaid and CHIP Enrollment Surges in 2014 (20)
KHI.ORG: Kansas Medicaid and CHIP Enrollment Surges in 2014
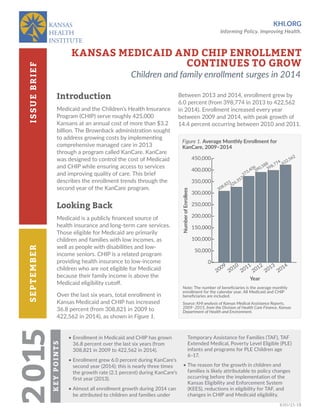
- 1. KHI.ORG Informing Policy. Improving Health. SEPTEMBERISSUEBRIEF KHI/15-18 2015KEYPOINTS • Enrollment in Medicaid and CHIP has grown 36.8 percent over the last six years (from 308,821 in 2009 to 422,562 in 2014). • Enrollment grew 6.0 percent during KanCare’s second year (2014); this is nearly three times the growth rate (2.1 percent) during KanCare’s first year (2013). • Almost all enrollment growth during 2014 can be attributed to children and families under Temporary Assistance for Families (TAF), TAF Extended Medical, Poverty Level Eligible (PLE) infants and programs for PLE Children age 6–17. • The reason for the growth in children and families is likely attributable to policy changes occurring before the implementation of the Kansas Eligibility and Enforcement System (KEES), reductions in eligibility for TAF, and changes in CHIP and Medicaid eligibility. KANSAS MEDICAID AND CHIP ENROLLMENT CONTINUES TO GROW Children and family enrollment surges in 2014 Introduction Medicaid and the Children’s Health Insurance Program (CHIP) serve roughly 425,000 Kansans at an annual cost of more than $3.2 billion. The Brownback administration sought to address growing costs by implementing comprehensive managed care in 2013 through a program called KanCare. KanCare was designed to control the cost of Medicaid and CHIP while ensuring access to services and improving quality of care. This brief describes the enrollment trends through the second year of the KanCare program. Looking Back Medicaid is a publicly financed source of health insurance and long-term care services. Those eligible for Medicaid are primarily children and families with low incomes, as well as people with disabilities and low- income seniors. CHIP is a related program providing health insurance to low-income children who are not eligible for Medicaid because their family income is above the Medicaid eligibility cutoff. Over the last six years, total enrollment in Kansas Medicaid and CHIP has increased 36.8 percent (from 308,821 in 2009 to 422,562 in 2014), as shown in Figure 1. Figure 1. Average Monthly Enrollment for KanCare, 2009–2014 Note: The number of beneficiaries is the average monthly enrollment for the calendar year. All Medicaid and CHIP beneficiaries are included. Source: KHI analysis of Kansas Medical Assistance Reports, 2009–2015, from the Division of Health Care Finance, Kansas Department of Health and Environment. Between 2013 and 2014, enrollment grew by 6.0 percent (from 398,774 in 2013 to 422,562 in 2014). Enrollment increased every year between 2009 and 2014, with peak growth of 14.4 percent occurring between 2010 and 2011. 0 50,000 100,000 150,000 200,000 250,000 300,000 350,000 400,000 450,000 NumberofEnrollees Year 2009 2010 2011 2012 2014 2013 308,821 422,562 326,357 373,406 390,588 398,774
- 2. 2 September 2015 Kansas Medicaid and CHIP Enrollment Continues to Grow Enrollment for children and families in Medicaid has increased 51.3 percent over the last six years (from 162,403 in 2009 to 245,702 in 2014), while enrollment in CHIP has increased 41.8 percent (39,132 in 2009 to 55,496 in 2014), as shown in Figure 2. Second Year of KanCare Enrollment Changes National data for Medicaid and CHIP show an 8.3 percent average enrollment increase for 2014. The Kansas Medicaid and CHIP growth of 6.0 percent is well below the national increase, likely because Kansas did not expand its Medicaid program in 2014 as many other states did. KanCare enrollment growth shows some notable differences when the population is separated into eligibility categories. Children and families Children and families accounted for 85.9 percent of the total KanCare enrollment increase between 2013 and 2014 (Figure 3, page 3). Figure 2. Average KanCare Enrollment by Population Group, 2009–2014 Source: KHI analysis of Kansas Medical Assistance Reports, 2009–2015, from the Division of Health Care Finance, Kansas Department of Health and Environment. 0 50,000 100,000 150,000 200,000 250,000 2009 Monthly Average Enrollment by Year 2010 2011 2012 2013 2014 AverageMonthlyEnrollees 36,801 162,403 58,318 245,702 225,115224,898 212,066 175,875 61,42361,28661,35761,62559,726 48,018 54,536 34,449 43,83342,07840,64139,208 Children and Families Seniors CHIP Individuals with Disabilities Population Group 39,143 45,325 39,132 55,496 CHIP enrollment accounted for only 4.0 percent of the total KanCare enrollment increase during this same time—a stark change from the previous year when CHIP accounted for nearly all of the growth. Members eligible through Temporary Assistance for Needy Families (TAF) and TAF Extended Medical are low-income children and families who also are eligible for cash assistance through the TAF program. TAF Extended Medical is available to families who reach the lifetime limit for cash assistance or earn too much to continue receiving cash assistance. The extended medical benefits provide health insurance for up to four months. Overall, for children and families, most of the enrollment change was due to increases in TAF enrollment (14,111), (Figure 4, page 3). Disabled population Enrollment was essentially flat (61,286 in 2013 to 61,423 in 2014) for individuals with disabilities during the second year of KanCare. Annual enrollment growth for individuals with disabilities ranged from -0.4 to 3.2 percent between 2009 and 2014.
- 3. 3September 2015Kansas Medicaid and CHIP Enrollment Continues to Grow Figure 3. Growth in KanCare Enrollment by Category, 2013–2014 Note: Total increase in average monthly enrollment by eligibility category = 23,967. This total differs slightly from the increase in total average monthly enrollment between 2013 and 2014 of 23,788 in Figure 1, page 1, due to averaging. Source: KHI analysis of Kansas Medical Assistance Reports, 2009–2015, Division of Health Care Finance, Kansas Department of Health and Environment. Seniors Low-income individuals age 65 or older are eligible for coverage under both Medicaid and Medicare (the federal health insurance program for this age group). This eligibility group grew by 4.2 percent (from 42,078 in 2013 to 43,833 in 2014)—falling within the historical growth trends, which ranged from 3.5 to 6.8 percent between 2009 and 2013. Policy Impacts Enrollment growth in KanCare during 2014 is notable for the increases in Medicaid children and family eligibility groups. The unprecedented jump in TAF, TAF Extended Medical and low-income children enrollment could be attributed to policy changes related to the implementation of the Kansas Eligibility and Enforcement System (KEES). KEES is a computer system designed to replace the existing state system used to keep track of who is eligible for Medicaid and other assistance programs. Figure 4. Change in Enrollment for KanCare Children and Families, 2013–2014 Note: Total change in enrollment for KanCare children and families = 20,587. “PLE” = Poverty Level Eligible; “TAF” = Temporary Assistance for Needy Families. Source: KHI analysis of Kansas Medical Assistance Reports, 2009–2015, Division of Health Care Finance, Kansas Department of Health and Environment. Children and Families Seniors 7.3%85.9% Disabled 0.6% CHIP 4.0% Other 2.2% -1,500 500 2,500 4,500 6,500 8,500 10,500 12,500 14,500 Eligibility Category TAF TAF Extended Medical Medically Needy Families PLE Children Age 1-5 PLE Pregnant Women PLE Children Age 6-17 PLE Infants Age 0-1 IncreaseinAverageMonthlyEnrollment 3,109 14,111 3,162 1,881 -148 -369 -1,159 Total Change in Enrollment for Children and Families = 20,587
- 4. ABOUT THE ISSUE BRIEF This brief is based on work done by John Allison and Scott C. Brunner, M.A. This publication is available online at khi.org/policy/article/ medicaid-CHIP-grows. KANSAS HEALTH INSTITUTE The Kansas Health Institute delivers credible information and research enabling policy leaders to make informed health policy decisions that enhance their effectiveness as champions for a healthier Kansas. The Kansas Health Institute is a nonprofit, nonpartisan health policy and research organization based in Topeka that was established in 1995 with a multiyear grant from the Kansas Health Foundation. Copyright© Kansas Health Institute 2015. Materials may be reprinted with written permission. Reference publication number KHI/15-18. SEPTEMBER 2015 khi.org785.233.5443 212 SW 8th Avenue | Suite 300 Topeka, Kansas | 66603-3936 /KHIorg @KHIorg KEES allows applicants to submit information electronically to the state for review. KEES also will match information provided with other state and federal databases to help prevent inaccurate information and automate eligibility decisions for medical assistance programs. Kansas Medicaid policy requires an annual review of eligibility for KanCare. However, all medical assistance eligibility reviews were suspended from October 2013 to March 2014 to temporarily relieve state agency workload during the transition to new policies under the Affordable Care Act (ACA) and the planned implementation of KEES. During this time, KanCare eligibility continued without the required review of case information. Under normal circumstances, the state agency would collect and update members’ information (such as income and household size) to determine if KanCare eligibility still exists. However, it is unclear how much of a role the implementation of KEES actually played in the observed enrollment increase. Changes in eligibility rules for cash assistance through TAF could also play a role in changing enrollment in Medicaid. Kansas reduced the lifetime limit for cash assistance from 60 to 48 months as of November 2012 (and has since reduced the limit to 36 months, effective July 2015). Kansas also raised the requirement to demonstrate job searches or training as a condition of receiving cash assistance. The eligibility changes for cash assistance might be expected to lead to a decrease in enrollment for the TAF group, and an increase in the TAF Extended Medical group. As more people run out of cash assistance, they could continue receiving extended medical benefits during the four months following the end of cash assistance. The number of people on extended medical should decrease over time as the cash assistance population reaches a lower level. However, the number of children eligible for Medicaid (because of their family income) could continue to grow as a population in Medicaid, even after cash assistance runs out for the family. Between 2013 and 2014, enrollment of low-income children age 1–5 in Medicaid decreased by 2.1 percent, while enrollment of low-income children age 6–17 in Medicaid increased by 4.4 percent. Historically, enrollment for both of these age groups has grown at about the same rate. One possible explanation could come from changes in eligibility rules because of the ACA, which required moving some children who were eligible for CHIP to Medicaid starting in January 2014. This change affected children age 6–17 from 99 to 113 percent of the federal poverty level (FPL). Prior to January 2014, children between 99 and 113 percent of FPL were covered under CHIP. That would suggest growth in Medicaid enrollment for children age 6–17 was—at least in part—a substitution of children originally covered by the CHIP program. However, since CHIP enrollment continued to grow in 2014 (Figure 2, page 2), the number of children who switched from CHIP to Medicaid was less than the total number of children who were added to CHIP during that same time period. Conclusion The KanCare population grew faster in 2014 than it did in 2013—with nearly all of the growth coming from children and families in Medicaid, but not CHIP. Several reasons for the growth could be attributed to policy changes occurring before the implementation of KEES, reductions in eligibility for cash assistance, and changes in Medicaid and CHIP eligibility.