
Recommended
Recommended
More Related Content
What's hot
What's hot (20)
Similar to 2015 03-16-elk at-bsides
Similar to 2015 03-16-elk at-bsides (20)
Recently uploaded
Recently uploaded (20)
2015 03-16-elk at-bsides
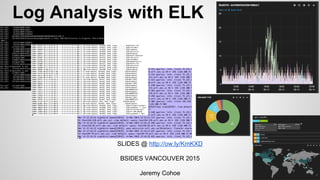
- 1. SLIDES @ http://ow.ly/KmKXD BSIDES VANCOUVER 2015 Jeremy Cohoe Log Analysis with ELK
- 2. Intro and agenda: 1. What is ELK? - Elasticsearch - Database - Logstash - Log Parser - Kibana - GUI 2. Using ELK for fun and profit ...demo - 802.11 client probe monitoring - with Software Defined Radio 3. Using ELK in Production ...demo - Linux central syslog, scaling out - Plugins: head, HQ, marvel End
- 3. About me… Sysadmin, wireless & amateur radio… Who is this talk for? - If you look at logs - If you have logs and you don’t look at them Familiar with ELK? Who here uses ELK? Introduction
- 4. Three open-source projects that have merged into the ELK stack Commercial support available from Elasticsearch “Elastic provides a growing platform of open source projects and commercial products designed to search, analyze, and visualize your data, allowing you to get actionable insight in real time” - Elasticsearch.com Logstash - Log Parser Elasticsearch - Database Kibana - GUI (html5) QuickELK 1. What is ELK?
- 5. Logstash Configuration Three Main sections - Input - Output - Filter This is where the magic happens
- 6. Logstash Input Lots of inputs: file syslog redis lumberjack
- 7. Logstash Output Lots of outputs! elasticsearch file redis graphite statsd
- 8. Logstash Filters Grok - Parser “Grok is currently the best way in Logstash to parse unstructured log data into something structured and queryable” Mutate - lowercase, merge, replace, split, strip Drop, Clone GeoIp grok debugger (the secret sauce for success)
- 10. The logstash magic Logstash filter parsing the event The log/message/event Parsed event is now in the database (viewed through Kibana)
- 11. ELK is.... Logstash - Log Parser Elasticsearch - Database Kibana - GUI (html5)
- 12. Elasticsearch Automatic clustering and replication Rolling upgrades Types of nodes: Master, Data, Client “Elasticsearch is a search server based on Lucene. It provides a distributed, multitenant-capable full-text search engine with a RESTful web interface and schema-free JSON documents. Elasticsearch is developed in Java and is released as open source under the terms of the Apache License.” - Wikipedia: Elasticsearch
- 13. ELK is.... Logstash - Log Parser Elasticsearch - Database Kibana - GUI (html5)
- 14. Kibana 3 Easy to install Download tarball, unzip, edit config.yml Limited security - Must use custom solutions nginx as a reverse proxy mod_auth_ldap iptables Dashboard Setup Once Logstash and Elasticsearch are configured, most time will be spent in Kibana Dashboard complexity depends on number of fields/variables in your data
- 15. Kibana 4 Released Feb 2015 Built in webserver on port 5601 using the JRE Connects to the Elasticsearch cluster as a client SSL, Native LDAP and role based access (with Shield plugin, $$$) Demo and screenshots are from Kibana3 :(
- 17. 2. Using ELK for fun and profit 802.11 client probe monitoring with Software Defined Radio
- 18. 2. Using ELK for fun and profit 802.11 client probe monitoring Analyzing client probe requests Tshark and an Alfa Wireless card on RaspberryPi to monitor the 802.11 RF airspace for client probe requests
- 20. Using the SDR + Raspberry Pi to decode FLEX Pager signals 2. Using ELK for fun and profit with Software Defined Radio
- 21. Use GNURadio and rtl_flex from Github to decode signals https://github.com/zarya/sdr/tree/master/receivers/flex Setup: Install GNURadio Download rtl_flex python scripts from Github Start it up: Decoding FLEX Signals
- 22. Output from rtl_flex Doesn’t provide much insight into what is actually going on
- 24. 3. Using ELK in Production Linux Central Syslog Scaling with Redis and Elasticsearch Plugins are easy to install: elasticsearch/bin/plugin --install mobz/elasticsearch-head Plugins: head, HQ, marvel Tools: Curator Stats: Log retention, events per second
- 25. Scaling Elasticsearch Implement REDIS as a log broker Ability to perform rolling restarts and upgrades without data loss or interruption to search capabilities Split database functions into dedicated VM’s - Master: Keeps tracks of data and cluster management tasks, shard routing - Data: Does the heavy lifting, searching, indexing - Client: Load balances requests from Kibana, custom scripts and clients Cluster resource monitoring is important!!!
- 26. Head plugin Shows number of indexes, shards, cluster nodes
- 27. HQ plugin Cluster health, performance tuning metrics
- 28. Marvel plugin Comprehensive cluster overview dashboard inKibana
- 29. Tools and Stats “Curator: Tending your time-series indices in Elasticsearch” Central Syslog Stats: about 100 million events per day, 1500 events per second average, 256GB ram and 16TB disk distributed across 8 VM’s (32gb ram and 2tb disk each). Events kept between 7, 30, 90, and 365 days.
- 31. The end. Questions??? SLIDES @ http://ow.ly/KmKXD BSIDES VANCOUVER 2015 Jeremy Cohoe jeremy.cohoe@ubc.ca
- 32. Backup Dashboard Screenshots Sample dashboards RADIUS Health Status DHCP FLEX 802.11 Client Probe Monitoring BCWARN Netflow setup & Kibana Dashboard IRC dashboard and analytics