
Recommended
Recommended
More Related Content
More from Jamcracker Inc
More from Jamcracker Inc (12)
Recently uploaded
Recently uploaded (20)
Cloud Analytics: The Power of Visualization for Cloud Cost Management
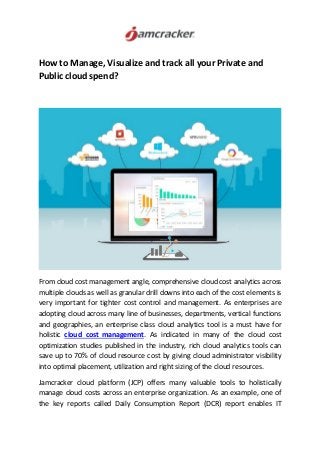
- 1. How to Manage, Visualize and track all your Private and Public cloud spend? From cloud cost management angle, comprehensive cloud cost analytics across multiple clouds as well as granular drill downs into each of the cost elements is very important for tighter cost control and management. As enterprises are adopting cloud across many line of businesses, departments, vertical functions and geographies, an enterprise class cloud analytics tool is a must have for holistic cloud cost management. As indicated in many of the cloud cost optimization studies published in the industry, rich cloud analytics tools can save up to 70% of cloud resource cost by giving cloud administrator visibility into optimal placement, utilization and right sizing of the cloud resources. Jamcracker cloud platform (JCP) offers many valuable tools to holistically manage cloud costs across an enterprise organization. As an example, one of the key reports called Daily Consumption Report (DCR) report enables IT
- 2. administrators to customize various cloud consumption parameters of interest such as product type, usage type, charge type, currency, quantity, unit price, unit quantity, consumption amount, etc. Thus, DCR report can be customized to aggregate the cloud cost and usage information on a daily basis across multiple clouds for a specific date range. While reporting is a great on-demand tool for historical trend analysis of the data available in the datamarts, it does not give real time snapshot of what’s happening in terms of cloud consumption across an enterprise. Further, business users are often not interested in the technical details of cloud resources being consumed but rather the business impacting issues such as the overall cloud cost trends, cost savings due to cloud migration, cloud cost mix by cloud service providers and the overall return on investment (ROI) for the cloud deployments. This is why cloud cost management dashboards are such a powerful tool for not only the IT administrators but also the business users such as IT business analysts and IT finance managers. In JCP – Cloud Analytics virtual appliance module, we provide various dashboards to address the needs for different stakeholders who need to keep a close watch on the live cloud usage across all parts of an enterprise. These dashboards offer live cloud consumption intelligence including cost associated with each of the cloud resources, usage of these resources and any missed opportunities for cloud cost optimization. Let’s drill down into each of these dashboards and understand the benefits of each type of these dashboards: 1. Executive Dashboard As the name suggests, executive dashboard is an important visualization tool for the executives. It tracks key cloud trends such as costs and resources in order to help DevOps, IT Managers, CIOs, CTOs, and Finance departments to oversee all of the cloud costs centrally.
- 3. Following are some of the key attributes of the information that can aid executives in making investment and ROI decisions: Cloud Cost Trend: The Cloud Cost Trend shows the cost trends based on previous spending providing valuable information about cost anomalies. Analyzing the trend over monthly, year-to-date or a specific date range will give valuable insight on critical trends, spikes, and recurring patterns and enables you to react instantly and avoid unnecessary upcoming costs. Cost by Provider: In a multi-cloud deployment, identify cost for each cloud service provider and compare the costs across providers. This data will provide insights to optimize spending and provide optimal workload allocation insights.
- 4. Cost by Products: View of cloud cost by specific cloud services consumed within an organization. All services (SaaS, IaaS or PaaS) consumed during a selected period are considered. Cost by Resources: A cloud resource can be a virtual machine, storage volume, snapshots, machine images, IP address or any other resource that is consumed from a cloud service provider. The resource label is comprised of resource ID, resource name, and the provider's name and it uniquely identifies a cloud resource. Cost by Tags: For organizations that take advantage of the resource-based tagging feature, this dashboard view can be used to visualize costs based on environment, project, cost center, department or any other tagging dimension. Tags allow cost management on a granular level and align cloud cost to an organization’s structure. Gain better visibility into untagged infrastructure resources and ensure accountability of cloud resources by assigning tags to unmanaged resources 2. Live Dashboard Live Dashboard is an important visualization tool for daily operations staff such as IT administrators. It offers real-time inventory of the IaaS resources from various cloud providers.
- 7. Following are some of the key attributes of the information that can aid executives in analyzing real time health check of cloud usage and cost: Resource Summary: Resource summary lists the cloud resources along with their current state information. AWS Reserved Instances: View the list of reserved instances for an account by clicking Reserved Instances tab. You can view additional details of a specific reserved instance record such as scope, instance type, platforms, tenancy, terms and payment details, and offering types. 3. Cost Analytics Since up to 70% of the cloud cost can be optimized through better utilization of cloud resources in terms of unused as well as under utilized cloud resources, cloud cost analytics dashboard is an important visibility tool to see if cloud resources are being consumed optimally.
- 8. Following are some of the key attributes of the information in this dashboard that can allow IT administrators to dig deeper into the cloud resource cost and aid with right sizing of the resource. Product Cost Trend: View the cost trend for each product as well as the forecast for infrastructure services and plan the strategy for cost optimization. VM Count by Instance Type/Size/Flavor: The cost of a virtual machine can be broken down by various sizing tiers such as micro, small, standard, etc. Each instance is further classified based upon its purpose e.g. for general use, computation intensive, storage, GPU, or memory. Resource Count by Region: Different cloud regions have different pricing for each cloud provider. Resource usage can be identified and scaled effectively by this visualization that indicates the number of resources associated with each region. The label used to depict the resource count is a combination of the cloud region and the cloud provider’s name. Resource Cost by Region: Not all cloud infrastructure regions are priced the same. Varying resource cost across different regions supported by a cloud provider or among various cloud providers make it necessary to view cloud costs based on regions supported by each of the cloud providers. This feature is especially important as it provides a quick comparison of the cost for deploying a certain type of resource in a specific region and aids in choosing the right cloud provider that fits IT needs and offers lowest price. Cost by IaaS Usage Type: Analyzing costs based on the infrastructure usage type provides insights into hidden resource usage costs. Take the necessary action by terminating or re-sizing the instances. Cost by OS Platform: Cloud providers often charge a premium for the instances running Windows server as they need to cover windows server licensing cost. Hence, cost details based on the OS platform can be very helpful to see where IT dollars are spent in terms of OS platform provided by a cloud provider. 4. Tag Analytics
- 9. Tag-based cost allocation involves analyzing and associating the costs with specific categories (e.g. department, projects, etc.) to provide cost visibility allowing asset management, security, and compliance tracking. This dashboard allows IT users to view the cost associated with this resource based on different dimensions and enables you to organize your resources in a way that is independent of the cloud service provider.
- 10. Following are some of the key attributes of the information in this dashboard that can allow IT administrators to visualize cloud resource cost based on associated consumption tags. Product Cost by Tags: Analyze the cost of infrastructure services based on the resource tags and identify the cost drivers mapped to different organizational units. VM Count by Tags: The count of VMs grouped according to an organization’s tagging schema will be displayed allowing the IT team to immediately identify whether their infrastructure requires adjustment. For the selected Tag key, this dashboard displays total number of instances for each of the associated Tag Values. VM Cost by Tags: Tagging provides an efficient way to track and organize your resources based on the cost. For the selected Tag key, the report displays the cost of instances for each of the associated Tag Values. Thus, tags help to analyze your virtual machines cost to reflect your own cost structure. Tag Cost Trend: View the historical cost trend of resources based on a particular Tag key-value pair selection. This report considers all resources Tagged based on the tagging standards in your organization and provide insights cost effectiveness. Instance Type/Flavor/Size by Tags: Different providers offer different instance families to choose from and a variety of sizes for each instance type. For optimal resource allocation, analyze the cost of different types of Instances based on the associated tags. In conclusion, in order to efficiently manage the usage and cost of cloud resources, a rich cloud analytics engine is the need of time. Various stakeholders such as the IT business analysts, finance managers, devops users from business units and CTO staff all need visibility into cloud consumption on a real-time and historical basis. With various dashboards that are available in the Jamcracker Cloud Platform, customers can gain instant visibility and almost feel like they got the superpowers to manage cloud cost.
- 11. Give JCP-Cloud Analytics appliance a spin with our 30-day free trial program. You have got nothing to lose and only to gain. Now, give kudos to yourself for taking the first step to saving your company or customers a lot of money! Stay tuned for our next blog on saving even more cloud cost through automated cloud control policies.