1. Introduction
The mechanism of DNA bending has long been debated and results from
solution studies and x-ray crystallographic methods are often conflicting.
Solution studies suggest that MPD, which is added to DNA crystals during
growth, remove bends from DNA. The present study seeks to elucidate the
mechanism by which MPD affects DNA curvature. If DNA bending is induced
by cation binding, it is proposed that chelation of Mg2+ by MPD could
sequester the ions away from the DNA thereby decreasing its curvature. To test
this hypothesis, UV-Vis and NMR methods have been applied. Competition
experiments between MPD and the indicator Eriochrome Black T (EBT) for
Mg2+ ions have been used to probe for Mg2+ chelation by MPD. A
characteristic shift in the absorbance maximum of EBT was consistent with
competitive removal of Mg2+ from EBT by MPD. NMR experiments have also
been conducted to corroborate these results
Investigating of DNABending Induced by Mg2+ Sequestration
by 2-Methyl-2,4-Pentanediol
Jade King, Courtney Huff, Lori Isom and Nolan Carter
Department of Chemistry, University of Central Arkansas, Conway,AR, 72034
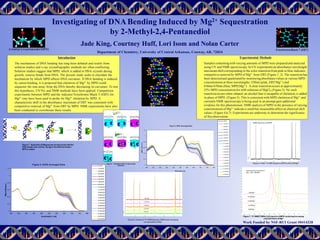
Experimental Methods
Samples containingwith varying amounts of MPD were preparedand analyzed
using UV and NMR spectroscopy.In UV experiments an absorbance wavelength
maximum shift corresponding to the color transitionfrom pink to blue indicates
competitive removal by MPD of Mg2+ from EBT.(Figure 1, 2) The transitionhas
been detectedand quantitatedby monitoringabsorbance values at various MPD
concentrations at three wavelengths: 530nm (pink, EBT/Mg2+) and
630nm/676nm (blue, MPD,Mg2+). A clear transitionoccurs at approximately
25% MPD concentrationfor mM solutions of MgCl2.(Figure 3) No such
transitionoccurs when ethanol,an alcohol that is incapable of chelation,is added
in place of MPD. (Figure 5) This is consistent with MPD chelationof Mg2+ and
currentlyNMR spectroscopyis being used in an attempt gain additional
evidence for this phenomenon. NMR analysis of MPD in the presence of varying
concentrations of Mg2+ indicate a small but measurable affect on chemical shift
values. (Figure 4,6,7) Experiments are underway to determine the significance
of this observation.
2-methyl-2,4-pentanediol (MPD) Eriochrome Black T (EBT)
Figure 3. MPD- Averaged Dat a
0
0 . 2
0 . 4
0 . 6
0 . 8
1
1 . 2
3 0 0 3 5 0 4 0 0 4 5 0 5 0 0 5 5 0 6 0 0 6 5 0 7 0 0 7 5 0 8 0 0
Wavel ength (nm)
0%MPD
1.27%MPD
2.53%MPD
3.80%MPD
5.06%MPD
6.33%MPD
7.59%MPD
8.86%MPD
10.12%MPD
11.40%MPD
12.65%MPD
13.93%MPD
15.18%MPD
16.46%MPD
17.72%MPD
18.99%MPD
20.25%MPD
21.52%MPD
22.78%MPD
24.05%MPD
25.31%MPD
Figure 5. EtOH-Averaged Data
0
0. 2
0. 4
0. 6
0. 8
1
1. 2
300 350 400 450 500 550 600 650 700 750 800
wavelength (nm)
0%EtOH
1.27%EtOH
2.53%EtOH
3.80%EtOH
5.06%EtOH
6.33%EtOH
7.59%EtOH
8.86%EtOH
10.12%EtOH
11.40%EtOH
12.65%EtOH
13.93%EtOH
15.18%EtOH
16.46%EtOH
17.72%EtOH
18.99%EtOH
20.25%EtOH
21.52%EtOH
22.78%EtOH
24.05%EtOH
25.31%EtOH
EBT
EBT
Mg2+
MPD
MPD
Mg2+
EBT
EBT
Mg2+
Mg2+
EBTEBT
Mg2+
Mg
2+
MPD
EBT EBT
EBT
EBT
EBT
EBT
Mg2+
Mg2+
Mg2+
Pink
EBT
EBT
Mg2+
Mg2+
Blue Add Mg2+
Pink
EBTMg2+
EBTMg2+
MPD
MPD
MPD
Add MPD Blue
Mg2+
Mg2+
Mg2+
Mg2+
Mg
2+
Mg
2+
Mg
2+
Mg
2+
Mg
2+
EBT
EBT
EBT
EBT
EBT
EBT
EBT
EBT
EBT
EBT
Mg
2+
Mg
2+
MPD
MPD
MPD MPD
Mg2+
EBT
Mg
2+
Mg
2+
MPD
EBT
EBTEBT
MPDMPD
Mg2+
Mg
2+
Mg
2+
MPD
MPDMPD
EBT
EBT
MPD
Mg2+
Mg
2+
Mg
2+
EBT
EBT
MPD
MPD
Figure 2. Illustration of UV-vis experimental
technique.
Work Funded by NSF-RUI Grant #0414328
Figure 7. 13C NMR(75MHz,D2O) spectra of MPD containingincreasing
concentrations of Mg2+
Figure 4.Initial 13C NMR Spectra ofMPD with 0.0M Mg2+
Figure 6.Overlay of13C NMR Spectra ofMPD with increasing
concentrations ofMg2+
Figure 1. Illustrationof Magnesium ioninteractionwiththe
DNA double helix andthe change in the DNA bendwhen
MPD is added.