Mapping Natural and Built Infrastructure in Two Urbanizing Cities
•Download as PPTX, PDF•
2 likes•702 views

The document summarizes a study that analyzed changes in wetlands and their ecosystem services in the cities of Kolkata and Nagpur, India between 2000 and 2013 using satellite imagery and field surveys. It found significant losses of wetland areas in both cities due to urbanization and changes in land use. Though many wetlands still provide a variety of important ecosystem services, conservation policies are needed to protect the remaining wetlands from further losses.

Recommended
Recommended
More Related Content
What's hot
What's hot (20)
Viewers also liked
Viewers also liked (14)
Similar to Mapping Natural and Built Infrastructure in Two Urbanizing Cities
Similar to Mapping Natural and Built Infrastructure in Two Urbanizing Cities (20)
More from International Water Management Institute (IWMI)
More from International Water Management Institute (IWMI) (20)
Recently uploaded
Recently uploaded (20)
Mapping Natural and Built Infrastructure in Two Urbanizing Cities
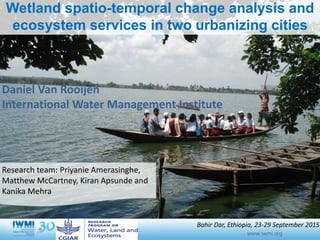
- 1. Wetland spatio-temporal change analysis and ecosystem services in two urbanizing cities Research team: Priyanie Amerasinghe, Matthew McCartney, Kiran Apsunde and Kanika Mehra Bahir Dar, Ethiopia, 23-29 September 2015 Daniel Van Rooijen International Water Management Institute
- 2. Contents • Introduction • Methods • Case study city characteristics
- 3. Introduction: Wetlands in India • A wealth of ecosystem service benefits • Inadequate attention in the national water sector agenda • Urbanization, population increase, land-use changes have impacted • Emphasis has been on ecologic and limnologic studies • Hydrological, landscape and wetland spatio- temporal change analysis studies are sparse
- 4. Methods • Two cities (2014): Kolkata, West Bengal Nagpur, Maharashtra • Landsat 7 and 8 satellite images 2000 and 2013 (November/December – post monsoon/winter) • Supervised Image classification and Modified Normal Difference Water Index (MNDWI); • TEEB’s approach (The Economics of Ecosystems and Biodiversity) to assess ESS – A total of 27 ESS were selected, based on observations and surveys. • 4 wetlands were investigated to validate the ESS and wetland dependence by poor communities
- 5. Photo:DavidBrazier/IWMIPhoto:TomvanCakenberghe/IWMI Kolkata Nagpur City type Metropolitan City Metropolitan City Population KMC- 4.49 million KMDA-14.77 million NMC- 2.41 million Population density 24,000 persons/ sq. km 11,000 persons/ sq. km Area KMC-185 sq. km KMDA-1886 sq. km NMC- 217 sq. km NMA- 3780 sq. km Main industries IT industry Mining and agriculture (Orange City of India) Population Growth rate 1.73% n.a. Climate Annual rainfall:1,582 mm Annual mean temperature 250 C Annual rainfall: 1,205 mm Annual temperature 20-330 C City characteristics
- 6. Location of study sites 0 3 6 9 121.5 Kilometers Kolkata Area: 87,500 ha Nagpur Area: 92,500 ha
- 7. CLICK TO EDIT MASTER TITLE STYLE Mapping Natural and Built Infrastructure • TCWI = Tasselled Cap Wetness Index • MNDWI = Modified Normalized Difference Water Index • NDVI = Normalized difference Vegetation Index • DN = Digital Number MNDWI was found to be the most suitable index. The water bodies therefore were extracted using MNDWI Field Validation of mapped features Post Validation Changes Final Maps Landsat 7 -2000 Landsat 8 - 2013 Mapped & Classified 2000 & 2013 Field Validation Change Analysis at City and Watershed Level
- 8. Wetland Selection and Field Surveys (HH & FGDs) Ecosystem Services Check-listing / Scoring Wetland Selection based on ES Score & Community dependence Questionnaire Preparation, Validation, Revision and Field Surveys. For each of the ES identified, a score of 1 was given and summed-up to give a final score for the wetland.
- 9. Legend Hoogli River KMC_Boundary Built-up Water Bodies Open Spaces/ Wastelands Orchards/Trees Agriculture/Shrubs Map_Area ± 0 3 6 9 121.5 Kilometers 0 3 6 9 121.5 Kilometers November 2000 November 2013 Land Cover Changes: 2000 and 2013 – Kolkata
- 10. Results from Kolkata 1/2 • Size class of 0.36 ha and above were mapped (over 3,300 wetlands) • Built up areas (6%) and waste/open lands increased (1%) • Water bodies (3%), orchards and trees (5%) Agriculture and shrub lands (10%) decreased • 4 types of wetlands tanks, aquaculture/paddy rice, riverine marsh/lagoons and treatment units (10,645 ha) • Area-wise tanks constituted 12%, only 1.2% (127 ha) were natural. Rest was the EKW (East Kolkata Wetland)
- 11. Results from Kolkata 2/2 • 50% reduction in wetland area over a 12 year period • 37 wetlands were scored for ES. 30 in urban and 7 periurban • Number of reported Ecosystem Services (ES) varied between 4-20 per wetland • High number of ES provided by a majority of wetlands (75% fell within 15-17 range)
- 12. Distribution of ES (%) 1 Bathing and washing 2 Recreation 3 Religious activities 4 Medicinal plants/food 5 Fishing 6 Firewood 7 Construction Material 8 Agriculture 0 20 40 60 80 100 1 2 3 4 5 6 7 8 Urban Wetlands Peri-Urban Wetlands
- 13. 0 4 8 12 162 Kilometers ±Land Cover in Nagpur City Legend Stream Network Watershed BOundary NMC_Boundary Subwatersheds GRIDCODE Built-up Water Bodies Vegetation/Forest Agriculture/Scrubs Open/Fallow Sand Mine Ash Pond River Bed Year 2000 Year 2013
- 14. Results – Nagpur 1/2 • Size class of 0.36 ha and above were mapped (182 wetlands) • Built-up area (5%) agriculture/shrub land area (3%) increased • Marginal changes in water bodies • Forest area (5%) open fallow land (3%) decreased • 4 types of wetlands: tanks, reservoirs, water logged areas in quarries and treatment plants (844 ha)
- 15. Results - Nagpur 2/2 • 90% of wetland area were tanks and reservoirs • 0.4% were classified as natural • Loss of natural tanks (70%) was significant (was obscured by water in quarries) • ES scores varied from 15-23, and the distribution was very similar that found in Kolkata
- 16. Conclusions • Wetlands in Kolkata and Nagpur support a rich diversity of ES • No other studies available on wetland spatio– temporal changes that can evidence wetland losses • Wetland conservation plan is necessary (Wetland conservation policy drafted but not implemented) • Engagement of decision makers and users is important to develop policies that are relevant to wetland conservation.
- 17. Thank you • WLE program for funding • Daniel van Rooijen (IWMI - Ethiopia) • Anuradha Adikari and Aruna Jyoti (IWMI- Hyderabad) • Stakeholders in Kolkata and Nagpur • South Asia Forum for Environment, Kolkata • Centre for Rural Research and Community Development, Nagpur For more info contact Dr. Amerasinghe (p.amerasinghe@cigar.org)
Editor's Notes
- General account of wetlands in India
- Methods used. 50 households per wetland were interviewed to understand the wetland dependence and validation process. TEEB = The Economics of Ecosystems and Biodiversity
- Study areas: urban and periurban areas were demarcated for the study (roughly 30 km) but also taking into account the urban sprawl
- Satellite images used to spot the wetlands. The size class was defined, based on the resolution.
- Kolkata: Over 389 wetlands subjected to a rapid assessment first: 30 urban and 7 periurban wetlands were scored for ES. Nagpur 12 (4 were periurban). Presence was scored as 1, summed to give the final score.
- Loss in wetlands over the period of study
- 30 urban wetlands 7 periurban wetlands (we should have scored more periurban wetlands). ES uses in urban and periurban settings is different. Urban - mostly for bathing, recreational activities, religious; periurban – medicinal plants, fishing, agriculture etc.
- LULC Nagpur 2000
- 12 wetlands studied in detial, of which 4 were periurban