Strategic Tactic Presentation - Infographics
•Download as PPTX, PDF•
0 likes•800 views

Infographics are graphic visual representations that present information quickly and clearly. They convey data through design and can accelerate decision making. There are 5 main categories of infographics: chronological, directional, productive, quantitative, and cause and effect. Infographics have various applications in communications, fundraising, and marketing. They are easy to understand but can be time-consuming to create and have limitations for certain audiences. Cultural context and sensitivity must be considered when designing infographics for international applications.

Recommended
More Related Content
Viewers also liked
Viewers also liked (8)
Similar to Strategic Tactic Presentation - Infographics
Similar to Strategic Tactic Presentation - Infographics (20)
More from IPMP 510
Strategic Tactic Presentation - Infographics
- 2. Definition Infographics are graphic visual representations of information, data or knowledge Data + Design = Infographics!
- 3. What do they do? 1. Present complex information quickly and clearly 2. Conveys a story using design and data 3. Used worldwide in every discipline 4. Accelerates decision making
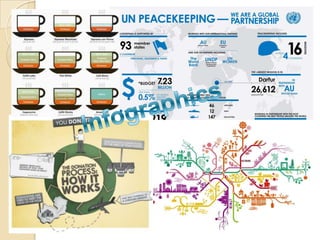
- 5. Infographics 5 Categories 1. Chronological Event or process over time 2. Directional Scale maps, symbols 3. Productive Key procedure, instruction, Education 4. Quantitative Convey data quickly, (ex. Pie charts, bar graghs tables, organizational flow charts) 5. Cause & Effect Explain causal relationships
- 7. 2. Directional Scale maps, traffic signals
- 8. 3. Productive procedures, education, instruction
- 9. 4. Quantitative charts, bar graphs, tables, flow charts, pie charts
- 10. 5. Cause and Effect
- 11. Applications 1. Communications 2. Fundraising 3. Marketing
- 13. Communications: Education OH&S
- 15. Fundraising INFOGRAPHIC: Red Cross Disaster Response in 2011
- 16. Marketing Levi’s and Water.Org: Levi’s Water Tank
- 17. Pros 1. Easy to read and understand 2. Attention-catching 3. Help to deal with information overload 4. Easy to share and distribute (via facebook, Twitter, Pinterest) 5. Transcend language barriers
- 18. Limitations 1. Time-consuming to create 2. Unreadable by search engines 3. Inaccessible to the visually impaired 4. Not every story can be told with a picture 5. Mandatory to understand target audience
- 19. Differences in Perceptions, Reactions and Interpretation of Colours Red Green Orange Western Danger Spring Harvest, Traffic Countries Stop Go Light Eastern/Asian Celebration Infidelity Sacred Good Luck North Africa Corruption Africa Wealth
- 20. Icons & Symbols Market Stall Currency “Apple” North Stall=4 legs Currency Associated with America/Europe tilted top & symbols more Health shade effective than those depicting coins/bank notes Asia/Africa Stall with wheels Same ???computers?? & umbrella ? shade Single currency such as US Empty stalls had dollar, not seen negative favourable connotations outside US/Europe.
- 21. Cultural Context Educational campaign. Problem: Read Right to Left
- 22. Cultural Sensitivity Human figures Use simple outlines (ex. In the Islamic world there are protocols around how both men and women are portrayed).
- 23. Case Study Background • an accounting and bookkeeping software company for small businesses Goal • Increase ranking on search engines and traffic on website Strategy • Link building campaign
- 25. Results Dec. 10 - 1,000 visitors 4,000 view by the end of December 123 Facebook likes 41 tweets 3,740 views on StumbleUpon 135 Diggs 30 organic links from eCommerce and finance articles and blogs 26% traffic increase compared to previous year
- 26. Conclusion
- 27. References http://www.gatesfoundation.org/infographics/Pages/infographics .aspx http://www.redcross.org/ http://www.wpromote.com/seo/case-study-outright http://visual.ly/ http://www.nationalpositions.com/blog/how-to-use-infographics-to- create-viral-marketing-campaign/ http://www.dachisgroup.com/2011/03/levi%E2%80%99s%C2%AE -watertank-successful-integrated-cause-marketing-in-action/ http://pinterest.com/howardlake/fundraising-infographics/?page=3 www.bluespiremarketing.com/blog http://www.hesperian.org/ http://www.instantshift.com/ www.expartners.co.uk/exblog/designing-inforgraphics-for- international-usability
Editor's Notes
- Let’s look at this example! (next slide)
- Infographics have an endless number of applications when it comes to communications, fundraising and marketing. You can spends hours looking at them on the internet. I’m going to show you a few highlights....
- Outright is a bookkeeping and accounting software company for small businesses - used Wpromote (online marketing)SEO- improving visibility of a website in a search engines unpaid search results They wanted to increase number of visitors to website in a highly competitive industry
- EarlyDecember - Outright launched an Infographic on their blog, titled “The Commerce of Christmas”.It broke down where people were doing their holiday shopping, when they were doing it, what they were buying, and how much the average shopper was spending during the holiday season. The Infographic quickly became a hit due to its timeliness and intriguing subject matter.
- . The updated title tags and content across the site significantly helped their rankings and visibility for many big industry keywords. In Google, which accounted for 90% of the site’s traffic, Outright’s ranking improved for their top three targeted keywords, moving from positions #7 to #1, #8 to #4, and #53 to #35.There were drastic traffic improvements for three targeted search terms in the fourth quarter of 2011 compared to the fourth quarter of 2010, showing an increase in traffic by 100%, 263%, and an astonding 1,708%.
- Visual.ly