
Recommended
Recommended
More Related Content
Recently uploaded
Recently uploaded (20)
Featured
Featured (20)
Scenic Hudson Sea Level Rise Mapper - Part 2
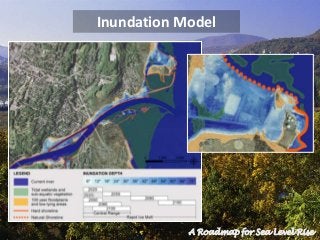
- 1. Inundation Model A Roadmap for Sea Level Rise
- 3. Hudson River Sea Level Rise Projections RISK AREAS CENTRAL RANGE RAPID ICE MELT SCENARIO CURRENT CURRENT
- 4. Hudson River Sea Level Rise Projections CENTRAL RANGE RAPID ICE MELT SCENARIO 2020 2020 RISK AREAS Inundation ZoneInundation Zone
- 5. Hudson River Sea Level Rise Projections RISK AREAS CENTRAL RANGE RAPID ICE MELT SCENARIO 2050 2050 Inundation ZoneInundation Zone
- 6. Hudson River Sea Level Rise Projections RISK AREAS CENTRAL RANGE RAPID ICE MELT SCENARIO 2080 2080 Inundation ZoneInundation Zone
- 7. Hudson River Sea Level Rise Projections RISK AREAS Isolated Inundation Zones CENTRAL RANGE RAPID ICE MELT SCENARIO 2080 2080
- 8. Increased Coastal Flooding • Inundation is the “new normal” for the river, but what about flooding? • Modeling same as inundation, except with FEMA Base Flood Elevations (BFE’s) • Base Flood Elevations are the basis for 1% risk flooding (100 year floodplains) A Roadmap for Sea Level Rise
- 9. Increased Coastal Flooding A Roadmap for Sea Level Rise BFE + 36” RiverBFE
- 10. A Roadmap for Sea Level Rise Increased Coastal Flooding
- 11. Increased Coastal Flooding January 2013 – FEMA issues Advisory BFE’s for NYC, NJ, Rockland & Westchester Counties Advisory BFE’s • Portray Current Flood Risks • Not regulatory (yet) • Recommended for all future planning • Do not consider sea level rise • Are 4-6’ higher than current BFE’s! Source: http://www.region2coastal.com/faqs/advisory-bfe-faq A Roadmap for Sea Level Rise
- 12. Increased Coastal Flooding June 2013 – FEMA issues Preliminary Work Maps for NYC • Similar to Advisory BFE’s • Process toward updating FIRMs A Roadmap for Sea Level Rise
- 13. Resources at Risk A Roadmap for Sea Level Rise
- 15. Inundated Area 2100 Overlays with Natural Resources, Infrastructure, and Cultural Resources
- 17. Intersect with census blocks & calculate statistics If 50% of a census block is inundated at 36”, then it is assumed that the same percentage of people and households in that block are inundated at 36” Areal Weighting
- 18. Inundated Area 2100 Intersect with census blocks & calculate statistics Stats calculated for over 2000 census blocks at each of 13 inundation steps and 13 flood steps Areal Weighting
- 19. Inundated Area 2100 At risk of inundation by 2100: 9,496 acres 3,654 households 6,911 people At risk of coastal flooding by 2100: 9,460 acres 11,929 households 22,221 people
- 20. Hudson Valley At Risk Statistics Municipal Infrastructure At Risk Railroad linear miles: Treatment Facilities: Hazardous Facilities: Brownfields: Schools: 102 401 3 11 28 130 23 65 0 10 Inundation Flooding A Roadmap for Sea Level Rise
- 21. Hudson River Sea Level Rise Projections TIDAL WETLAND IMPACTS CENTRAL RANGE RAPID ICE MELT SCENARIO CURRENT CURRENT
- 22. Hudson River Sea Level Rise Projections TIDAL WETLAND IMPACTS CENTRAL RANGE RAPID ICE MELT SCENARIO 2020 2020 Inundated Tidal Wetlands Inundated Tidal Wetlands
- 23. Hudson River Sea Level Rise Projections TIDAL WETLAND IMPACTS CENTRAL RANGE RAPID ICE MELT SCENARIO 2050 2050 Inundated Tidal Wetlands Inundated Tidal Wetlands