Discussion u te m keynotevideo
•Download as DOCX, PDF•
0 likes•219 views

Assessing HOTS in e-Learning among UTeM students in Malaysia

Recommended
More Related Content
Viewers also liked
Viewers also liked (20)
Similar to Discussion u te m keynotevideo
Similar to Discussion u te m keynotevideo (20)
Recently uploaded
Recently uploaded (20)
Discussion u te m keynotevideo
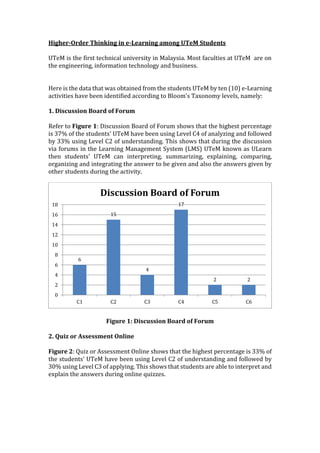
- 1. Higher-Order Thinking in e-Learning among UTeM Students UTeM is the first technical university in Malaysia. Most faculties at UTeM are on the engineering, information technology and business. Here is the data that was obtained from the students UTeM by ten (10) e-Learning activities have been identified according to Bloom's Taxonomy levels, namely: 1. Discussion Board of Forum Refer to Figure 1: Discussion Board of Forum shows that the highest percentage is 37% of the students' UTeM have been using Level C4 of analyzing and followed by 33% using Level C2 of understanding. This shows that during the discussion via forums in the Learning Management System (LMS) UTeM known as ULearn then students' UTeM can interpreting, summarizing, explaining, comparing, organizing and integrating the answer to be given and also the answers given by other students during the activity. Figure 1: Discussion Board of Forum 2. Quiz or Assessment Online Figure 2: Quiz or Assessment Online shows that the highest percentage is 33% of the students' UTeM have been using Level C2 of understanding and followed by 30% using Level C3 of applying. This shows that students are able to interpret and explain the answers during online quizzes. 6 15 4 17 2 2 0 2 4 6 8 10 12 14 16 18 C1 C2 C3 C4 C5 C6 Discussion Board of Forum
- 2. Figure 2: Quiz or Assessment Online 3. Web 2.0 (Facebook, Blog, Wiki) Refer Figure 3: Web 2.0 (Facebook, Blog, Wiki) shows that the highest percentage is 30% of the students' UTeM have been using Level C3 of applying and followed by 24% using Level C6 of creating. This shows that when students use the Web 2.0 activities such as face book, blog or wiki so they can carry out idea, implementing, sharing, uploading, and hacking. Beside that students can designing, constructing, planning, producing and publishing their information with this activities. Figure 3: Web 2.0 (Facebook, Blog, Wiki) 4. e-Portfolio 1 15 14 1 13 1 0 2 4 6 8 10 12 14 16 C1 C2 C3 C4 C5 C6 Quiz or Assessment Online 1 3 14 6 10 11 0 2 4 6 8 10 12 14 16 C1 C2 C3 C4 C5 C6 Web 2.0 (Facebook, Blog, Wiki, etc.)
- 3. Refer Figure 4: e-Portfolio shows that the highest percentage is 30% of the students' UTeM have been using Level C3 of applying and followed by 22% using Level C4 of analyzing. This indicates that the e-Portfolio activities students can using, implementing, comparing, organizing, deconstructing and fining their ideas to develop e-Portfolio. Figure 4: e-Portfolio 5. e-Mail Refer Figure 5: e-Mail shows that the highest percentage is 39% of the students' UTeM have been using Level C3 of applying and followed by 22% using Level C2 (analyzing) and C5 of evaluating. This indicates that the e-Mail activities students can using, implementing, checking, experimenting, testing, detecting and monitoring their information. Figure 5: e-Mail 6. Brainstorming 6 8 14 10 2 5 0 2 4 6 8 10 12 14 16 C1 C2 C3 C4 C5 C6 e-Portfolio 1 10 18 5 10 2 0 2 4 6 8 10 12 14 16 18 20 C1 C2 C3 C4 C5 C6 eMail
- 4. Refer to Figure 6: Brainstorming shows that the highest percentage is 39% of the students' UTeM have been using Level C4 of analyzing and followed by 20% using Level C2 of understanding. This shows that during the brainstorming activities the students' UTeM can interpreting, summarizing, explaining, comparing, organizing and integrating the answer. Figure 6: Brainstorming 7. Online Presentation Refer to Figure 7: Online Presentation shows that the highest percentage is 39% of the students' UTeM have been using Level C4 of analyzing and followed by 20% using Level C2 of understanding. This shows that during the online presentation activities the students' UTeM can interpret, summarizing, explaining, comparing, organizing and integrating their performance. Figure 7: Online Presentation 8. Peer Review 7 9 4 18 3 5 0 2 4 6 8 10 12 14 16 18 20 C1 C2 C3 C4 C5 C6 Brainstorming 7 9 4 18 3 5 0 2 4 6 8 10 12 14 16 18 20 C1 C2 C3 C4 C5 C6 Online Presentation
- 5. Figure 8: Peer Review shows that the highest percentage is 33% of the students' UTeM have been using Level C3 of applying and followed by 30% using Level C2 of understanding. This shows that students are able to interpret and explain the answers during peer review. Figure 8: Peer Review 9. Group Publishing Refer Figure 9: Group Publishing shows that the highest percentage is 24% of the students' UTeM have been using Level C3 of applying and C6 of creating followed by 22% using Level C2. This indicates that the group publishing activities students can using, implementing, checking, experimenting, testing, detecting and monitoring their information. Beside that students can design, constructing, planning, producing and publishing their information with this activities. Figure 9: Group Publishing 10. SCL Through Online 3 14 15 7 3 4 0 2 4 6 8 10 12 14 16 C1 C2 C3 C4 C5 C6 Peer Review 3 10 11 7 4 11 0 2 4 6 8 10 12 C1 C2 C3 C4 C5 C6 Group Publishing
- 6. Refer Figure 10: SCL Through Online shows that the highest percentage is 22% of the students' UTeM have been using Level C5 of evaluating and followed by 20% using Level C3 (applying) and C4 (analyzing). This indicates that the SCL activities the students can using, implementing, comparing, organizing, checking, and monitoring their information. 7 4 9 9 10 7 0 2 4 6 8 10 12 C1 C2 C3 C4 C5 C6 SCL Trough Online