Genpact VAI Feb 2013-July 2015: A snapshot of economic volatility across industries
•
1 like•687 views

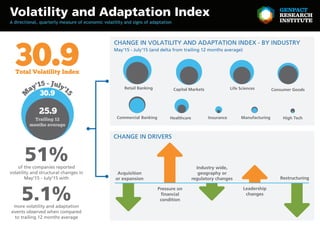
Banking and capital markets remained the most volatile during May – July 2015 because of changes in their leadership and financial pressures, which reflected on the VAI in comparison to the same last year.
Recommended

Recommended
More Related Content
More from Genpact Ltd
More from Genpact Ltd (20)
Recently uploaded
Recently uploaded (20)
Genpact VAI Feb 2013-July 2015: A snapshot of economic volatility across industries
- 1. Volatility and Adaptation Index 51% 5.1% Total Volatility Index 30.9 A directional, quarterly measure of economic volatility and signs of adaptation Retail Banking Commercial Banking Restructuring Leadership changes Pressure on financial condition Industry wide, geography or regulatory changes Acquisition or expansion Capital Markets High TechHealthcare Manufacturing Life Sciences Insurance Consumer Goods more volatility and adaptation events observed when compared to trailing 12 months average of the companies reported volatility and structural changes in May'15 - July'15 with CHANGE IN VOLATILITY AND ADAPTATION INDEX - BY INDUSTRY CHANGE IN DRIVERS May'15 - July'15 (and delta from trailing 12 months average) 30.9 25.9 M ay'15 - July'1 5 Trailing 12 months average