
Recommended
More Related Content
Similar to Market Segment Strategy and Program Analysis
Similar to Market Segment Strategy and Program Analysis (20)
Recently uploaded
Recently uploaded (20)
Market Segment Strategy and Program Analysis
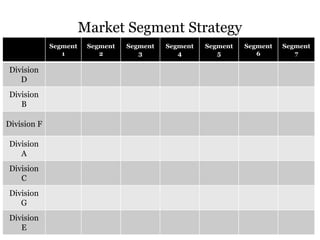
- 1. Market Segment Strategy Segment 1 Segment 2 Segment 3 Segment 4 Segment 5 Segment 6 Segment 7 Division D Division B Division F Division A Division C Division G Division E
- 2. Competition Record Sheet Program: Sponsor: Enrollments/Registrations: 2010 2011 2012 2013 2014 Events: Type & %: Gross Income: Average Fee: Percent of Existing Market: Participant Profile/Characteristics: Organizational Strengths: Organizational Weaknesses: Uniqueness, if any: Position/Image in Market:
- 3. Program/Product Mix Market Segment Strategy Segment 1 Segment 2 Segment 3 Segment 4 Segment 5 Segment 6 Segment 7 Division D Division B Division F Division A Division C Division G Division E
- 4. Community Cell Analysis East NE North Dwntn West South Rest 01 Crafts 200 1,000 0 100 0 500 0 02 Foreign 200 200 232 243 225 219 248 03 Computer 219 208 10 1,214 220 225 239 04 Business 451 567 678 789 890 901 654 05 Arts 98 987 876 765 765 543 432 06 Personal 1,123 345 678 456 789 936 825 07 Home 107 395 987 89 83 78 897 Total annual registrations: 22,886
- 5. CPE Cell Analysis Home ER School Nursing Ped. Factory Other 01 1-day $24 $123 $323 $123 $123 $123 $123 02 2-day $18 $123 $322 $123 $123 $123 $123 03 Weekend $234 $123 $321 $123 $123 $123 $123 04 Confs $897 $987 $0 $789 $999 $879 $0 05 8-week $9 $123 $320 $123 $123 $123 $123 06 4-day $12 $123 $324 $123 $123 $123 $123 07 Online $12 $123 $319 $123 $123 $123 $123
- 6. Session/Quarter Review Number of courses/events offered 125 Number of active courses/events 100 Number of registrations 1,000 Number of person enrolling 800 Number of courses/events per person 1.25 Number of persons in each course/event 10 Total income $24,000 Average income per person $30 Average income per registration $24 % of courses/events canceled 20% Amount of income refunded $1,000 Number of brochures distributed 10,000 Number of brochures per registration 10:1
- 7. Information Specialist Daily Report Calls 1) Total Calls for / / 2) Total Calls Into Voice Mail A. Contact Made % B. Contact Not Made % 3) Hours on Phone Reason for Call 1) Sale 2) Inquiry % 3) Pass On % 4) Question % 5) Complaint/Problem % Inquiry 1) Course % 2) Seminar % 3) Conference % 4) Instructor Information %
- 8. Promotion Analysis Worksheet Report Date: 2/20/13 Mailed: 12/7 & 29, 1/13 A. Promotion Catalog/Winter Term B. Printer TBI Printing C. Mailer TBI Printing D. Price of Item $15 - $125 Avg: $50 E. # of Promos 65,000 F. Costs 1) Printing $4,500 2) Mailing $950 3) Mailing List Rent $500 4) Postage $2,250 5) Other $800 – Distribution 6) Total Cost $9,000 G. Pieces Mailed 65,00 H. Responses 1) Number 1,350 Total 2) Dollars $67,500 Total I. Cost Per Piece F6/G 14¢ J. Break-even (F6/D) 180 K. Response Rate (H1/G) 48:1
- 9. Cost Analysis Form for Course Catalogs EVENT: Winter Catalog Income: Dollars Percentage From Registrations $67,500.00 95% From Materials $3,500.00 5% Total Income $71,000.00 100% Production Costs: Dollars Percentage Instructors $23,250.00 Space $2,000.00 Materials $1,500.00 Other $3,250.00 Total Production Costs $30,000.00 42% Promotion Costs Dollars Percentage Printing & Labeling $5,450.00 Rental & Postage $3,550.00 Total Promotion Costs $9,000.00 13% Summation: Dollars Percentage Total Income $71,000.00 100% Total Costs $39,000.00 55% Net Income $32,000.00 45%
- 10. Model Programmer Course Evaluation Form Course: Teacher: Programmer Evaluation. At the conclusion of the above course, the following information should be generated. A copy should be passed on to your supervisor, a copy should be put in the teacher’s file and a copy should be put in the course’s file. A. Student Evaluations 1. Overall, were you satisfied with the course? Yes: No: 2. Fill in your response to the following questions: 1 – very poor, 2 – needs improvement, 3 – okay, 4 – good, 5 - excellent Understood the subject matter. Was well prepared for each session. Made the goals and objectives clear at class. Stimulated discussion and group involvement Provided individual help when needed. 3. Comments. On a separate sheet of paper, list key comment on what participants liked about the class and improvements they suggested. 4. Testimonials. On a separate sheet of paper, list key testimonials along with the person’s name. Make sure to hold their evaluation form on file because it has their signature approving the use of their testimonial.
- 11. B. Teacher evaluation 1. Overall, were you satisfied with the course? Yes: No: 2. Fill in your response to the following questions: 1 – very poor, 2 – needs improvement, 3 – okay, 4 – good, 5 - excellent Was the organization’s staff helpful? Was your room prepared for your class? Did the learning environment meet your needs? Did the description clearly outline your course? Did your programmer give you feedback? 3. Comments. On a separate sheet of paper, list key comment on what teachers liked about the class and improvements they suggested. 4. Testimonials. On a separate sheet of paper, list key testimonials along with the teacher’s name. Make sure to hold their evaluation form on file because it has their signature approving the use of their testimonial. C. Performance Analysis 1. Price of the Course 2. Total Registrations 3. Total Withdrawals 4. Total Income (after withdrawals) 5. Total Cost of Promotion
- 12. * If there was additional promotion beyond the catalog listing, attach a copy to this evaluation. * To figure the promotional cost of a course in a catalog, divide the total cost of the catalog (desktop, printing, mail, etc.) by the number of courses. 6. Total Cost of Production (instructor fee, materials, space) 7. Total Direct Costs (5 + 6) 8. OperatingMargin (4 – 5 + 6) D. Half-Life: The number of weeks/days prior to the course when 50% of registrations were generated. E. Participant Analysis Report. On separate paper, break down the students’ demographics: Age, Sex, Geography, Education Level. F. Programmer Evaluation 1. Overall, were you satisfied with the course? 2. Rate the teacher on the Likert Scale (1 – 5) 3. What action steps would you take to improve this course?