SlideShare a Scribd company logo
1 of 5
Download to read offline
EXPORTACIONES DE PRODUCTOS LÁCTEOS
Kilos Netos FOB US$ Kilos Netos FOB US$ Kilos Netos FOB US$ Kilos Netos FOB US$ Kilos Netos FOB US$
1991 229.521 455.695 77 229 42.183 40.226 78.650 109.636 42.887 128.693
1992 80.914 172.210 302.590 333.280 370 597 117.736 352.400
1993 132.129 411.091 340.798 522.066 492 2.317 115.838 255.799
1994 240.162 840.798 410.307 731.249 215.761 419.134 100.488 232.652
1995 103.594 399.078 223 747 780.190 1.336.653 621.066 1.240.261 196.803 649.163
1996 326.167 1.019.054 132 468 180.615 331.477 898.557 998.892 123.592 442.568
1997 287.266 1.114.898 107 177 215.800 465.523 2.594.339 2.327.698 117.820 501.204
1998 1.127.243 3.258.545 350.000 706.055 2.810.113 2.278.948 600.524 1.124.943
1999 6.978.568 16.124.835 1.076.868 593.956 118.278 222.634 1.034.974 821.611 309.883 965.994
2000 7.976.225 19.617.125 4.136.332 2.153.293 200.783 312.603 52.867 80.713 1.122.048 3.586.538
2001 17.142.923 49.473.445 10.654.532 6.849.950 1.771.984 2.500.983 222.066 198.530 1.791.393 5.737.470
2002 15.135.139 35.639.375 9.970.059 5.162.010 713.064 1.149.330 307.298 219.335 1.514.910 4.510.533
2003 18.343.450 35.025.866 5.957.253 3.542.564 2.607.172 2.578.886 604.548 514.825 1.909.172 4.797.863
2004 11.763.395 26.238.476 5.548.170 3.540.572 130.845 208.853 538.819 616.371 3.169.958 9.037.063
2005 13.850.111 36.358.168 4.905.925 3.910.101 123.765 200.093 654.900 1.017.385 3.404.104 11.238.638
2006 10.100.383 28.796.870 267.273 276.275 234.581 528.076 692.643 1.123.649 4.124.254 16.858.534
2007 4.840.454 20.756.615 134.033 396.430 487.153 941.843 3.240.069 15.400.279
2008 7.306.586 35.309.697 165.889 518.867 208.400 644.934 501.613 921.975 2.266.056 13.867.267
2009 1.108.196 4.289.946 911 2.015 132.073 390.875 357.350 727.900 1.455.717 6.602.386
AÑO
QUESOSLECHE EN POLVO LECHE EVAPORADA LECHE CONCENTRADA YOGUR - LECHES ACIDAS
2010 1.718.087 5.242.578 29 194 107.110 325.630 374.205 662.559 2.289.850 4.353.898
2011 275.000 1.127.500 23.265 75.056 140.156 255.357 224.019 582.915
Kilos Netos FOB US$ Kilos Netos FOB US$ Kilos Netos FOB US$ Kilos Netos FOB US$
1991 820 8.930 8.440 26.308 23 202 402.601 769.919
1992 88.880 328.336 590.490 1.186.823
1993 1.196 13.842 1.000 3.387 223.705 504.937 815.158 1.713.439
1994 116.000 199.061 330.625 742.566 1.413.343 3.165.460
1995 2.500 14.040 26 238 362.267 753.632 2.066.669 4.393.812
1996 17.107 30.673 417.544 887.187 1.963.714 3.710.319
1997 7.575 42.123 1.326.341 1.573.722 4.549.248 6.025.345
1998 6.638 22.791 1.995.415 1.962.175 6.889.933 9.353.457
1999 202 114 1.853.479 2.162.123 11.372.252 20.891.267
2000 186.375 146.990 55.840 84.362 1.423.404 1.479.842 15.153.874 27.461.466
2001 40.949 44.404 178.358 309.452 2.568.320 2.370.121 34.370.525 67.484.355
2002 2.150.391 675.679 199.547 324.750 2.823.019 2.133.153 32.813.427 49.814.165
2003 1.904.599 585.922 453.390 664.173 4.100.639 1.797.173 35.880.223 49.507.272
2004 210.202 152.155 1.531.255 1.951.002 5.175.750 2.388.221 28.068.394 44.132.712
2005 1.382.784 642.171 406.110 583.025 6.948.742 4.242.668 31.676.441 58.192.249
2006 3.927.099 2.198.094 603.677 1.185.077 9.846.316 5.879.495 29.796.226 56.846.071
2007 2.312.994 1.037.876 294.855 763.796 8.096.209 6.365.430 19.405.767 45.662.269
2008 1.048.842 808.223 483.802 1.553.751 19.637.651 18.261.491 31.618.838 71.886.206
2009 2.000 4.600 109.016 270.180 12.380.317 12.307.908 15.545.581 24.595.809
2010 19.875 22.013 186.502 604.484 140.947 204.228 4.836.604 11.415.583
2011 75.000 307.500 74.509 100.556 811.949 2.448.884
Fuente: DANE
Cálculos: Oficina de Planeación FEDEGAN
AÑO
LACTOSUEROS MANTEQUILLAS LECHE LIQUIDA Total
EXPORTACIONES DE PRODUCTOS LÁCTEOS
Kilos Netos US$ FOB Kilos Netos US$ FOB Kilos Netos US$ FOB Kilos Netos US$ FOB Kilos Netos US$ FOB Kilos Netos US$ FOB
LACTOSUEROS 404101000 10.000 17.700
404109000 186.000 146.525 30.000 25.467 2.150.000 674.513 1.875.000 562.983 111 433 1.382.600 641.232
404900000 375 465 949 1.237 391 1.166 29.599 22.939 210.091 151.722 184 939
Total LACTOSUEROS 186.375 146.990 40.949 44.404 2.150.391 675.679 1.904.599 585.922 210.202 152.155 1.382.784 642.171
LECHE CONCENTRADA 402991000 195.982 306.332 1.771.042 2.500.466 695.726 1.136.840 1.741.705 2.268.434 126.956 205.874 123.165 197.431
402999000 4.801 6.271 942 517 17.338 12.490 865.467 310.452 3.889 2.979 600 2.662
Total LECHE CONCENTRADA 200.783 312.603 1.771.984 2.500.983 713.064 1.149.330 2.607.172 2.578.886 130.845 208.853 123.765 200.093
LECHE EN POLVO 402101000 1.185 4.473 1.967 10.663 1.574 5.665 1.194 4.007 5.234 27.343 7.582 43.836
402109000 166.077 431.920 332.745 928.484 205.557 452.837 80.651 171.391 871.663 1.595.551 1.139.041 2.775.729
402211100 210.605 517.833 3.603.312 11.247.521 2.731.011 7.740.562 2.731.617 5.986.277 3.045.519 6.888.685 2.313.469 5.432.670
402211900 6.898.124 17.052.679 13.202.270 37.284.588 12.193.618 27.438.703 15.526.045 28.854.908 7.840.980 17.726.898 10.300.019 27.858.201
402219100 3.776 7.507
402219900 230 214 633 770 120 315 142 315 90.000 247.732
402291100 2.473 431
402291900 700.004 1.610.006 1.996 1.419 540 451
402299100 25 1.461
402299900 246 411
402911000
402991000
402999000
Total LECHE EN POLVO 7.976.225 19.617.125 17.142.923 49.473.445 15.135.139 35.639.375 18.343.450 35.025.866 11.763.395 26.238.476 13.850.111 36.358.168
LECHE EVAPORADA 402911000 4.136.332 2.153.293 10.654.412 6.849.870 9.933.154 5.132.477 5.955.295 3.536.837 5.541.380 3.515.938 4.892.800 3.850.560
402919000 120 80 36.905 29.533 1.958 5.727 6.790 24.634 13.125 59.541
Total LECHE EVAPORADA 4.136.332 2.153.293 10.654.532 6.849.950 9.970.059 5.162.010 5.957.253 3.542.564 5.548.170 3.540.572 4.905.925 3.910.101
LECHE LIQUIDA 401100000 233.532 204.432 762.872 328.573 1.055.897 376.712 2.157.240 682.543 2.061.505 770.939 2.548.512 1.049.874
401200000 613.818 253.482 792.011 345.336 938.339 379.337 1.542.605 570.808 2.881.392 1.299.068 3.432.282 1.653.320
401300000 576.054 1.021.928 1.013.437 1.696.212 828.783 1.377.104 400.794 543.822 232.853 318.214 967.948 1.539.474
Total LECHE LIQUIDA 1.423.404 1.479.842 2.568.320 2.370.121 2.823.019 2.133.153 4.100.639 1.797.173 5.175.750 2.388.221 6.948.742 4.242.668
MANTEQUILLAS 405100000 55.840 84.362 177.211 308.049 196.497 313.393 453.367 664.138 1.529.210 1.945.662 402.561 572.054
405200000 967 1.353 2.300 8.646 419 138
405909000 180 50 750 2.711 23 35 1.626 5.202 3.549 10.971
Total MANTEQUILLAS 55.840 84.362 178.358 309.452 199.547 324.750 453.390 664.173 1.531.255 1.951.002 406.110 583.025
QUESOS 406100000 76.061 131.790 133.835 242.007 131.606 196.482 165.346 242.744 550.632 1.189.869 618.956 1.378.292
406200000 102.079 447.590 112.868 437.356 101.958 477.136 94.462 400.848 101.816 450.460 103.363 562.170
406300000 69.757 142.957 14.004 30.945 93 485 117.145 407.270 387.311 1.634.056 412.936 2.158.385
406400000
406901000 29.354 112.503 25.488 113.397 47.471 134.782 45.546 120.187 142.894 388.690
406902000 106.415 423.830 307.038 1.255.431 434.642 1.400.176 463.680 1.181.462 70.963 260.301
406903000 493.273 1.538.095 1.027.988 3.135.067 571.254 1.654.482 1.008.254 2.406.178 1.739.332 4.595.899
406904000 18.212 87.458
406905000 229.961 848.072
406906000 1.691.892 5.254.983
406909000 245.109 789.773 170.172 523.267 227.886 646.990 14.739 39.174 177.011 517.788 328.782 949.278
Total QUESOS 1.122.048 3.586.538 1.791.393 5.737.470 1.514.910 4.510.533 1.909.172 4.797.863 3.169.958 9.037.063 3.404.104 11.238.638
YOGUR - LECHES ACIDAS 403100000 23.696 31.542 110.990 88.100 206.968 155.920 472.552 371.757 473.594 526.870 614.470 927.965
403900000 29.171 49.171 111.076 110.430 100.330 63.415 131.996 143.068 65.225 89.501 40.430 89.421
Total YOGUR - LECHES ACIDAS 52.867 80.713 222.066 198.530 307.298 219.335 604.548 514.825 538.819 616.371 654.900 1.017.385
Total Exportado 15.153.874 27.461.466 34.370.525 67.484.355 32.813.427 49.814.165 35.880.223 49.507.272 28.068.394 44.132.712 31.676.441 58.192.249
TIPO NANDINA
2.000 2.001 2.002 2.003 2.004 2.005
EXPORTACIONES DE PRODUCTOS LÁCTEOS
Kilos Netos US$ FOB Kilos Netos US$ FOB Kilos Netos US$ FOB Kilos Netos US$ FOB Kilos Netos US$ FOB Kilos Netos US$ FOB
LACTOSUEROS 404101000 19.875 22.013
404109000 3.926.750 2.197.092 2.312.057 1.035.830 1.048.750 807.844 2.000 4.600
404900000 349 1.002 937 2.046 92 379
Total LACTOSUEROS 3.927.099 2.198.094 2.312.994 1.037.876 1.048.842 808.223 2.000 4.600 19.875 22.013
LECHE CONCENTRADA 402991000 232.702 518.467 133.752 395.721 207.839 642.739 131.015 387.420 103.295 317.015 22.613 72.816
402999000 1.879 9.608 281 709 562 2.196 1.058 3.455 3.815 8.615 652 2.240
Total LECHE CONCENTRADA 234.581 528.076 134.033 396.430 208.400 644.934 132.073 390.875 107.110 325.630 23.265 75.056
LECHE EN POLVO 402101000 787 4.160 1.695 10.807 301 316 1.439 17.332 596.966 1.783.936 25.000 102.500
402109000 2.117.779 5.844.879 253.894 726.335 395.026 2.155.187 38.006 105.501 2.298 13.633
402211100 375.617 1.102.960 71.940 284.289 1.321.390 6.143.964 249.638 761.621 408 1.122
402211900 7.606.200 21.844.871 4.152.900 18.164.724 5.439.744 26.146.127 775.260 3.285.034 1.117.001 3.438.026 250.000 1.025.000
402219100
402219900 360.000 1.570.200 150.000 863.100 6 39
402291100 24 260
402291900 708 2.950
402299100 125 1.004
402299900 310 1.201
402911000 1 3
402991000 42.447 114.872 1.260 5.387
402999000 382 1.392 154 475
Total LECHE EN POLVO 10.100.383 28.796.870 4.840.454 20.756.615 7.306.586 35.309.697 1.108.196 4.289.946 1.718.087 5.242.578 275.000 1.127.500
LECHE EVAPORADA 402911000 267.273 276.275 27 463 730 1.432 29 194
402919000 165.862 518.404 181 583
Total LECHE EVAPORADA 267.273 276.275 165.889 518.867 911 2.015 29 194
LECHE LIQUIDA 401100000 2.224.148 1.147.761 2.107.825 1.256.351 5.628.030 5.281.127 2.697.402 2.500.131 8.925 7.342
401200000 6.865.865 3.500.875 5.104.577 3.274.683 13.621.448 11.768.264 9.238.773 8.556.375 108.691 110.912 68.000 78.210
401300000 756.303 1.230.858 883.807 1.834.395 388.172 1.212.101 444.142 1.251.402 23.331 85.974 6.509 22.347
Total LECHE LIQUIDA 9.846.316 5.879.495 8.096.209 6.365.430 19.637.651 18.261.491 12.380.317 12.307.908 140.947 204.228 74.509 100.556
MANTEQUILLAS 405100000 603.527 1.184.704 294.617 762.056 482.773 1.549.552 101.048 240.162 175.453 565.861 75.000 307.500
405200000 10 34 965 3.939 7.968 30.017 11.049 38.623
405909000 140 340 237 1.740 64 260
Total MANTEQUILLAS 603.677 1.185.077 294.855 763.796 483.802 1.553.751 109.016 270.180 186.502 604.484 75.000 307.500
QUESOS 406100000 720.775 1.897.938 676.183 1.977.542 749.993 2.714.907 517.550 1.488.231 481.108 1.438.092 178.094 510.508
406200000 166.330 1.125.954 120.419 949.615 89.374 898.163 385.031 1.110.316 632.170 1.018.824 44.000 63.302
406300000 546.505 2.830.418 588.310 3.816.858 513.169 4.112.254 464.909 3.414.224 1.135.750 1.549.695
406400000 6 1 9 2 9 2
406901000
406902000
406903000
406904000 59.801 354.213 23.069 158.239 1.986 17.323 65 518 38.213 335.022
406905000 656.035 2.790.621 317.942 1.406.436 193.292 1.139.378 80.211 563.791 637 693 807 688
406906000 1.971.103 7.849.238 1.514.145 7.091.589 717.635 4.982.357 7.910 25.138 915 5.310 391 1.546
406909000 3.704 10.153 608 2.885 36 167 1.048 6.259 718 6.869
Total QUESOS 4.124.254 16.858.534 3.240.069 15.400.279 2.266.056 13.867.267 1.455.717 6.602.386 2.289.850 4.353.898 224.019 582.915
YOGUR - LECHES ACIDAS 403100000 686.542 1.105.646 487.153 941.843 501.613 921.975 357.350 727.900 374.205 662.559 140.156 255.357
403900000 6.100 18.003
Total YOGUR - LECHES ACIDAS 692.643 1.123.649 487.153 941.843 501.613 921.975 357.350 727.900 374.205 662.559 140.156 255.357
Total Exportado 29.796.226 56.846.071 19.405.767 45.662.269 31.618.838 71.886.206 15.545.581 24.595.809 4.836.604 11.415.583 811.949 2.448.884
Fuente: DANE
Cálculos: Oficina de Planeación FEDEGAN
2.009 2.010 I semestre 2011
TIPO NANDINA
2.006 2.007 2.008
EXPORTACIONES DE PRODUCTOS LÁCTEOS POR PAÍS DE DESTINO (Kilos Netos)
PAIS
I semestre
2011
2010 2009 2008 2007 2006 2005 2004 2003 2002 2001
República Dominicana 250.000 950.645 282.110 62.178 75.075 124.437
Estados Unidos 195.102 516.035 628.196 939.854 730.514 962.521 1.145.789 2.110.641 802.004 446.480 11.006
Ecuador 107.985 335.833 321.259 486.663 672.574 379.510 420.388 233.708 604.443 759.276 871.447
Taiwán, Provincia De China 75.000 25.000
Venezuela 59.575 1.842.688 13.117.044 29.366.952 16.895.864 26.948.254 29.051.037 24.480.818 31.059.612 29.026.439 33.082.541
Aruba 40.152 136.048 158.094 258.512 193.197 254.185 199.513 179.815 182.986 31.299 10.848
Haití 34.428 175.000 14.498 8.848 36.327 28.085 26.284 3.600
Trinidad y Tobago 28.140 5.326 16.730 120.778 190.286 246.146 280.609 330.011
Antillas Holandesas 14.984 61.842 127.491 346.241 515.060 496.572 327.049 296.414 33.040 4.610 6.726
Perú 6.509 376.634 49.116 11.393 94.356 314.102 390.466 354.289
Argentina 52 109 71 30
Canadá 10 35 346 334
Japón 5
Emiratos Árabes Unidos 5
Kuwait 3
Suecia 1 166
Suiza 235 1.425 200 245 82
Camerún 17.000
México 11 11 182
Dominica 2.590 11.730 7.892 4.151 8.233 1.920
Rusia, Federación De 4
Antigua y Barbuda 503 2.077 1.058 15.739 2.765 61
Zona Franca Cúcuta 124.000 90.000
España 36 10.000 120 632 925 69 24 2.591 257
No Declarados 25No Declarados 25
Bélgica y Luxemburgo 151 91
Reino Unido 312 350 1.005
Francia 76 59 67 75 186 174 199 91 49
Santo Tome y Príncipe 13.985
Georgia 50.000 870
Corea (Sur), Rep. De 47.925
Granada 6.714 6.294
Martinica 2.232 1.372
Guadalupe 2.787
Nicaragua 38 5 23 44 358 870
Guatemala 29.834 150
Panamá 816.040 320 135 8 141 303 31.766
Guayana Francesa 2.808 17.239 600
Puerto Rico 300 66 30
Guyana 3.061 2.110
Bangla Desh 225.000
Alemania 36 8.856 701 96 48
Santa Lucia 180.809 79.003 9.920
Holanda (Países Bajos) 10.480 17.839 15.000 126 25.866 712 648
Cuba 92 6.127 1.164 16 8 4
Singapur 12.925
Zona Franca Rionegro 210.000
Surinam 62 3.975 9.763 22.939 15.876 7.952 2.487 4.788
Angola
Chile 19.225 2.100 14.400 2.741.660 2.150.000
Australia 120 201
Bolivia 11.193 10.250 31.393 16.336 8.976
China 8
Marruecos 100.000
Italia 19
Bahamas 17.600
Jamaica 4.767
Total general 811.949 4.836.604 15.545.581 31.618.838 19.405.767 29.796.226 31.676.441 28.068.394 35.880.223 32.813.427 34.370.525
Fuente: DANE
Cálculos: Oficina de Planeación FEDEGAN
EXPORTACIONES DE PRODUCTOS LÁCTEOS POR PAÍS DE DESTINO (US$ FOB)
PAIS
I semestre
2011
2010 2009 2008 2007 2006 2005 2004 2003 2002 2001
República Dominicana 1.025.000 2.902.757 779.823 208.623 225.706 281.028
Estados Unidos 485.690 1.205.063 1.551.978 2.514.098 1.873.622 2.232.873 2.582.131 3.670.002 1.717.588 1.076.978 29.611
Taiwán, Provincia De China 307.500 95.000
Ecuador 233.008 925.102 687.959 1.406.809 1.253.639 860.983 776.413 351.116 741.679 1.181.171 1.518.444
Venezuela 120.245 3.046.395 20.075.343 66.733.910 41.420.489 52.361.882 54.221.700 39.283.217 45.347.336 46.303.487 65.362.760
Trinidad y Tobago 108.241 9.082 21.953 213.495 163.329 126.869 139.336 155.232
Aruba 65.583 209.190 256.443 322.687 197.860 184.503 126.488 107.881 99.778 26.336 10.053
Antillas Holandesas 42.559 118.500 208.425 382.322 429.632 292.298 173.263 192.451 24.248 4.935 10.829
Haití 38.486 511.250 16.970 4.868 26.481 23.306 16.621 1.950
Perú 22.347 1.167.948 169.625 69.540 110.171 501.141 538.034 498.805
Canadá 173 111 1.636 480
Suecia 21 124
Argentina 15 32 50 119
Japón 11
Emiratos Árabes Unidos 6
Kuwait 0
Chile 20.186 11.988 5.964 877.579 674.513
Bolivia 4.551 4.475 17.658 8.985 4.733
Cuba 222 6.984 1.568 32 172 37
Dominica 2.921 8.592 4.664 3.057 3.287 1.037
Rusia, Federación De 1
Angola
Bahamas 6.272Bahamas 6.272
España 60 11.520 960 3.132 2.736 576 115 982 1.086
No Declarados 63
Camerún 56.950
Reino Unido 1.303 1.045 3.510
Francia 372 322 524 551 818 770 637 650 228
Santo Tome y Príncipe 7.474
Georgia 147.500 856
Surinam 63 5.310 10.141 18.408 12.436 9.342 5.919 2.538
Granada 3.879 5.683
Zona Franca Cúcuta 352.408 166.059
Guadalupe 967
Nicaragua 162 44 146 41 1.132 1.942
Guatemala 24.518 246
Panamá 804.823 90 216 18 384 399 48.279
Guayana Francesa 1.408 6.925 306
Puerto Rico 900 336 124
Guyana 2.159 1.662
Antigua y Barbuda 3.367 3.178 1.500 13.821 6.984 165
Alemania 118 18.868 2.540 373 205
Santa Lucia 94.485 45.602 5.884
Holanda (Paises Bajos) 14.760 18.285 11.448 426 14.306 2.027 1.989
Singapur 19.724
Italia 25
Suiza 1.729 5.487 360 1.273 269
Jamaica 2.953
Australia 71 541
Bélgica y Luxemburgo 208 312
Bangla Desh 680.000
Marruecos 320.000
Zona Franca Rionegro 151.410
Corea (Sur), Rep. De 11.543
China 5
Martinica 2.786 489
México 23 100 22
Total General 2.448.884 11.415.583 24.595.809 71.886.206 45.662.269 56.846.071 58.192.249 44.132.712 49.507.272 49.814.165 67.484.355
Fuente: DANE
Cálculos: Oficina de Planeación FEDEGAN

More Related Content

What's hot

Tabla salarial docentes decreto 1278 de 2002 historico
Tabla salarial docentes decreto 1278 de 2002 historicoTabla salarial docentes decreto 1278 de 2002 historico
Tabla salarial docentes decreto 1278 de 2002 historicoCarlos Estrada
 
Keynote technicals intraday future levels for 260213
Keynote technicals intraday future levels for 260213Keynote technicals intraday future levels for 260213
Keynote technicals intraday future levels for 260213Keynote Capitals Ltd.
 
Keynote technicals intraday future levels for 130213
Keynote technicals intraday future levels for 130213Keynote technicals intraday future levels for 130213
Keynote technicals intraday future levels for 130213Keynote Capitals Ltd.
 
Keynote technicals intraday future levels for 210213
Keynote technicals   intraday future levels for 210213Keynote technicals   intraday future levels for 210213
Keynote technicals intraday future levels for 210213Keynote Capitals Ltd.
 
Keynote technicals intraday future levels for 140213
Keynote technicals intraday future levels for 140213Keynote technicals intraday future levels for 140213
Keynote technicals intraday future levels for 140213Keynote Capitals Ltd.
 
Keynote technicals intraday future levels for 010213
Keynote technicals intraday future levels for 010213Keynote technicals intraday future levels for 010213
Keynote technicals intraday future levels for 010213Keynote Capitals Ltd.
 
Keynote technical intraday future levels for 050313
Keynote technical intraday future levels for 050313Keynote technical intraday future levels for 050313
Keynote technical intraday future levels for 050313Keynote Capitals Ltd.
 
Keynote technicals intraday future levels for 150213
Keynote technicals intraday future levels for 150213Keynote technicals intraday future levels for 150213
Keynote technicals intraday future levels for 150213Keynote Capitals Ltd.
 
Keynote technicals intraday future levels for 180213
Keynote technicals intraday future levels for 180213Keynote technicals intraday future levels for 180213
Keynote technicals intraday future levels for 180213Keynote Capitals Ltd.
 
ventes de biens immobiliers
ventes de biens immobiliersventes de biens immobiliers
ventes de biens immobiliersGil Durand
 
Keynote technicals intraday future levels for 110213
Keynote technicals intraday future levels for 110213Keynote technicals intraday future levels for 110213
Keynote technicals intraday future levels for 110213Keynote Capitals Ltd.
 
Keynote technicals intraday future levels for 090113
Keynote technicals intraday future levels for 090113Keynote technicals intraday future levels for 090113
Keynote technicals intraday future levels for 090113Keynote Capitals Ltd.
 
Keynote technicals intraday future levels for 280213
Keynote technicals intraday future levels for 280213Keynote technicals intraday future levels for 280213
Keynote technicals intraday future levels for 280213Keynote Capitals Ltd.
 
Techos entidades territoriales 2015
Techos entidades territoriales 2015Techos entidades territoriales 2015
Techos entidades territoriales 2015Doctora Edilicia
 

What's hot (19)

GC-MC Report NN 2016
GC-MC Report NN 2016GC-MC Report NN 2016
GC-MC Report NN 2016
 
Tabla salarial docentes decreto 1278 de 2002 historico
Tabla salarial docentes decreto 1278 de 2002 historicoTabla salarial docentes decreto 1278 de 2002 historico
Tabla salarial docentes decreto 1278 de 2002 historico
 
Keynote technicals intraday future levels for 260213
Keynote technicals intraday future levels for 260213Keynote technicals intraday future levels for 260213
Keynote technicals intraday future levels for 260213
 
Keynote technicals intraday future levels for 130213
Keynote technicals intraday future levels for 130213Keynote technicals intraday future levels for 130213
Keynote technicals intraday future levels for 130213
 
Unach
UnachUnach
Unach
 
Keynote technicals intraday future levels for 210213
Keynote technicals   intraday future levels for 210213Keynote technicals   intraday future levels for 210213
Keynote technicals intraday future levels for 210213
 
Keynote technicals intraday future levels for 140213
Keynote technicals intraday future levels for 140213Keynote technicals intraday future levels for 140213
Keynote technicals intraday future levels for 140213
 
Keynote technicals intraday future levels for 010213
Keynote technicals intraday future levels for 010213Keynote technicals intraday future levels for 010213
Keynote technicals intraday future levels for 010213
 
Keynote technical intraday future levels for 050313
Keynote technical intraday future levels for 050313Keynote technical intraday future levels for 050313
Keynote technical intraday future levels for 050313
 
Keynote technicals intraday future levels for 150213
Keynote technicals intraday future levels for 150213Keynote technicals intraday future levels for 150213
Keynote technicals intraday future levels for 150213
 
Keynote technicals intraday future levels for 180213
Keynote technicals intraday future levels for 180213Keynote technicals intraday future levels for 180213
Keynote technicals intraday future levels for 180213
 
ventes de biens immobiliers
ventes de biens immobiliersventes de biens immobiliers
ventes de biens immobiliers
 
Keynote technicals intraday future levels for 110213
Keynote technicals intraday future levels for 110213Keynote technicals intraday future levels for 110213
Keynote technicals intraday future levels for 110213
 
FHC P VEGAS M 2017
FHC P VEGAS M 2017FHC P VEGAS M 2017
FHC P VEGAS M 2017
 
Keynote technicals intraday future levels for 090113
Keynote technicals intraday future levels for 090113Keynote technicals intraday future levels for 090113
Keynote technicals intraday future levels for 090113
 
Keynote technicals intraday future levels for 280213
Keynote technicals intraday future levels for 280213Keynote technicals intraday future levels for 280213
Keynote technicals intraday future levels for 280213
 
GC-MC Report NAS DIV 2016
GC-MC Report NAS DIV 2016GC-MC Report NAS DIV 2016
GC-MC Report NAS DIV 2016
 
Futurevaluetables
FuturevaluetablesFuturevaluetables
Futurevaluetables
 
Techos entidades territoriales 2015
Techos entidades territoriales 2015Techos entidades territoriales 2015
Techos entidades territoriales 2015
 

Similar to Fedegan_Estadisticas_Boletin_Comercio_Exterior_Leche_Exportacion

Ticker
TickerTicker
Tickeromel27
 
Fedegan_Estadistica_Boletin_Comercio_Exterior_Exportacion_Carne
Fedegan_Estadistica_Boletin_Comercio_Exterior_Exportacion_CarneFedegan_Estadistica_Boletin_Comercio_Exterior_Exportacion_Carne
Fedegan_Estadistica_Boletin_Comercio_Exterior_Exportacion_CarneFedegan
 
Cuadro diferencia 1 grado Plantas Municipales 2014
Cuadro diferencia 1 grado Plantas Municipales 2014Cuadro diferencia 1 grado Plantas Municipales 2014
Cuadro diferencia 1 grado Plantas Municipales 2014Nelson Leiva®
 
Present Value and Future Value Tables
Present Value and Future Value TablesPresent Value and Future Value Tables
Present Value and Future Value TablesAdilMohsunov1
 
Futurevaluetables
FuturevaluetablesFuturevaluetables
Futurevaluetablesdeepuz05
 
Tabla de comparacion pago de pmg 2020 completa
Tabla de comparacion pago de pmg 2020 completaTabla de comparacion pago de pmg 2020 completa
Tabla de comparacion pago de pmg 2020 completamarcosroa2
 
Tablas de interes_compuesto-1 copy
Tablas de interes_compuesto-1 copyTablas de interes_compuesto-1 copy
Tablas de interes_compuesto-1 copyYosemit Mendoza
 
Interest tables (Bảng tra tỷ lệ tính lãi suất)
Interest tables (Bảng tra tỷ lệ tính lãi suất)Interest tables (Bảng tra tỷ lệ tính lãi suất)
Interest tables (Bảng tra tỷ lệ tính lãi suất)Le Nguyen Truong Giang
 
Tablas de interes compuesto
Tablas de interes compuestoTablas de interes compuesto
Tablas de interes compuestoSAED7075419
 
Tabel nilai uang (FVIF,FVIFA, PVIF, PVIFA)
Tabel nilai uang (FVIF,FVIFA, PVIF, PVIFA)Tabel nilai uang (FVIF,FVIFA, PVIF, PVIFA)
Tabel nilai uang (FVIF,FVIFA, PVIF, PVIFA)Dayana Florencia
 
OdontoPrev ODPV3.BZ - 1Q12
OdontoPrev ODPV3.BZ - 1Q12OdontoPrev ODPV3.BZ - 1Q12
OdontoPrev ODPV3.BZ - 1Q12Rafael Marzocchi
 
Tabla salarial docentes decreto 1278 de 2002 historico
Tabla salarial docentes decreto 1278 de 2002 historicoTabla salarial docentes decreto 1278 de 2002 historico
Tabla salarial docentes decreto 1278 de 2002 historicoCarlos Estrada
 
Moyno pump 2000 dimensions g2
Moyno pump 2000 dimensions g2Moyno pump 2000 dimensions g2
Moyno pump 2000 dimensions g2NelsonBort
 

Similar to Fedegan_Estadisticas_Boletin_Comercio_Exterior_Leche_Exportacion (20)

Ticker
TickerTicker
Ticker
 
Fedegan_Estadistica_Boletin_Comercio_Exterior_Exportacion_Carne
Fedegan_Estadistica_Boletin_Comercio_Exterior_Exportacion_CarneFedegan_Estadistica_Boletin_Comercio_Exterior_Exportacion_Carne
Fedegan_Estadistica_Boletin_Comercio_Exterior_Exportacion_Carne
 
Cuadro diferencia 1 grado Plantas Municipales 2014
Cuadro diferencia 1 grado Plantas Municipales 2014Cuadro diferencia 1 grado Plantas Municipales 2014
Cuadro diferencia 1 grado Plantas Municipales 2014
 
8 fv&pv tables
8 fv&pv tables8 fv&pv tables
8 fv&pv tables
 
Present Value and Future Value Tables
Present Value and Future Value TablesPresent Value and Future Value Tables
Present Value and Future Value Tables
 
Futurevaluetables
FuturevaluetablesFuturevaluetables
Futurevaluetables
 
Steam tables
Steam tablesSteam tables
Steam tables
 
Eco dev final
Eco dev finalEco dev final
Eco dev final
 
Cedula de tuberias
Cedula de tuberiasCedula de tuberias
Cedula de tuberias
 
Tabla de comparacion pago de pmg 2020 completa
Tabla de comparacion pago de pmg 2020 completaTabla de comparacion pago de pmg 2020 completa
Tabla de comparacion pago de pmg 2020 completa
 
Tabel bunga
Tabel bungaTabel bunga
Tabel bunga
 
Tablas de interes_compuesto-1 copy
Tablas de interes_compuesto-1 copyTablas de interes_compuesto-1 copy
Tablas de interes_compuesto-1 copy
 
Interest tables (Bảng tra tỷ lệ tính lãi suất)
Interest tables (Bảng tra tỷ lệ tính lãi suất)Interest tables (Bảng tra tỷ lệ tính lãi suất)
Interest tables (Bảng tra tỷ lệ tính lãi suất)
 
Tablas de interes compuesto
Tablas de interes compuestoTablas de interes compuesto
Tablas de interes compuesto
 
Tabel bunga
Tabel bungaTabel bunga
Tabel bunga
 
Coparticipación 2014
Coparticipación 2014Coparticipación 2014
Coparticipación 2014
 
Tabel nilai uang (FVIF,FVIFA, PVIF, PVIFA)
Tabel nilai uang (FVIF,FVIFA, PVIF, PVIFA)Tabel nilai uang (FVIF,FVIFA, PVIF, PVIFA)
Tabel nilai uang (FVIF,FVIFA, PVIF, PVIFA)
 
OdontoPrev ODPV3.BZ - 1Q12
OdontoPrev ODPV3.BZ - 1Q12OdontoPrev ODPV3.BZ - 1Q12
OdontoPrev ODPV3.BZ - 1Q12
 
Tabla salarial docentes decreto 1278 de 2002 historico
Tabla salarial docentes decreto 1278 de 2002 historicoTabla salarial docentes decreto 1278 de 2002 historico
Tabla salarial docentes decreto 1278 de 2002 historico
 
Moyno pump 2000 dimensions g2
Moyno pump 2000 dimensions g2Moyno pump 2000 dimensions g2
Moyno pump 2000 dimensions g2
 

More from Fedegan

Carta Fedegan 151
Carta Fedegan 151Carta Fedegan 151
Carta Fedegan 151Fedegan
 
Carta Fedegan 150
Carta Fedegan 150Carta Fedegan 150
Carta Fedegan 150Fedegan
 
Carta Fedegan 149
Carta Fedegan 149Carta Fedegan 149
Carta Fedegan 149Fedegan
 
Cuadernos Ganaderos - Año 6 No. 12
Cuadernos Ganaderos - Año 6 No. 12Cuadernos Ganaderos - Año 6 No. 12
Cuadernos Ganaderos - Año 6 No. 12Fedegan
 
Carta Fedegan 148
Carta Fedegan 148Carta Fedegan 148
Carta Fedegan 148Fedegan
 
Carta fedegan147
Carta fedegan147Carta fedegan147
Carta fedegan147Fedegan
 
Carta fedegan 146
Carta fedegan 146Carta fedegan 146
Carta fedegan 146Fedegan
 
Coyuntura y perspectivas sector cárnico - marzo de 2015
Coyuntura y perspectivas sector cárnico - marzo de 2015Coyuntura y perspectivas sector cárnico - marzo de 2015
Coyuntura y perspectivas sector cárnico - marzo de 2015Fedegan
 
Coyuntura y perspectivas sector cárnico marzo 2015
Coyuntura y perspectivas sector cárnico marzo 2015Coyuntura y perspectivas sector cárnico marzo 2015
Coyuntura y perspectivas sector cárnico marzo 2015Fedegan
 
Carta Fedegan 145
Carta Fedegan 145Carta Fedegan 145
Carta Fedegan 145Fedegan
 
Cuaderno ganadero 11.final(baja)
Cuaderno ganadero 11.final(baja) Cuaderno ganadero 11.final(baja)
Cuaderno ganadero 11.final(baja) Fedegan
 
21 rotacion de praderas
21 rotacion de praderas21 rotacion de praderas
21 rotacion de praderasFedegan
 
20 modulo enfermedades infecciosas baja
20 modulo enfermedades infecciosas baja20 modulo enfermedades infecciosas baja
20 modulo enfermedades infecciosas bajaFedegan
 
Protocolos ruv
Protocolos ruvProtocolos ruv
Protocolos ruvFedegan
 
19 nutricion mineral
19 nutricion mineral19 nutricion mineral
19 nutricion mineralFedegan
 
18 calidad toro
18 calidad toro18 calidad toro
18 calidad toroFedegan
 
17 pastos especiesforrajeras
17 pastos especiesforrajeras17 pastos especiesforrajeras
17 pastos especiesforrajerasFedegan
 
16 monta estacional
16 monta estacional16 monta estacional
16 monta estacionalFedegan
 
14 manejo ganado
14 manejo ganado14 manejo ganado
14 manejo ganadoFedegan
 
13 mejoramiento genetico
13 mejoramiento genetico13 mejoramiento genetico
13 mejoramiento geneticoFedegan
 

More from Fedegan (20)

Carta Fedegan 151
Carta Fedegan 151Carta Fedegan 151
Carta Fedegan 151
 
Carta Fedegan 150
Carta Fedegan 150Carta Fedegan 150
Carta Fedegan 150
 
Carta Fedegan 149
Carta Fedegan 149Carta Fedegan 149
Carta Fedegan 149
 
Cuadernos Ganaderos - Año 6 No. 12
Cuadernos Ganaderos - Año 6 No. 12Cuadernos Ganaderos - Año 6 No. 12
Cuadernos Ganaderos - Año 6 No. 12
 
Carta Fedegan 148
Carta Fedegan 148Carta Fedegan 148
Carta Fedegan 148
 
Carta fedegan147
Carta fedegan147Carta fedegan147
Carta fedegan147
 
Carta fedegan 146
Carta fedegan 146Carta fedegan 146
Carta fedegan 146
 
Coyuntura y perspectivas sector cárnico - marzo de 2015
Coyuntura y perspectivas sector cárnico - marzo de 2015Coyuntura y perspectivas sector cárnico - marzo de 2015
Coyuntura y perspectivas sector cárnico - marzo de 2015
 
Coyuntura y perspectivas sector cárnico marzo 2015
Coyuntura y perspectivas sector cárnico marzo 2015Coyuntura y perspectivas sector cárnico marzo 2015
Coyuntura y perspectivas sector cárnico marzo 2015
 
Carta Fedegan 145
Carta Fedegan 145Carta Fedegan 145
Carta Fedegan 145
 
Cuaderno ganadero 11.final(baja)
Cuaderno ganadero 11.final(baja) Cuaderno ganadero 11.final(baja)
Cuaderno ganadero 11.final(baja)
 
21 rotacion de praderas
21 rotacion de praderas21 rotacion de praderas
21 rotacion de praderas
 
20 modulo enfermedades infecciosas baja
20 modulo enfermedades infecciosas baja20 modulo enfermedades infecciosas baja
20 modulo enfermedades infecciosas baja
 
Protocolos ruv
Protocolos ruvProtocolos ruv
Protocolos ruv
 
19 nutricion mineral
19 nutricion mineral19 nutricion mineral
19 nutricion mineral
 
18 calidad toro
18 calidad toro18 calidad toro
18 calidad toro
 
17 pastos especiesforrajeras
17 pastos especiesforrajeras17 pastos especiesforrajeras
17 pastos especiesforrajeras
 
16 monta estacional
16 monta estacional16 monta estacional
16 monta estacional
 
14 manejo ganado
14 manejo ganado14 manejo ganado
14 manejo ganado
 
13 mejoramiento genetico
13 mejoramiento genetico13 mejoramiento genetico
13 mejoramiento genetico
 

Fedegan_Estadisticas_Boletin_Comercio_Exterior_Leche_Exportacion

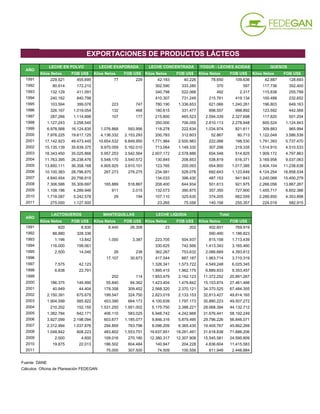
  • 1. EXPORTACIONES DE PRODUCTOS LÁCTEOS Kilos Netos FOB US$ Kilos Netos FOB US$ Kilos Netos FOB US$ Kilos Netos FOB US$ Kilos Netos FOB US$ 1991 229.521 455.695 77 229 42.183 40.226 78.650 109.636 42.887 128.693 1992 80.914 172.210 302.590 333.280 370 597 117.736 352.400 1993 132.129 411.091 340.798 522.066 492 2.317 115.838 255.799 1994 240.162 840.798 410.307 731.249 215.761 419.134 100.488 232.652 1995 103.594 399.078 223 747 780.190 1.336.653 621.066 1.240.261 196.803 649.163 1996 326.167 1.019.054 132 468 180.615 331.477 898.557 998.892 123.592 442.568 1997 287.266 1.114.898 107 177 215.800 465.523 2.594.339 2.327.698 117.820 501.204 1998 1.127.243 3.258.545 350.000 706.055 2.810.113 2.278.948 600.524 1.124.943 1999 6.978.568 16.124.835 1.076.868 593.956 118.278 222.634 1.034.974 821.611 309.883 965.994 2000 7.976.225 19.617.125 4.136.332 2.153.293 200.783 312.603 52.867 80.713 1.122.048 3.586.538 2001 17.142.923 49.473.445 10.654.532 6.849.950 1.771.984 2.500.983 222.066 198.530 1.791.393 5.737.470 2002 15.135.139 35.639.375 9.970.059 5.162.010 713.064 1.149.330 307.298 219.335 1.514.910 4.510.533 2003 18.343.450 35.025.866 5.957.253 3.542.564 2.607.172 2.578.886 604.548 514.825 1.909.172 4.797.863 2004 11.763.395 26.238.476 5.548.170 3.540.572 130.845 208.853 538.819 616.371 3.169.958 9.037.063 2005 13.850.111 36.358.168 4.905.925 3.910.101 123.765 200.093 654.900 1.017.385 3.404.104 11.238.638 2006 10.100.383 28.796.870 267.273 276.275 234.581 528.076 692.643 1.123.649 4.124.254 16.858.534 2007 4.840.454 20.756.615 134.033 396.430 487.153 941.843 3.240.069 15.400.279 2008 7.306.586 35.309.697 165.889 518.867 208.400 644.934 501.613 921.975 2.266.056 13.867.267 2009 1.108.196 4.289.946 911 2.015 132.073 390.875 357.350 727.900 1.455.717 6.602.386 AÑO QUESOSLECHE EN POLVO LECHE EVAPORADA LECHE CONCENTRADA YOGUR - LECHES ACIDAS 2010 1.718.087 5.242.578 29 194 107.110 325.630 374.205 662.559 2.289.850 4.353.898 2011 275.000 1.127.500 23.265 75.056 140.156 255.357 224.019 582.915 Kilos Netos FOB US$ Kilos Netos FOB US$ Kilos Netos FOB US$ Kilos Netos FOB US$ 1991 820 8.930 8.440 26.308 23 202 402.601 769.919 1992 88.880 328.336 590.490 1.186.823 1993 1.196 13.842 1.000 3.387 223.705 504.937 815.158 1.713.439 1994 116.000 199.061 330.625 742.566 1.413.343 3.165.460 1995 2.500 14.040 26 238 362.267 753.632 2.066.669 4.393.812 1996 17.107 30.673 417.544 887.187 1.963.714 3.710.319 1997 7.575 42.123 1.326.341 1.573.722 4.549.248 6.025.345 1998 6.638 22.791 1.995.415 1.962.175 6.889.933 9.353.457 1999 202 114 1.853.479 2.162.123 11.372.252 20.891.267 2000 186.375 146.990 55.840 84.362 1.423.404 1.479.842 15.153.874 27.461.466 2001 40.949 44.404 178.358 309.452 2.568.320 2.370.121 34.370.525 67.484.355 2002 2.150.391 675.679 199.547 324.750 2.823.019 2.133.153 32.813.427 49.814.165 2003 1.904.599 585.922 453.390 664.173 4.100.639 1.797.173 35.880.223 49.507.272 2004 210.202 152.155 1.531.255 1.951.002 5.175.750 2.388.221 28.068.394 44.132.712 2005 1.382.784 642.171 406.110 583.025 6.948.742 4.242.668 31.676.441 58.192.249 2006 3.927.099 2.198.094 603.677 1.185.077 9.846.316 5.879.495 29.796.226 56.846.071 2007 2.312.994 1.037.876 294.855 763.796 8.096.209 6.365.430 19.405.767 45.662.269 2008 1.048.842 808.223 483.802 1.553.751 19.637.651 18.261.491 31.618.838 71.886.206 2009 2.000 4.600 109.016 270.180 12.380.317 12.307.908 15.545.581 24.595.809 2010 19.875 22.013 186.502 604.484 140.947 204.228 4.836.604 11.415.583 2011 75.000 307.500 74.509 100.556 811.949 2.448.884 Fuente: DANE Cálculos: Oficina de Planeación FEDEGAN AÑO LACTOSUEROS MANTEQUILLAS LECHE LIQUIDA Total
  • 2. EXPORTACIONES DE PRODUCTOS LÁCTEOS Kilos Netos US$ FOB Kilos Netos US$ FOB Kilos Netos US$ FOB Kilos Netos US$ FOB Kilos Netos US$ FOB Kilos Netos US$ FOB LACTOSUEROS 404101000 10.000 17.700 404109000 186.000 146.525 30.000 25.467 2.150.000 674.513 1.875.000 562.983 111 433 1.382.600 641.232 404900000 375 465 949 1.237 391 1.166 29.599 22.939 210.091 151.722 184 939 Total LACTOSUEROS 186.375 146.990 40.949 44.404 2.150.391 675.679 1.904.599 585.922 210.202 152.155 1.382.784 642.171 LECHE CONCENTRADA 402991000 195.982 306.332 1.771.042 2.500.466 695.726 1.136.840 1.741.705 2.268.434 126.956 205.874 123.165 197.431 402999000 4.801 6.271 942 517 17.338 12.490 865.467 310.452 3.889 2.979 600 2.662 Total LECHE CONCENTRADA 200.783 312.603 1.771.984 2.500.983 713.064 1.149.330 2.607.172 2.578.886 130.845 208.853 123.765 200.093 LECHE EN POLVO 402101000 1.185 4.473 1.967 10.663 1.574 5.665 1.194 4.007 5.234 27.343 7.582 43.836 402109000 166.077 431.920 332.745 928.484 205.557 452.837 80.651 171.391 871.663 1.595.551 1.139.041 2.775.729 402211100 210.605 517.833 3.603.312 11.247.521 2.731.011 7.740.562 2.731.617 5.986.277 3.045.519 6.888.685 2.313.469 5.432.670 402211900 6.898.124 17.052.679 13.202.270 37.284.588 12.193.618 27.438.703 15.526.045 28.854.908 7.840.980 17.726.898 10.300.019 27.858.201 402219100 3.776 7.507 402219900 230 214 633 770 120 315 142 315 90.000 247.732 402291100 2.473 431 402291900 700.004 1.610.006 1.996 1.419 540 451 402299100 25 1.461 402299900 246 411 402911000 402991000 402999000 Total LECHE EN POLVO 7.976.225 19.617.125 17.142.923 49.473.445 15.135.139 35.639.375 18.343.450 35.025.866 11.763.395 26.238.476 13.850.111 36.358.168 LECHE EVAPORADA 402911000 4.136.332 2.153.293 10.654.412 6.849.870 9.933.154 5.132.477 5.955.295 3.536.837 5.541.380 3.515.938 4.892.800 3.850.560 402919000 120 80 36.905 29.533 1.958 5.727 6.790 24.634 13.125 59.541 Total LECHE EVAPORADA 4.136.332 2.153.293 10.654.532 6.849.950 9.970.059 5.162.010 5.957.253 3.542.564 5.548.170 3.540.572 4.905.925 3.910.101 LECHE LIQUIDA 401100000 233.532 204.432 762.872 328.573 1.055.897 376.712 2.157.240 682.543 2.061.505 770.939 2.548.512 1.049.874 401200000 613.818 253.482 792.011 345.336 938.339 379.337 1.542.605 570.808 2.881.392 1.299.068 3.432.282 1.653.320 401300000 576.054 1.021.928 1.013.437 1.696.212 828.783 1.377.104 400.794 543.822 232.853 318.214 967.948 1.539.474 Total LECHE LIQUIDA 1.423.404 1.479.842 2.568.320 2.370.121 2.823.019 2.133.153 4.100.639 1.797.173 5.175.750 2.388.221 6.948.742 4.242.668 MANTEQUILLAS 405100000 55.840 84.362 177.211 308.049 196.497 313.393 453.367 664.138 1.529.210 1.945.662 402.561 572.054 405200000 967 1.353 2.300 8.646 419 138 405909000 180 50 750 2.711 23 35 1.626 5.202 3.549 10.971 Total MANTEQUILLAS 55.840 84.362 178.358 309.452 199.547 324.750 453.390 664.173 1.531.255 1.951.002 406.110 583.025 QUESOS 406100000 76.061 131.790 133.835 242.007 131.606 196.482 165.346 242.744 550.632 1.189.869 618.956 1.378.292 406200000 102.079 447.590 112.868 437.356 101.958 477.136 94.462 400.848 101.816 450.460 103.363 562.170 406300000 69.757 142.957 14.004 30.945 93 485 117.145 407.270 387.311 1.634.056 412.936 2.158.385 406400000 406901000 29.354 112.503 25.488 113.397 47.471 134.782 45.546 120.187 142.894 388.690 406902000 106.415 423.830 307.038 1.255.431 434.642 1.400.176 463.680 1.181.462 70.963 260.301 406903000 493.273 1.538.095 1.027.988 3.135.067 571.254 1.654.482 1.008.254 2.406.178 1.739.332 4.595.899 406904000 18.212 87.458 406905000 229.961 848.072 406906000 1.691.892 5.254.983 406909000 245.109 789.773 170.172 523.267 227.886 646.990 14.739 39.174 177.011 517.788 328.782 949.278 Total QUESOS 1.122.048 3.586.538 1.791.393 5.737.470 1.514.910 4.510.533 1.909.172 4.797.863 3.169.958 9.037.063 3.404.104 11.238.638 YOGUR - LECHES ACIDAS 403100000 23.696 31.542 110.990 88.100 206.968 155.920 472.552 371.757 473.594 526.870 614.470 927.965 403900000 29.171 49.171 111.076 110.430 100.330 63.415 131.996 143.068 65.225 89.501 40.430 89.421 Total YOGUR - LECHES ACIDAS 52.867 80.713 222.066 198.530 307.298 219.335 604.548 514.825 538.819 616.371 654.900 1.017.385 Total Exportado 15.153.874 27.461.466 34.370.525 67.484.355 32.813.427 49.814.165 35.880.223 49.507.272 28.068.394 44.132.712 31.676.441 58.192.249 TIPO NANDINA 2.000 2.001 2.002 2.003 2.004 2.005
  • 3. EXPORTACIONES DE PRODUCTOS LÁCTEOS Kilos Netos US$ FOB Kilos Netos US$ FOB Kilos Netos US$ FOB Kilos Netos US$ FOB Kilos Netos US$ FOB Kilos Netos US$ FOB LACTOSUEROS 404101000 19.875 22.013 404109000 3.926.750 2.197.092 2.312.057 1.035.830 1.048.750 807.844 2.000 4.600 404900000 349 1.002 937 2.046 92 379 Total LACTOSUEROS 3.927.099 2.198.094 2.312.994 1.037.876 1.048.842 808.223 2.000 4.600 19.875 22.013 LECHE CONCENTRADA 402991000 232.702 518.467 133.752 395.721 207.839 642.739 131.015 387.420 103.295 317.015 22.613 72.816 402999000 1.879 9.608 281 709 562 2.196 1.058 3.455 3.815 8.615 652 2.240 Total LECHE CONCENTRADA 234.581 528.076 134.033 396.430 208.400 644.934 132.073 390.875 107.110 325.630 23.265 75.056 LECHE EN POLVO 402101000 787 4.160 1.695 10.807 301 316 1.439 17.332 596.966 1.783.936 25.000 102.500 402109000 2.117.779 5.844.879 253.894 726.335 395.026 2.155.187 38.006 105.501 2.298 13.633 402211100 375.617 1.102.960 71.940 284.289 1.321.390 6.143.964 249.638 761.621 408 1.122 402211900 7.606.200 21.844.871 4.152.900 18.164.724 5.439.744 26.146.127 775.260 3.285.034 1.117.001 3.438.026 250.000 1.025.000 402219100 402219900 360.000 1.570.200 150.000 863.100 6 39 402291100 24 260 402291900 708 2.950 402299100 125 1.004 402299900 310 1.201 402911000 1 3 402991000 42.447 114.872 1.260 5.387 402999000 382 1.392 154 475 Total LECHE EN POLVO 10.100.383 28.796.870 4.840.454 20.756.615 7.306.586 35.309.697 1.108.196 4.289.946 1.718.087 5.242.578 275.000 1.127.500 LECHE EVAPORADA 402911000 267.273 276.275 27 463 730 1.432 29 194 402919000 165.862 518.404 181 583 Total LECHE EVAPORADA 267.273 276.275 165.889 518.867 911 2.015 29 194 LECHE LIQUIDA 401100000 2.224.148 1.147.761 2.107.825 1.256.351 5.628.030 5.281.127 2.697.402 2.500.131 8.925 7.342 401200000 6.865.865 3.500.875 5.104.577 3.274.683 13.621.448 11.768.264 9.238.773 8.556.375 108.691 110.912 68.000 78.210 401300000 756.303 1.230.858 883.807 1.834.395 388.172 1.212.101 444.142 1.251.402 23.331 85.974 6.509 22.347 Total LECHE LIQUIDA 9.846.316 5.879.495 8.096.209 6.365.430 19.637.651 18.261.491 12.380.317 12.307.908 140.947 204.228 74.509 100.556 MANTEQUILLAS 405100000 603.527 1.184.704 294.617 762.056 482.773 1.549.552 101.048 240.162 175.453 565.861 75.000 307.500 405200000 10 34 965 3.939 7.968 30.017 11.049 38.623 405909000 140 340 237 1.740 64 260 Total MANTEQUILLAS 603.677 1.185.077 294.855 763.796 483.802 1.553.751 109.016 270.180 186.502 604.484 75.000 307.500 QUESOS 406100000 720.775 1.897.938 676.183 1.977.542 749.993 2.714.907 517.550 1.488.231 481.108 1.438.092 178.094 510.508 406200000 166.330 1.125.954 120.419 949.615 89.374 898.163 385.031 1.110.316 632.170 1.018.824 44.000 63.302 406300000 546.505 2.830.418 588.310 3.816.858 513.169 4.112.254 464.909 3.414.224 1.135.750 1.549.695 406400000 6 1 9 2 9 2 406901000 406902000 406903000 406904000 59.801 354.213 23.069 158.239 1.986 17.323 65 518 38.213 335.022 406905000 656.035 2.790.621 317.942 1.406.436 193.292 1.139.378 80.211 563.791 637 693 807 688 406906000 1.971.103 7.849.238 1.514.145 7.091.589 717.635 4.982.357 7.910 25.138 915 5.310 391 1.546 406909000 3.704 10.153 608 2.885 36 167 1.048 6.259 718 6.869 Total QUESOS 4.124.254 16.858.534 3.240.069 15.400.279 2.266.056 13.867.267 1.455.717 6.602.386 2.289.850 4.353.898 224.019 582.915 YOGUR - LECHES ACIDAS 403100000 686.542 1.105.646 487.153 941.843 501.613 921.975 357.350 727.900 374.205 662.559 140.156 255.357 403900000 6.100 18.003 Total YOGUR - LECHES ACIDAS 692.643 1.123.649 487.153 941.843 501.613 921.975 357.350 727.900 374.205 662.559 140.156 255.357 Total Exportado 29.796.226 56.846.071 19.405.767 45.662.269 31.618.838 71.886.206 15.545.581 24.595.809 4.836.604 11.415.583 811.949 2.448.884 Fuente: DANE Cálculos: Oficina de Planeación FEDEGAN 2.009 2.010 I semestre 2011 TIPO NANDINA 2.006 2.007 2.008
  • 4. EXPORTACIONES DE PRODUCTOS LÁCTEOS POR PAÍS DE DESTINO (Kilos Netos) PAIS I semestre 2011 2010 2009 2008 2007 2006 2005 2004 2003 2002 2001 República Dominicana 250.000 950.645 282.110 62.178 75.075 124.437 Estados Unidos 195.102 516.035 628.196 939.854 730.514 962.521 1.145.789 2.110.641 802.004 446.480 11.006 Ecuador 107.985 335.833 321.259 486.663 672.574 379.510 420.388 233.708 604.443 759.276 871.447 Taiwán, Provincia De China 75.000 25.000 Venezuela 59.575 1.842.688 13.117.044 29.366.952 16.895.864 26.948.254 29.051.037 24.480.818 31.059.612 29.026.439 33.082.541 Aruba 40.152 136.048 158.094 258.512 193.197 254.185 199.513 179.815 182.986 31.299 10.848 Haití 34.428 175.000 14.498 8.848 36.327 28.085 26.284 3.600 Trinidad y Tobago 28.140 5.326 16.730 120.778 190.286 246.146 280.609 330.011 Antillas Holandesas 14.984 61.842 127.491 346.241 515.060 496.572 327.049 296.414 33.040 4.610 6.726 Perú 6.509 376.634 49.116 11.393 94.356 314.102 390.466 354.289 Argentina 52 109 71 30 Canadá 10 35 346 334 Japón 5 Emiratos Árabes Unidos 5 Kuwait 3 Suecia 1 166 Suiza 235 1.425 200 245 82 Camerún 17.000 México 11 11 182 Dominica 2.590 11.730 7.892 4.151 8.233 1.920 Rusia, Federación De 4 Antigua y Barbuda 503 2.077 1.058 15.739 2.765 61 Zona Franca Cúcuta 124.000 90.000 España 36 10.000 120 632 925 69 24 2.591 257 No Declarados 25No Declarados 25 Bélgica y Luxemburgo 151 91 Reino Unido 312 350 1.005 Francia 76 59 67 75 186 174 199 91 49 Santo Tome y Príncipe 13.985 Georgia 50.000 870 Corea (Sur), Rep. De 47.925 Granada 6.714 6.294 Martinica 2.232 1.372 Guadalupe 2.787 Nicaragua 38 5 23 44 358 870 Guatemala 29.834 150 Panamá 816.040 320 135 8 141 303 31.766 Guayana Francesa 2.808 17.239 600 Puerto Rico 300 66 30 Guyana 3.061 2.110 Bangla Desh 225.000 Alemania 36 8.856 701 96 48 Santa Lucia 180.809 79.003 9.920 Holanda (Países Bajos) 10.480 17.839 15.000 126 25.866 712 648 Cuba 92 6.127 1.164 16 8 4 Singapur 12.925 Zona Franca Rionegro 210.000 Surinam 62 3.975 9.763 22.939 15.876 7.952 2.487 4.788 Angola Chile 19.225 2.100 14.400 2.741.660 2.150.000 Australia 120 201 Bolivia 11.193 10.250 31.393 16.336 8.976 China 8 Marruecos 100.000 Italia 19 Bahamas 17.600 Jamaica 4.767 Total general 811.949 4.836.604 15.545.581 31.618.838 19.405.767 29.796.226 31.676.441 28.068.394 35.880.223 32.813.427 34.370.525 Fuente: DANE Cálculos: Oficina de Planeación FEDEGAN
  • 5. EXPORTACIONES DE PRODUCTOS LÁCTEOS POR PAÍS DE DESTINO (US$ FOB) PAIS I semestre 2011 2010 2009 2008 2007 2006 2005 2004 2003 2002 2001 República Dominicana 1.025.000 2.902.757 779.823 208.623 225.706 281.028 Estados Unidos 485.690 1.205.063 1.551.978 2.514.098 1.873.622 2.232.873 2.582.131 3.670.002 1.717.588 1.076.978 29.611 Taiwán, Provincia De China 307.500 95.000 Ecuador 233.008 925.102 687.959 1.406.809 1.253.639 860.983 776.413 351.116 741.679 1.181.171 1.518.444 Venezuela 120.245 3.046.395 20.075.343 66.733.910 41.420.489 52.361.882 54.221.700 39.283.217 45.347.336 46.303.487 65.362.760 Trinidad y Tobago 108.241 9.082 21.953 213.495 163.329 126.869 139.336 155.232 Aruba 65.583 209.190 256.443 322.687 197.860 184.503 126.488 107.881 99.778 26.336 10.053 Antillas Holandesas 42.559 118.500 208.425 382.322 429.632 292.298 173.263 192.451 24.248 4.935 10.829 Haití 38.486 511.250 16.970 4.868 26.481 23.306 16.621 1.950 Perú 22.347 1.167.948 169.625 69.540 110.171 501.141 538.034 498.805 Canadá 173 111 1.636 480 Suecia 21 124 Argentina 15 32 50 119 Japón 11 Emiratos Árabes Unidos 6 Kuwait 0 Chile 20.186 11.988 5.964 877.579 674.513 Bolivia 4.551 4.475 17.658 8.985 4.733 Cuba 222 6.984 1.568 32 172 37 Dominica 2.921 8.592 4.664 3.057 3.287 1.037 Rusia, Federación De 1 Angola Bahamas 6.272Bahamas 6.272 España 60 11.520 960 3.132 2.736 576 115 982 1.086 No Declarados 63 Camerún 56.950 Reino Unido 1.303 1.045 3.510 Francia 372 322 524 551 818 770 637 650 228 Santo Tome y Príncipe 7.474 Georgia 147.500 856 Surinam 63 5.310 10.141 18.408 12.436 9.342 5.919 2.538 Granada 3.879 5.683 Zona Franca Cúcuta 352.408 166.059 Guadalupe 967 Nicaragua 162 44 146 41 1.132 1.942 Guatemala 24.518 246 Panamá 804.823 90 216 18 384 399 48.279 Guayana Francesa 1.408 6.925 306 Puerto Rico 900 336 124 Guyana 2.159 1.662 Antigua y Barbuda 3.367 3.178 1.500 13.821 6.984 165 Alemania 118 18.868 2.540 373 205 Santa Lucia 94.485 45.602 5.884 Holanda (Paises Bajos) 14.760 18.285 11.448 426 14.306 2.027 1.989 Singapur 19.724 Italia 25 Suiza 1.729 5.487 360 1.273 269 Jamaica 2.953 Australia 71 541 Bélgica y Luxemburgo 208 312 Bangla Desh 680.000 Marruecos 320.000 Zona Franca Rionegro 151.410 Corea (Sur), Rep. De 11.543 China 5 Martinica 2.786 489 México 23 100 22 Total General 2.448.884 11.415.583 24.595.809 71.886.206 45.662.269 56.846.071 58.192.249 44.132.712 49.507.272 49.814.165 67.484.355 Fuente: DANE Cálculos: Oficina de Planeación FEDEGAN