Hey Big Spender, We're Talking to You: Understand How to Budget for Social Media Marketing Efforts

What is a good ROI from my Google Spend? How much should I spend on social this year? Should I spend money on Facebook and Instagram ads and how much should I put in? It’s every marketer's favorite time of the year – budgeting . Setting a marketing budget is tricky enough for some businesses, let alone understanding how much should be spent on digital vs. offline. If you need to establish a marketing budget to hit a particular revenue and profit goal, you can use a budgeting formula based on ROI to work toward measurable results that directly impact the bottom line. This session will give you a better understanding of how much your budget should be and how you can make better sense of where you should be spending proactively and reactively. You’ll learn: Principles of ad budgeting How to plan a budget-efficient strategy Best practice tactics to optimize your social media budget Watch On-Demand: https://www.falcon.io/cmp/roi-resources/

Recommended
Recommended
More Related Content
What's hot
What's hot (20)
Similar to Hey Big Spender, We're Talking to You: Understand How to Budget for Social Media Marketing Efforts
Similar to Hey Big Spender, We're Talking to You: Understand How to Budget for Social Media Marketing Efforts (20)
More from Falcon.io
More from Falcon.io (20)
Recently uploaded
Recently uploaded (20)
Hey Big Spender, We're Talking to You: Understand How to Budget for Social Media Marketing Efforts
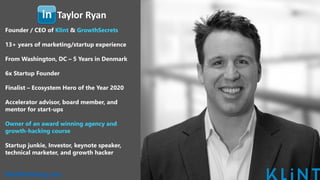
- 1. Taylor Ryan Founder / CEO of Klint & GrowthSecrets 13+ years of marketing/startup experience From Washington, DC – 5 Years in Denmark 6x Startup Founder Finalist – Ecosystem Hero of the Year 2020 Accelerator advisor, board member, and mentor for start-ups Owner of an award winning agency and growth-hacking course Startup junkie, Investor, keynote speaker, technical marketer, and growth hacker KlintMarketing.com
- 2. Taylor Ryan 4 Exits – (1 IPO, 2 Acquisitions, 1 Merger) Running teams of 15 – 30 at a time Startup Accelerators and Innovation Workshops Bulletproof tech stacks resulting in 10X ROI and Endless Leads Helped Startups into Y Combinator + Accelerators + Investment Connect with me on LinkedIn for the slides!
- 3. Growth-Hacking and Digital Marketing Agency.
- 4. Growth-Hacking and Digital Marketing.
- 6. My Goal for Today? Provide Value
- 7. Why are you here?
- 8. Covering a lot of Ground! Marketing Department Budgets Digital Ads Budgets Best Digital Ad Channels Predictable ROI Forecasting Minimal Budgets Influencer Marketing Budgets
- 9. Before we start… Can we agree on some stuff?
- 10. Every Industry is Different
- 11. Every Product and Service are Different
- 12. Every Business Model is Different Community P2P (peer-to-peer) Business Model Online & Offline community Online research community Social Network / Communities Subscription model Crowd funding Shared Economy Community App Online courses (P2P) B2C Consumer Goods Subscription Tiered Subscription E-commerce Box of the Month (subscription) Quantified Self Sharing Economy (B2B) “The Internet of Me” Ecommerce blended with app Online service (app) Quantified Self “The Internet of Me” App (subscripton) Online service (app) + Offline product (device) Personalization Freemium [Saas / Membership Fee] DATA Big-Data Selling (Big) Data Data Model B2B2C Product-Service combination Ads / Aggregator Affiliate System B2B Professional Network / Community Broker Mode SaaS Subscription model Online Classes (B2B) Non-Profit / Sustainability 3rd World Targeting Combination profit and nonprofit Public Service Healthcare 2.0 Quantified Self (Trackers) Data-Driven Personalized Medicine Subscription (Health + Care) On-Demand Service (Doctors) Telehealth Platform Hardware Wearables Hardware and Software
- 13. Every Target Audience is Different
- 14. Every Digital Ads Platform Is Different Each has a Different, Audience, Features, Pricing, and Use Cases
- 15. Every Offer and Conversion Are Different
- 16. Therefore Every Funnel Is Different
- 17. A Few More Things Save Time Where You Can… You Don’t Have To Build Everything From Zero…
- 18. Mapping YOUR Userflow SAVES Tons of Time I’ve mapped out hundreds of funnels… • Compliance • Defining the steps to the sale + Dropoff Percentages
- 19. There Are LOTS of Ad Spend Calculators You Don’t Need to Create These From Scratch
- 20. Use Industry and Channel Averages Get a baseline - Average CPM, CPC, CTR, CVR, CPA, CAC
- 21. You Can Measure POSITIVE ROI From PAID Social Media Thousands of case studies.. 10X Revenue IS Possible Source 1 / Source
- 22. Big Picture - Marketing Budgets
- 23. Total Marketing Budget What Percentage of the Total Company Yearly Revenue Should Be Allocated to Marketing???
- 24. Total Revenue Should be be Spent on Marketing Every Business Model, Industry, and Company Will Be Different (5% - 40%) • Saas Startups (Saastr) – 35-40% • Saas (Gartner) – 10 – 13% • Average Company (The CMO Survey 2021 - Deloitte) 11.7% • B2B 10-11% • B2C 14-15.5% • Business under $5M (US Small Business Administration) 7 – 8% • All Companies in Industries (Gartner) 6.4% • Canadian B2C (BDC.ca) 5 – 10% Source
- 25. Marketing Budget Based On Percentage of Total Revenue
- 28. Total Budget for Digital Ads Only What Percentage of the Marketing Budget Should Be Allocated to Digital Ads???
- 29. Marketing has a lot of moving parts… Paid Digital Advertising • Digital Ads Creation, Management, Optimization • Search, Display, Social, Influencers • Monthly Media Spend Content: • Blogs, Ebooks, Social Media, Guest posts, Video • Graphic design, Feature images, Product / Screenshots PR • Small, Mid-Tier, Top Tier Publishers, • Amplification, Press releases, Media Kit Web • New Website, Landing Pages, Speed, Optimization • Forms, Product Marketing, Integrations, Scraping Email Marketing: • Outbound, Inbound, Newsletters, Sales, Product • Segmentation, AB testing, Optimization, scheduling Events • Webinars, Tradeshows & Expos • Affiliate / Referral Programs Marketing Software & Tools • Inbound, Outbound, Project Management • SEO and Optimization Tools • Premium Content Creation Tools • Data Enrichment and Analysis Tools Team / Salaries • Team Management, Designer, Content Writer • SoMe, Web Developers, Videographer, Growth Hacker Affiliate / Partners Management of affiliate networks, Referral campaigns, Monitoring Other • Agency / Freelancer • Web / Landing Pages • Computers, Equipment, Visual Assets • Training • Traditional - Print ads, TV or Radio commercials [ ]
- 30. Average Total Marketing Budget Breakdown 72.2% of marketing’s budget is spent on pure digital channels (Gartner) *Remember, these numbers will vary MASSIVELY by industry Also who the hell has time to answer industry surveys???
- 31. Choosing The Right Paid Digital Channels
- 32. Paid Digital Channels Which Digital Ads Channel Is the Best?
- 33. …Best For What? …Who do you want to reach?
- 34. Remember… Every Business Model, Product, Etc is Different Lots of Variables: Industries, Products, Business Models, Audience(s), Intent, Types of Ads + + + + = Lots of Possibilities
- 35. Basic Marketing Funnel • Simpler Funnel = More Conversions • More Steps = Less Conversions • Build Campaigns for each step of the funnel • Conversion Rate Optimization [CRO]
- 36. B2B: Networks + Types of Ads Awareness Interest Decision Action Landing Page, Lead Ads Remarketing / Retargeting Search Ads, Display Ads, Intent Targeted Ads / Custom Audiences
- 37. B2C: Digital Ads + Networks Awareness Interest Decision Action Landing Page, Marketplace, App Store Remarketing / Retargeting Search Ads, Display Ads, Intent Buyer Persona Targeting = Audience Building
- 38. Conflicting Advice Everywhere Example #1 • 20% Audience Building • 20% Re-Targeting • 60% Offers / Promotion Example #2 • 60% Audience Building • 18% Re-Targeting • 19% Offers / Promotion • 3% Retention
- 39. If you’re starting out… Honestly, just hire Klint to do the work- we’ll do it for you Win On 1-2 Channels First Get it right before blowing the budget: • Targeting • Intent • Visual / Copy are HUGE • Play With Different Offers
- 40. Focus On Conversion Rate Optimization [CRO] Increase CVR By Optimizing the Each Step of the User Journey Clearer Page Copy: • Clear Headlines and CTA’s • Persuasive • Landing Page Tailored Specifically For Ad • Add Trust Signals • Add Risk Reversal • Add Confidence - Support or Returns • Easy to Understand Pricing UX: • Good Navigation • Filtering and Sorting • Fast Site Speed • Simplicity • Responsive • High Rez Product Images Checkout • Less Form Fields • Least Amount of Steps As Possible • Simple Checkout • Pricing Psychology • Exit Intent Popup • Abandon Cart Email And Much More! We should just have a meeting… KlintMarketing.com
- 41. Growth-Hacking and Digital Marketing Agency.
- 42. Predictable Revenue With Funnel Data
- 43. B2B: Saas Funnel Forecasting Ad Click – Click Through Rate (CTR) = 0.7% Landing Page Conversion (CVR) = 2.35% Marketing Qualified Lead (MQL) = 39% Sales Qualified Lead (SQL)= 38% Opportunity= 42% Deal Won= 37% Define The Metrics of Each Step of the Funnel + Channel *Metrics will vary by industry Traffic to Landing Page: 100%
- 44. B2B: Saas Funnel Forecasting Ad Click – Click Through Rate (CTR) = 5% [1500] Landing Page Conversion (CVR) = 2.35% [37.5] Marketing Qualified Lead (MQL) = 39% [14.6] Sales Qualified Lead (SQL)= 55% [8.04] Opportunity= 42% [3.38] Deal Won= 37% [1.25] Define The Metrics of Each Step of the Funnel + Channel *Metrics will vary by industry Total Impressions of ad Campaign on Specific Channel = 100% [10.000]
- 45. B2C: Mobile App Funnel Forecasting Facebook Ad Click – Click Through Rate = 100% Visit App Store = 95% Download and Install = 70% App Launch = 65% Start Registration = 40% Complete Registration= 30% Remember you will lose users at each step of the funnel Metrics will vary by industry Add Product to Cart = 12% Begin Checkout= 4.8% Complete Checkout= 1.77%
- 46. B2C: Mobile App Funnel Forecasting Facebook Ad Click – Click Through Rate = 100% [10.000] Visit App Store = 95% [9500] Download and Install = 70% [6650] App Launch = 65% [4322.5] Start Registration = 40% [1729] Complete Registration= 30% [518.7] Remember you will lose users at each step of the funnel Metrics will vary by industry Add Product to Cart = 12% [62.24] Begin Checkout= 4.8% [2.99] Complete Checkout= 45% [1.34]
- 48. Cost Per Impression Cost Per 1000 Impressions (CPM)= Total Campaign Spend Total Number of Impression x 1000 Tofu / Audience Building / Awareness Facebook AVG: $7.19 (Source) Google Ads: $38.40 (Source) General Avg: $2-$10 (Source)
- 49. Cost Per Impression Cost Per 1000 Impression(CPM)$5= $750 Total Campaign Spend 150K Total Number of Impression x 1000 Facebook AVG: $7.19 (Source) Google Ads: $38.40 (Source) General Avg: $2-$10 (Source) Tofu / Audience Building / Awareness
- 50. Cost Per Click Cost Per Click (CPC)= Total Campaign Spend Total Number Of Clicks Google Ads: $1-$2 (Source) FB Ads: $0.70-$1.01 (Source) Remarketing / Retargeting Google Ads: $0.66 to $1.23 (Source) MoFu / BoFu Remarketing / Retargeting / Interest [Intent] / Decision Money Spent: $12K # of Clicks: 5106 Cost Per Click:
- 51. Cost Per Click Cost Per Click (CPC)$2.35= $12K Total Campaign Spend 5106 Total Number Of Clicks Google Ads: $1-$2 (Source) FB Ads: $0.70-$1.01 (Source) MoFu / BoFu Remarketing / Retargeting / Interest [Intent] / Decision Money Spent: $12K # of Clicks: 5106 Cost Per Click: $2.35 Total # of Conversions Total # of Visits
- 52. Conversion Rate Conversion Rate (CVR)= Total # Of Attributed Conversions Total Number Of Visits x 100 *Let’s pretend every click turns into a visit Google Search Ads: 3.48% (Source) Google Display Ads: 0.72% (Source) FB Ads: $9.21% (Source) Money Spent: $12K # of Clicks: 5106 Cost Per Click: $2.35 Total # of Conversions: 408 Total # of Visits: 5106 Conversion Rate:
- 53. Conversion Rate Conversion Rate (CVR)7.99%= 408 Total # Of Attributed Conversions 5106 Total Number Of Visits x 100 *Let’s pretend every click turns into a visit Google Search Ads: 3.48% (Source) Google Display Ads: 0.72% (Source) FB Ads: $9.21% (Source) Money Spent: $12K # of Clicks: 5106 Cost Per Click: $2.35 Total # of Conversions: 408 Total # of Visits: 5106 Conversion Rate: 7.99% Total # of Leads: Cost Per Action:
- 54. Cost Per Action Cost Per Action(CPA) = Ad Spend Total Number of Leads Sometimes known as Cost Per Lead (CPL) When leads are qualified into prospects Google Search Ads: $59.18 (Source) Google Display Ads: $60.76 (Source) FB Ads: $18.68% (Source) Money Spent: $12K # of Clicks: 5106 Cost Per Click: $2.35 Total # of Conversions: 408 Total # of Visits: 5106 Conversion Rate: 7.99% Total # of Leads: Cost Per Action:
- 55. Cost Per Action Cost Per Action(CPA) $29.41 = $12K Ad Spend 408 Total Number of Leads *Some add the cost of the marketing labor to compare platforms A Lead is NOT Revenue Google Search Ads: $59.18 (Source) Google Display Ads: $60.76 (Source) FB Ads: $18.68% (Source) Money Spent: $12K # of Clicks: 5106 Cost Per Click: $2.35 Total # of Conversions: 408 Total # of Visits: 5106 Conversion Rate: 7.99% Total # of Leads: 408 Cost Per Action: $29.41
- 56. Cost Per Click + Cost Per Lead + Lead to Conversion Rate Cost Per Click (CPC)$2.35= $12K Total Campaign Spend 5106 Total Number Of Clicks Conversion Rate (CVR)7.99%= 408 Total # Of Attributed Conversions 5106 Total Number Of Visits x 100 Cost Per Lead(CPL) $29.41 = $12K Ad Spend 408 Total Number of Leads Money Spent: $12K # of Clicks: 5106 Cost Per Click: $2.35 Total # of Conversions: 408 Total # of Visits: 5106 Conversion Rate: 7.99% Total # of Leads: 408 Cost Per Action: $29.41
- 57. Additional Steps Depending On the Funnel B2C - Ecommerce B2C - Saas Cart Abandonment = Number of Completed Purchases Number of Carts Created x 100 SQL = Number of MQL Leads Qualified By Sales Total Number Of Leads x 100 Closing Rate = Number of Leads (Qualified) That Resulted In Sales Total Number of SQL Leads x 100 MQL = Number of Leads Qualified By Marketing Total Number Of Leads x 100 Average Cart Abandonment Rate 70% (Source) MQL Average 17% – 15% (Source) SQL Average 0.9% - 63.33% (Source) Closing Rate Avg 15% and 30% (Source)
- 58. Additional Steps Depending On the Funnel B2C - Ecommerce B2C - Saas Cart Abandonment 67% = 277 Number of Completed Purchases 408 Number of Carts Created x 100 SQL 72.5% = 222 Number of MQL Leads Qualified By Sales 306 Total Number Of Leads x 100 Closing Rate 50% = 111 Number of Leads (Qualified) That Resulted In Sales 222 Total Number of SQL Leads x 100 MQL 75% = 306 Number of Leads Qualified By Marketing 408 Total Number Of Leads x 100 Average Cart Abandonment Rate 70% (Source) MQL Average 17% – 15% (Source) SQL Average 0.9% - 63.33% (Source) Closing Rate Avg 15% and 30% (Source)
- 59. Customer Acquisition Cost Customer Acquisition Cost = Total Spend Total Number Of New Customers $12K Revenue – Cost of Goods Sold Revenue Gross Margin = Profit = # of New Customers x Gross Margin Customer LTV = Gross Margin Churn Rate CAC $81 - $1985(Source) LTV is Industry Specific Churn Rate = # of Lost Customers Total Customers (At Start of Time Period)
- 60. Customer Acquisition Cost Customer Acquisition Cost $108 = $12K Total Spend 111 Total Number Of New Customers 12K Revenue – 3K Cost of Goods Sold 10K Revenue Gross Margin %70= [$7000 Per Deal] Profit $777K= 111 of New Customers x $7000 Gross Margin Customer LTV $140K= $7000 Gross Margin 5% Churn Rate CAC $81 - $1985(Source) LTV is Industry Specific Churn Rate 5% = 10 Lost Customers 200 Total Customers (At Start of Time Period)
- 61. Budgeting for Resources / Management What Percentage of the Marketing Budget Should Be Allocated to the Team???
- 62. Allocation of Resources By the Hour for a Campaign Team: • Project Manager • SEM Specialist [Assuming they can write Copy] • Designer / Videographer Tasks Hours Management SEM Specialist Videographer Strategy 20 12 4 4 Targeting 10 1 9 0 Competitor Analysis 10 1 7 Ad Design / Video Production 24 0 0 24 Editing 4 0 0 4 Copywriting 8 1 7 0 Ad Production In Facebook Ads Manager 14 0 14 0 AB Testing 4 1 3 0 Analysis / Monitoring 8 2 6 2 Reporting 8 2 6 0 Optimization / Management: 20 2 18 0 Project Manager / Admin 14 6 4 4 Total Hours 130 22 74 34 Divided By 40 Hour Work Week 0.55 1.85 0.85 Pretend Wage [$45] 990 3330 1530 Total Price $5,850.00 Price doesn’t include the cost of doing it wrong, training, etc
- 63. “Real” Customer Acquisition Cost Customer Acquisition Cost (CAC)= Total Marketing Expenses + Spend (All Marketing Costs ) Total Number Of New Customers Revenue - Cost of Goods Sold Revenue Gross Margin = Profit = # of New Customers x Gross Margin - Labor
- 64. “REAL” Customer Acquisition Cost Customer Acquisition Cost $160.81 = $12K Total Spend + $5850 (Marketing Labor) 111 Total Number Of New Customers 12K Revenue – 3K Cost of Goods Sold 10K Revenue Gross Margin %70 = [$7000 Per Deal] Gross Profit $771.150K = 111 of New Customers x $7000 Gross Margin - $5850 (Marketing Labor)
- 65. Do this for all channels and Define the Following Top Preforming Channel (Most Leads)? • Organic, Organic Social, Email • Paid Social, Paid Search, Affiliate / Partners Top Preforming Channel / Campaign Return on Ad Spend (ROAS)? Return On Investment Per Channel (ROI)? Customer Acquisition Cost (CAC) / Customer Lifetime Value (LTV) Other Performance Metrics: Conversion Rate (Per Channel), CPC, CPM, CPL, CPA
- 66. This doesn’t work on an on-going basis… Skip it… Data entry sucks Too easy to make mistakes And there’s way better tools…
- 67. Dashboards Will Save You YEARS of Your Life
- 68. Forecast Without Running Any Ads
- 69. Forecast Without Data From Any Campaigns Building a Model Per Channel • Clicks • CPC • Conversion Rate • Conversions • CPA Where Can I Get This Data? • Historical Data [Our Previous Campaigns] • Industry Averages • Guesswork…?
- 70. Forecast Using Industry Averages Instead of Real Data What you need to define: • Product Price • Cost of goods / service(s) Look Up the Industry Average: • Cost Per 1000 Impressions (CPM) • Cost Per Click (CPC) • Click Through Rate (CTR) • Conversion Rate (CVR) Helpful Comparisons Using Industry Average Customer Acquisition Cost (CAC) Churn Rate (Churn) Customer Lifetime Value (LTV) If you can’t find the industry average, take the platform average
- 71. Example - Using Data From FinTech Let’s Pretend We’re Selling a $99 Per Month B2C FinTech Solution What you need to define: • Product Price $99 • Cost of Goods / Service $29 Look Up the Industry Average: • Cost Per 1000 Impressions (CPM) $7.19 [Source] • Cost Per Click (CPC) $3.77 [Source] • Click Through Rate (CTR) 0.56% [Source] • Conversion Rate (CVR) 9.09% [Source] Helpful Comparisons Using All-Industry Average • Customer Acquisition Cost (CAC) $1,202 [Source] • Churn Rate (Churn) 1%-17% [Source, 2] • Customer Lifetime Value (LTV)… Depends… [Source]
- 72. [Source] What if I hate data entry and spreadsheets…? Google the Following: Type of Campaign + Platform + Calculator or Template or Google Sheet [Source]
- 73. Helpful Insights On Forecasting Timeline: • Setup + Baseline = 3 Months • Optimization = 6 Months • Clear Winner(s) = 12 Months 2 Estimations Per Channel: • Conservative • “High Growth” Early Outcomes: • “The Most Effective Campaigns Are Optimized Versions Of Less Effective Campaigns” • Campaigns Testing Strategies Save Time & Money [Not covered in this presentation] • Organization, Rapid Experimentation [AB Testing], and Patience.
- 75. My Favorite Question… What Is the Least Amount of Money I Can Spend on Ads?
- 76. Comparing Google Search Ads With Youtube Ads Apples and Oranges Skippable In-Stream Ads. Non-Skippable In-Stream Ads. Discovery Ads Bumper Ads Outstream Ads Text Ads Responsive Search Ads Dynamic Search Ads
- 77. Why The Minimum Isn’t the Best Statistical significance “Statistical significance is the likelihood that the difference in conversion rates between a given variation and the baseline is not due to random chance.” source P-Value = 5% Min of 5000 Impressions
- 78. Run times for Testing Facebook Ads How Long Should I Run Ads [Facebook] • 2-3 Days for Blind Test [Avoid this] • 7 Days [Indications of Trends] • 14 Days [Clear trends] • 30 Days [Certainty] Too Short? Limit Facebook’s ability to learn how to serve the right audience based on your targeting
- 79. Stay Structured…. Your Ad Structure May Need Some Work… Customer (ICP) Vertical / Industry Pain / Value based Competitor based Technology based Message 1 Message 2 Message 1 Message 2 Message 1 Message 2 Message 3 Message 1 Message 2 Message 3 Linkedin Facebook Other Ad Network
- 80. Wrap Up
- 81. Growth-Hacking and Digital Marketing Agency.
- 82. Growth-Hacking and Digital Marketing.
- 83. THANK YOU Questions? Connect with me on Linkedin! Please add an intro message
- 84. Taylor Ryan Founder / CEO of Klint & GrowthSecrets 13+ years of marketing/startup experience From Washington, DC – 5 Years in Denmark 6x Startup Founder Finalist – Ecosystem Hero of the Year 2020 Accelerator advisor, board member, and mentor for start-ups Owner of an award winning agency and growth-hacking course Startup junkie, Investor, keynote speaker, technical marketer, and growth hacker