Foreign Remittances and their Impact on the Economy of Pakistan
The state of finance for development countries, 2014
1. The State of Finance for
Developing Countries, 2014
An assessment of the scale of all sources of finance
available to developing countries
By Jesse Griffiths
Lending to rich countries 59¢
Interest repayments on foreign debt 14¢
Profits taken out by foreign investors 42¢
Other official flows 3¢
Charitable 3¢
Aid 10¢
Foreign direct investment 44¢
Remittances from migrant workers 34¢
Portfolio equity (stocks & shares) 6¢
FOR EVERY $1DEVELOPING COUNTRIES
GAIN
THEY
LOSEMORE THAN
$2Illicit financial flows 93¢
2. CPA Country programmable aid
CSO Civil society organisation
DAC Development Assistance Committee (OECD)
DFI Development Finance Institution
EDFI European Development Finance Institution
FfD Financing for Development
FTTs Financial Transaction Taxes
GDP Gross Domestic Product
GFCF Gross fixed capital formation
GFI Global Financial Integrity
GNI Gross National Income
IFC International Finance Corporation
IFFs Illicit financial flows
IFI International Finance Institution
HIC High-income country
IMF International Monetary Fund
LIC Low-income country
LMIC Lower-middle-income country
MDG Millennium Development Goal
NGO Non-governmental organisation
ODA Overseas Development Assistance
OECD Organisation for Economic Co-operation and
Development
OOFs Other official flows
SDRs Special Drawing Rights
TJN Tax Justice Network
UMIC Upper-middle-income country
UN United Nations
UNCTAD United Nations Conference on Trade and
Development
UNDESA United Nations Department of Economic and
Social Affairs
WBG World Bank Group
Acronyms
3. 3
The State of Finance for Developing Countries, 2014
Contents
Executive summary04
Introduction – Finance and sustainable
development09
Scale and trends of different resources
1 Domestic resources12
1.1 Domestic investment 13
1.2 Government revenue 14
2 Losses of domestic resources 15
2.1 Illicit financial flows (IFFs) 16
2.2 Tax loss to tax avoidance and tax treaties 17
2.3 Lending to rich countries by developing
country governments 18
2.4 Interest repayments on foreign debt 19
2.5 Profits repatriated by foreign investors 20
3 International public resources 21
3.1 Aid 22
3.2 Other official flows (OOFs) 23
4 International for-profit flows 25
4.1 Foreign direct investment (FDI) 26
4.2 Portfolio equity 27
5 International not-for-profit flows 29
5.1 Charitable flows 30
5.2 Remittances 31
6 Debt-creating flows 32
6.1 Long-term foreign borrowing – public 33
6.2 Private external borrowing – long term 34
6.3 Short-term foreign borrowing
– public private 35
Other important characteristics of
available resources 36
Conclusions 37
Endnotes 38
4. 4
The State of Finance for Developing Countries, 2014
This report provides the most comprehensive review of the quantity of different
financing sources available to developing countries, and how they have changed
over the past decade.
Executive summary
We have analysed the best available data produced by international institutions, both from the
point of view of developing countries as a whole, and for low-income (LICs), lower-middle-
income (LMICs) and upper-middle-income countries (UMICs) separately. We provide figures
in absolute terms in US dollars, and also as percentages of Gross Domestic Product (GDP) – a
much better indicator of how important they are to the developing country in question.
Unlike other recent analyses, we have not just examined the resources flowing into developing
countries, but have also analysed the resources flowing out, identifying the lost resources.
We define losses as resources that have either been directly lost by developing countries,
such as illicit financial outflows, or resources that represent a lost opportunity, such as lending
by developing countries to rich countries. This has allowed us to examine four very different
categories of resources:
Domestic resources, including domestic investment and government revenue;
Lost resources, including illicit financial flows, profits taken out by foreign investors, interest
payments on foreign debt and lending by developing countries to rich countries;
Inflows of external resources, including international public resources (aid and other
official flows), for-profit private flows (foreign direct investment and portfolio investments
in stocks and shares) and not-for-profit private flows (including charitable flows and
remittances from migrant workers);
Debt-creating flows: both public and private borrowing by developing countries.
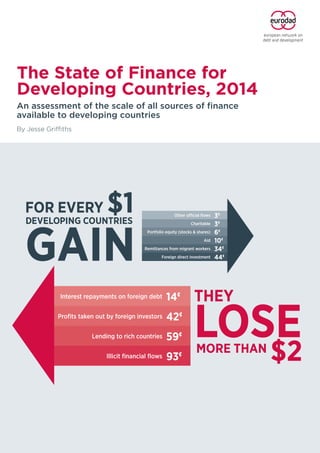
One key finding of the report is that losses of financial resources by developing countries
have been more than double the inflows of new financial resources since the financial crisis,
as Figure 1 shows.
Lost resources have been close to or above 10% of GDP for developing countries as a whole
since 2008 – meaning that for every $100 the country makes, $10 were lost, flowing out of the
country. The main drivers of this are illicit financial flows, profits taken out by foreign investors
and lending by developing countries to rich countries.
Our main findings for each category of resource are as follows:
1. Domestic resources (Section 1) – Here we examined both domestic investment and
government revenue. We found that:
Domestic resources are far larger than all external financing sources for developing
countries, with domestic investment reaching over 33% of GDP and government revenue
over 18% in 2012.
UMICs have reached $2,700 per capita domestic investment annually, while LICs manage
only $165 per capita.
There are low levels of public investment in LICs – 3.5% of GDP in 2011, compared to over
9% in LMICs.
4
5. The State of Finance for Developing Countries, 2014
5
2. Losses of domestic resources (Section 2) – Here we have focused on those outflows that
represent a genuine loss of resources that would have been better invested in the developing
country.
Outflows of domestic resources represent major losses for developing countries, and have
been running at double the inflows of new resources since 2008, as Figure 1 shows.
LICs are particularly badly affected, losing more than 18% of GDP in 2011.
The largest outflows were illicit financial flows ($634 billion in 2011) and profits repatriated
by international investors ($486 billion in 2012).
Losses of financial resources by developing countries
have been more than double the inflows of new
financial resources since the financial crisis.
Figure 1: Inflows vs. losses for developing countries, % GDP (2008-2011)
% GDP
Figure 2: Inflows vs losses,
developing countries, % GDP
INFLOWSLOSSES
2008 2009 2010 2011
10
5
0
-5
-10
-15
Illicit financial flows
Lending to rich countries
Interest payment on foreign debt
Profits taken out by foreign investors
Remittances from migrant workers
Charitable
Foreign direct investment
Aid
Other official flows
Portfolio Equity (stocks and shares)
2008 2009 2010 2011
6. The State of Finance for Developing Countries, 2014
In 2012, developing countries lent $276 billion to rich countries, and paid $188 billion in
interest on external debts.
Since 2010, repatriated profits have exceeded new inflows of Foreign Direct Investment
(FDI). LICs are particularly affected, with outflows of repatriated profits over 8% GDP in
2012.
3. Inflows of external resources (Sections 3, 4 and 5):
We have divided this section into three categories:
International public resources (Section 3) –
Country programmable aid (CPA) levels, while increasing in absolute terms to a high of
$96 billion in 2011, have been falling relative to developing country GDP, which has been
growing at a faster rate.
In LICs, however, aid remains an important resource, with CPA accounting for over 7% of
GDP in 2012.
The statistics on non-aid government-to-government ‘other official flows’ are incomplete.
International for-profit private flows (Section 4) –
FDI to developing countries was badly hit by the global crisis and remains below its 2008
peak. Rising GDP means it has fallen as a percentage of GDP from 3.2% in 2008 to 2.1% in
2012.
LICs, however, have had steadily increasing amounts of FDI compared to GDP, rising from
2.6% in 2003 to 5.1% in 2012, driven by a small number of countries.
For-profit flows can be highly volatile, particularly portfolio equity flows of stocks and
shares, which rose sharply for developing countries before the global financial crisis drove
them into negative figures in 2008.
International not-for-profit flows (Section 5) –
Remittances from private emigrants to their families back home increased from just over
$130 billion in 2003 to more than $350 billion in 2012, although this figure may be due to
improvements in data collection.
Remittances are particularly important in LICS and LMICs; they represented 7% of GDP
in LICs and 4.6% in LMICs in 2012. They are highly concentrated in a small number of
countries.
Charitable flows remain relatively small – around $30 billion in 2012, or 0.13% of
developing country GDP.
6 Lost resources have been close to or above 10%
of GDP for developing countries as a whole since
2008 – meaning that for every $100 the country
makes, $10 are lost, flowing out of the country.
“
7. The State of Finance for Developing Countries, 2014
Table 1: Financial resources for developing countries, 2012
All developing
countries
LICs LMICs UMICs
$bns %GDP $bns %GDP $bns %GDP $bns %GDP
1. Domestic resources
Domestic Investment 7,328 33.4 112 27.2 1,316 28.1 5,900 35.1
Government Revenue (2011) 4,125 18.8 60 14.4 697 14.5 3,367 20.4
2. Losses - Domestic resource outflows
Illicit Financial Flows (2011) -634 -4.3 -16 -6.5 -185 -5.8 -432 -3.8
Tax loss to abusive tax avoidance
no
data
no
data
no
data
no
data
no
data
no
data
no
data
no
data
Lending to rich countries -276 -1.2 -8 -2.1 -20 -0.4 -247 -1.5
Interest repayments on external debt -188 -0.8 -4 -0.9 -34 -0.7 -150 -0.9
Profits repatriated by foreign investors -486 -2.3 -28 -8.1 -88 -1.9 -371 -2.2
Sub-total: Losses 1,583 -8.6 -56 -17.6 -327 -8.8 -1,200 -8.4
3. Inflows
3.1 International Public Resources
Aid 90 0.4 33 7.2 35 0.7 16 0.1
Other Official Flows 23 0.1 0 0.1 8 0.2 15 0.1
3.2 International for-profit private flows
Foreign Direct Investment 480 2.1 24 5.1 107 2.2 349 2.0
Portfolio investment (stocks and shares) 104 0.6 0 0.1 38 1.5 66 0.5
3.2 International not-for-profit private flows
Charitable flows 30 0.1 n/a n/a n/a n/a n/a n/a
Remittances 350 1.8 29 7.0 200 4.6 121 0.8
Sub-total: Inflows 1,077 5.1 86 19.5 388 9.2 567 3.5
4. Debt creating flows
Public borrowing, long term 168 0.8 8 1.7 51 1.0 109 0.6
Private borrowing, long term 154 0.7 1 2.2 44 0.9 108 0.7
Short term borrowing 103 0.5 -1 -0.3 28 0.6 76 0.4
Sub-total: debt creating flows 425 1.9 8 3.5 124 2.5 294 1.7
7
8. 8
The State of Finance for Developing Countries, 2014
4. Debt-creating flows (Section 6)
We have separated these from other flows because the fact that they create debt is an
important characteristic and because, as the loan is repaid, the net flow to developing countries
will be zero (not including the negative flow of interest repayments).
Since 2006, there has been a sharp increase in new debt taken on by developing countries,
driven by LMICs and UMICs.
Developing country debt stocks reached their highest level ever in 2012 – $4.8 trillion,
according to the World Bank – which was largely driven by increases in indebtedness by
private actors.
LIC governments have remained heavy net borrowers throughout the period, averaging
between 1.3% and 2% of GDP in additional long-term borrowing between 2003 and 2012.
Table 1 summarises the current state of all financing resources for developing countries in 2012.
This report does not tackle the extremely important issue of the quality of these resources,
which will be examined in future editions. Page 36 gives a very brief summary of some of the
most important issues, including: macro-economic risks, accountability and transparency;
impacts on domestic politics; and contributions to sustainable development.
As the United Nations gears up for its critically important summit on financing for development
(FfD) in Addis Ababa in 2015, it will be important to have a clear-eyed view of the current scale
of all different financing resources available. It is hoped that this report will make a significant
contribution to that understanding.
xx
“
Domestic resources are far larger than all
external financing sources for developing
countries, with domestic investment reaching
over 33% of GDP and government revenue over
18% in 2012.
“
8
9. 9
The State of Finance for Developing Countries, 2014
This report provides a comprehensive review of the quantity, trends and volatility of different
financing sources available to developing countries.
A recent United Nations (UN) expert committee report provided a useful summary showing
the need to mobilise significant resources to meet environmental, anti-poverty and
infrastructure needs. This was based on a review of the literature, and is reproduced in Figure
2. It provides useful background information, but we do not go into detail about the scale
of resources needed to meet global targets to eradicate poverty or to achieve sustainable
development goals, as this is not the focus of this report.
Report focus and methodology
We have focused on answering three questions:
1 What is the scale of different resources for developing countries, and how has this evolved
over the past ten years?
2 Do the scale and trends differ between the three main classes of developing country: LIC,
LMIC and UMIC?
3 How volatile have the different resources proved to be?
Introduction
Finance and sustainable
development
9
Annual investment requirements (billion US$ per year)
10 100 2,000 10,000
Figure 2: Order of magnitude of different financing needs
Source: UN1
Oceans
Forests
Biodiversity
Climate change mitigation
Climate change adaptation
Universal access to energy
Renewable energy
Energy efficiency
Land and agriculture
Infrastructure (non energy)
MDGs
10. 10
The State of Finance for Developing Countries, 2014
We have tried to answer the question of the true scale of the different resources from the point
of view of the developing country. This means examining:
Domestic resources (Section 1) – Both investment and government revenue.
Losses of domestic resources through outflows (Section 2) – Here we have focused on
those outflows that represent a genuine loss of resources that would have been better
invested in the developing country. This includes illicit financial outflows, tax losses to
tax evasion, avoidance and tax treaties, lending to rich country governments, interest
repayments on foreign debt and profits repatriated by foreign investors. We have not
included outflows that are likely to have beneficial impacts for the developing country,
such as FDI leaving developing countries.
Inflows of external resources (Sections 3, 4 and 5) –
o International public resources, including aid and other government-to-government
flows.
o International for-profit flows, including FDI and portfolio equity.
o International not-for-profit private flows, including charitable flows and remittances.
Debt-creating flows (Section 6) including short- and long-term debt. We have
separated these from other flows because the fact that they create debt is an important
characteristic, and because, as the loan is repaid, the net flow to developing countries will
be zero (not including the negative flow of interest repayments).
We have chosen these questions because they are essential to developing a firm
understanding of the quantity of different financing sources. However, we recognise that issues
regarding the quality of the different sources are equally, if not more important. This includes
issues regarding the macro-economic impacts, transparency, accountability, political and
poverty impacts of the resources. These are noted on page 36 and we also plan to examine
them in future editions of this report.
Data selection and analysis – some key points
We have compared the 193 countries of the UN, with the exception of Nauru, which does
not have a World Bank income classification.
We have used 2012 data whenever possible, as this is the most recent year for which a
reliable total picture can be built on all the different resources.
We have used the World Bank’s income classifications for countries, listed in Table 2,
as these are the only objectively calculated option. The main alternatives – from the
International Monetary Fund (IMF) and the Organisation for Economic Co-operation and
Development (OECD) Development Assistance Committee (DAC) – are updated through
political negotiation and so inevitably contain strange anomalies, such as the IMF counting
Saudi Arabia as a developing country. However, it should be noted that the World Bank’s
cut-off points are essentially arbitrary. In future editions of this report, we may find it
useful to break them down.
The trends are shown for countries that are currently in the income classification shown –
so the historical figures for LICs are for countries that are classified as LICs as of December
2014. This allows us to see the historical trajectories of a specific group of countries – if we
had adjusted the figures according to the income classification at the time when countries
moved between categories it could significantly affect the figures, without necessarily
telling us anything important.
We have provided figures in both current US dollars and as a percentage of GDP – which
gives a much better impression of the true value of the resource.
Full details of our methodology can be found online at www.eurodad.org.
11. 11
The State of Finance for Developing Countries, 2014
High-Income Countries (HICs) Upper-Middle-Income
Countries (UMICs)
Lower-Middle-Income
Countries (LMICs)
Low-income Countries (LICs)
$12,746+ GNI per capita $4,126 to $12,745 GNI per capita $1,046 to $4,125 GNI per capita $1,045 or less GNI per capita
Andorra
Antigua and Barbuda
Australia
Austria
Bahamas, The
Bahrain
Barbados
Belgium
Brunei Darussalam
Canada
Chile
Croatia
Cyprus
Czech Republic
Denmark
Equatorial Guinea
Estonia
Finland
France
Germany
Greece
Iceland
Ireland
Israel
Italy
Japan
Kuwait
Latvia
Liechtenstein
Lithuania
Luxembourg
Malta
Monaco
Netherlands
New Zealand
Norway
Oman
Poland
Portugal
Qatar
Korea, Rep.
Russian Federation
St. Kitts and Nevis
San Marino
Saudi Arabia
Singapore
Slovak Republic
Slovenia
Spain
Sweden
Switzerland
Trinidad and Tobago
United Arab Emirates
United Kingdom
United States
Uruguay
Albania
Algeria
Angola
Argentina
Azerbaijan
Belarus
Belize
Bosnia and Herzegovina
Botswana
Brazil
Bulgaria
China
Colombia
Costa Rica
Cuba
Dominica
Dominican Republic
Ecuador
Fiji
Gabon
Grenada
Hungary
Iran, Islamic Rep.
Iraq
Jamaica
Jordan
Kazakhstan
Lebanon
Libya
Malaysia
Maldives
Marshall Islands
Mauritius
Mexico
Montenegro
Namibia
Palau
Panama
Peru
Romania
St. Lucia
St. Vincent and the Grenadines
Serbia
Seychelles
South Africa
Suriname
Thailand
Macedonia, FYR
Tonga
Tunisia
Turkey
Turkmenistan
Tuvalu
Venezuela, RB
Armenia
Bhutan
Bolivia
Cape Verde
Cameroon
Congo, Rep.
Cote d’Ivoire
Djibouti
Egypt, Arab Rep.
El Salvador
Georgia
Ghana
Guatemala
Guyana
Honduras
India
Indonesia
Kiribati
Kyrgyz Republic
Lao PDR
Lesotho
Mauritania
Micronesia, Fed. Sts.
Mongolia
Morocco
Nicaragua
Nigeria
Pakistan
Papua New Guinea
Paraguay
Philippines
Moldova
Samoa
Sao Tome and Principe
Senegal
Solomon Islands
South Sudan
Sri Lanka
Sudan
Swaziland
Syrian Arab Republic
Timor-Leste
Ukraine
Uzbekistan
Vanuatu
Vietnam
Yemen, Rep.
Zambia
Afghanistan
Bangladesh
Benin
Burkina Faso
Burundi
Cambodia
Central African Republic
Chad
Comoros
Korea, Dem. Rep.
Congo, Dem. Rep.
Eritrea
Ethiopia
Gambia, The
Guinea
Guinea-Bissau
Haiti
Kenya
Liberia
Madagascar
Malawi
Mali
Mozambique
Myanmar
Nepal
Niger
Rwanda
Sierra Leone
Somalia
Tajikistan
Togo
Uganda
Tanzania
Zimbabwe
Table 2: 193 UN member states: which countries are in which categories?
NB: Nauru is a UN member state, but is not classified by the World Bank in any of the
above categories.
12. The State of Finance for Developing Countries, 2014
Scale and trends of different resources
1Domestic
resources
Summary
Domestic resources are far larger than all external
financing sources for developing countries, with
domestic investment reaching over 33% of GDP and
government revenue over 18% in 2012.
UMICs have reached $2,700 per capita domestic
investment annually, while LICs manage only $165
per capita.
There are very low levels of public investment in
LICs – 3.5% of GDP in 2011 compared to over 9%
in LMICs.
12
13. 13
The State of Finance for Developing Countries, 2014
Trends and distribution
• Domestic investment is far larger than
all external financing sources in all
categories of developing countries.
• There is a significant difference between
UMICs, which have reached around
35% of GDP as domestic investment,
compared to LMICs, which have recently
reached around 25%, as Figure 4 shows.3
• There is a huge variation in investment
per capita, which was over $2,700 in
UMICs in 2012 and $590 in LMICs, but
only $165 in LICs.4
• A key difference is the very low levels of
public investment in LICs – 3.5% of GDP
in 2011, compared with 9.2% in LMICs, as
Figure 5 shows.
Volatility
• For developing countries as a whole,
domestic investment has not proved
volatile over the past decade, as Figures
3 and 4 show.
• In addition it has not been greatly
affected by external shocks, having
increased as a percentage of GDP for
developing countries since the global
financial crisis.
LIC LMIC UMIC Total developing countrySource: World Bank, Eurodad calculations
2003
2004
2005
2006
2007
2008
2009
2010
2011
2012
Figure 3: Domestic Investment Trends ($bn)
$bn
8000
7000
6000
5000
4000
3000
2000
1000
0
2003
2004
2005
2006
2007
2008
2009
2010
2011
2012
Figure 4: Domestic Investment Trends (%GDP)
% GDP equivalent
40
35
30
25
20
15
10
5
0
2005
2006
2007
2008
2009
2010
2011
Figure 5: Public investment (%GDP)
% GDP
12
10
8
6
4
2
0
LIC - Public LMIC- Public
Source: World Bank data, Eurodad calculations
About the data
• The data is World Bank figures for ‘gross fixed capital
formation’ (GFCF), which measures investment in ‘permanent’
assets including machinery, buildings and roads.
• These figures are given to provide a yardstick against which
to measure external flows. A relatively small portion of the
totals are double counted with some of these external flows.2
A more significant element of double counting will exist with
domestic government revenue (section 1.2). Unfortunately,
the data are not sufficiently detailed for us to remove this
double counting.
$billions % GDP equivalent
LICs 112 27.2
LMICs 1,316 28.1
UMICs 5,900 35.1
All Developing
Countries
7,328 33.4
Table 3: Domestic Investment (2012)
1.1 Domestic investment
14. 14
The State of Finance for Developing Countries, 2014
Trends and distribution
• Developing country governments have
increased revenue collection, with
government revenues accounting for
close to 19% of GDP in 2011, up from just
under 17% in 2005. For comparison, the
developed country average was close to
24%.
• UMICs raised over 20% of GDP as
government revenue in 2011, compared
to LMICs and LICs, which managed less
than 15%. However, LICs have improved
revenue collection significantly, from 11.8%
of GDP in 2006 to 14.4% in 2011.
• In the poorest developing countries, this
translates to tiny amounts per capita for
governments to spend on basic services,
public infrastructure and security – less
than $80 per person per year in LICs,
under $300 per person in LMICS in 2012.
For UMICS, the figure was under $1,500
per person.7
Volatility
• As Figure 7 shows, government revenues
have proved resilient to external
shocks, remaining relatively stable as
a percentage of GDP since the global
financial crisis for developing countries as
a whole, and rising in LICs.
• In future editions of this report, we will
examine in more detail the portion of
government expenditure financed by
borrowing. International borrowing is
covered in section 6, but there is also
a significant component of domestic
borrowing. According to the IMF, the
domestic component of developing
country governments’ debt increased
from around 15% of the total in 2003 to
almost 30% in 2010.8
About the data
• The data shows World Bank estimations of central
government revenue, excluding grants.
• There will be double counting with domestic investment, as
some government revenue will be spent on investment. As
the data does not include grants, Overseas Development
Assistance (ODA) loans are excluded, as are revenues raised
through borrowing.
$billions % GDP equivalent
LICs 60 14.4
LMICs 697 14.5
UMICs 3,367 20.4
All Developing
Countries
4125 18.8
Table 4: Government Revenue (2011)6
1.2 Government revenue
2006
2007
2008
2009
2010
2011
Figure 6: Government Revenue trends ($bn)
$bn
4500
4000
3500
3000
2500
2000
1500
1000
500
0
Source: World Bank, Eurodad calculations
2006
2007
2008
2009
2010
2011
Figure 7: Government Revenue trends (%GDP)
% GDP equivalent
25
20
15
10
5
0
LIC LMIC UMIC Total developing country
15. The State of Finance for Developing Countries, 2014
Scale and trends of different resources
2Losses of domestic
resources
Summary
Outflows of domestic resources represent major
losses for developing countries and significantly
exceeded inflows of new resources in 2011, totalling
almost 10% of GDP.
LICs are particularly badly affected, losing over 18%
of GDP in 2011.
The largest outflows were illicit financial flows
($634 billion in 2011) and profits repatriated by
international investors ($486 billion in 2012). Both
are likely to be underestimates.
In the same year, developing countries lent $276
billion to rich countries and paid $188 billion in
interest on external debts.
Since 2010, repatriated profits have exceeded new
inflows of FDI, with LICs particularly affected, with
outflows of over 8% of GDP in 2012.
15
16. 16
The State of Finance for Developing Countries, 2014
Trends and distribution
• In 2011, domestic resources lost by
developing countries to IFFs was over
$630 billion, equivalent to 4.3% of
developing country GDP.
• IFFs have been increasing gradually for
all categories of countries, though as a
percentage of GDP this has not been the
case, as GDP has grown more quickly
than IFF estimates in recent years.
• LICs are particularly badly affected,
losing 6.7% of GDP in 2011 to IFFs. Given
the very low level of public resources and
domestic investment in these countries,
this is a particularly important loss.
• Given the illicit nature of these flows,
data is inherently difficult to collect, but it
is likely that the GFI figures are under-
estimates, as GFI recognises.11
Volatility
• As Figures 8 and 9 show, IFFs actually
increased after the global financial crisis.
The overall GFI figures showed a decrease
after the crisis, but this was driven by
HICs in the GFI sample. However, the loss
of IFFs as a percentage of GDP fell for
all categories of developing countries, as
GDP grew at a faster rate than IFFs.
About the data
• “Illicit [financial] flows are all unrecorded private financial
outflows involving capital that is illegally earned, transferred,
or utilised.”10
• The data is from Global Financial Integrity (GFI) and is
based on their analysis of IMF data, including net errors
and omissions in balance of payments statistics and
discrepancies in trade statistics.
• Our total figures differ from those published by GFI because
of a difference in classifying what is a ‘developing country’.
We use the World Bank’s system (for reasons noted above),
while GFI uses the IMF’s. As the IMF list includes some large
countries that the World Bank classifies as high-income
countries (HICs), such as Russia, our total figures are smaller
than GFI’s.
$billions % GDP equivalent
LICs -16 -6.5
LMICs -185 -5.8
UMICs -432 -3.8
All Developing
Countries
-634 -4.3
Table 5: Illicit financial flows (2011)6
2.1 Illicit financial flows (IFFS)
2003
2004
2005
2006
2007
2008
2009
2010
2011
Figure 8: Illicit financial flows ($bn)
$bns
Source: GFI, Eurodad calculations
0
-200
-400
-600
-800
2003
2004
2005
2006
2007
2008
2009
2010
2011
Figure 9: Illicit financial flows (GDP)
% GDP equivalent
LIC LMIC UMIC Total developing country
0
-5
-10
-15
17. 17
The State of Finance for Developing Countries, 2014
Illicit flows are only one way that developing
countries lose out on tax revenues from
corporations. Abusive tax avoidance – where
companies try to dodge taxes through
complex internal structures and by finding
loopholes in tax laws – is likely to be a very
significant problem. Although global figures
are not available, there is ample evidence of
the huge scale of this problem. For example,
in Europe, tax evasion and avoidance has
been estimated at €1 trillion per year, of
which €150 billion is tax avoidance.12
In addition, taxes on multinational
corporations have been significantly reduced
through the proliferation of tax breaks, tax
deals and other tax ‘incentives’ offered
by developing countries to multinational
companies. This ‘race to the bottom’ – where
all countries compete with each other to
offer lower tax rates to attract multinationals
– is compounded by the difficulty developing
countries face when trying to levy taxes in
the first place. It has also been encouraged
by advice and conditionality of International
Financial Institutions (IFIs) in recent decades.
As a result, taxes on corporate profits have
been declining across the world, as Figure 10
shows.
Lost tax revenues can also be exacerbated
by tax treaties. A recent study13
found that
“one estimate… is that treaties with the
Netherlands led to foregone revenue for
developing countries of at least EUR 770
million in 2011”.
The accumulation of wealth transferred out
of developing countries and hidden in tax
havens means that tax revenues are not just
lost in the year the wealth is transferred. The
Tax Justice Network (TJN) estimates that, as
of 2010, between $21 trillion and $32 trillion
of global financial wealth from a sample of
139, mostly developing, countries has been
invested “virtually tax free” through secrecy
jurisdictions.14
Using a conservative method,
based only on taxing the income from that
wealth, they estimate that this has resulted in
$189 billion in lost tax revenues annually.15
2.2 Tax loss to tax avoidance
and tax treaties
2006
2007
2008
2009
2010
2011
2112
2013
2014
Figure 10: Corporate profit tax rates (GDP)
%
Africa average Asia Average Latin America average OECD average
Source: KPMG
40
30
20
10
0
18. 18
The State of Finance for Developing Countries, 2014
Trends and distribution
• Developing countries have been lending
to developed countries on a significant
scale for several years. Over the five years
between 2008 and 2012, close to $2.5
trillion was lent by developing countries
to the developed world, in particular to
the USA.
• UMICs dominate these figures, and lent
over 3% of their GDP in each of 2008,
2009 and 2010, as Figure 12 shows.
However, LICs have also lent significantly
– over 3% of their GDP in 2009, for
example.
• It should be noted that our figures appear
highly conservative compared to other
estimates. For example, according to a
major report by the UN Department of
Economic and Social Affairs (UNDESA),
increases in reserves means that
“Developing countries, as a group, are
expected to provide a net transfer of
financial resources of approximately
$826.6 billion to developed countries in
2011”.16
• It is a misconception that the figures
are caused purely by the large reserve
holdings of populous countries such
as China and India. For example, 16
developing countries, including three
LICs, invested more than 5% of their GDP
in building reserves between 2011 and
2012.17
In comparison, China invested 1.6%
of its GDP and India actually decreased
its reserves over the same period.
Volatility
• Building reserves represents a major
effort by many developing countries
to protect themselves from the risks
associated with global capital flows,
particularly volatile and pro-cyclical
private flows. It has also allowed them
to protect their currencies, helping to
prevent crises.
• However, as a Eurodad report pointed
out,18
it entails significant opportunity
costs in terms of revenues that
could have otherwise been invested
for development. The reasons that
developing countries have to pay this
price are because liberalisation over
recent decades has increased the scale of
international private capital movements,
and because developing countries do not
have faith in existing global institutions
and mechanisms of global economic
governance, particularly the IMF.
• Therefore, unlike the other figures in
this section, these represent a lost
opportunity for developing countries
rather than a direct loss of resources.
The reserves represent an asset that
developing countries can sell at a later
date, and which can also earn returns.
About the data
• The data shows lending to developed (rich) countries by
developing country governments, caused by developing
countries buying safe assets such as US government bonds to
boost their reserves.
• It is calculated from World Bank data on increases in reserve
assets, excluding gold and IMF-related assets. Unfortunately
we can only obtain figures for the past five years.
$billions % GDP equivalent
LICs -8 -2.1
LMICs -20 -0.4
UMICs -247 -1.5
All Developing
Countries
-276 -1.2
Table 6: Lending to rich countries by developing country
governments, 2012
2.3 Lending to rich countries by
developing country governments2008
2009
2010
2011
2012Figure 11: Lending to rich countries by developing
country governments ($bn)
$bns
Source: World Bank, IMF, Eurodad calculations
100
0
-100
-200
-300
-400
-500
-600
-700
-800
2008
2009
2010
2011
2012
Figure 12: Lending to rich countries by developing
country governments (% GDP)
% GDP
LIC LMIC UMIC Total developing country
2
1
0
-1
-2
-3
-4
-5
19. 19
The State of Finance for Developing Countries, 2014
Trends and distribution
• Interest repayments have been rising
over the past ten years for developing
countries as a whole, reaching just under
$190 billion in 2012. However, they have
actually been falling as a percentage of
GDP, due to GDP growth in LMICs and
MICs being higher than growth in interest
repayments.
• In any one time period, certain borrowers
are likely to dominate the figures,
particularly for smaller economies.
For example, the LIC figures have
been heavily influenced by very high
repayments from Kazakhstan ($6.2 billion
out of the LIC total of $7.3 billion in 2011,
for example). The significant fall in 2012
was due to a sharp reduction in interest
repayments by Kazakhstan to $2.3 billion.
Volatility
• These repayments are the result of loans
taken out, so need to be understood in
the context of section 6. As debt levels
increase, so too do interest repayments.
How important this is depends on growth
in GDP, but also on the interest rates
charged.
About the data
• The data, from the World Bank, shows total interest
repayments by developing countries on short- and
long-term external debt, for public and private actors
together.
$billions % GDP equivalent
LICs -4 -0.9
LMICs -34 -0.7
UMICs -150 -0.9
All Developing
Countries
-188 -0.8
Table 7: Interest repayments on foreign debt (2012)
2.4 Interest repayments on
foreign debt
Figure 13: Interest repayments on foreign debt ($bn)
$bn
0
-20
-40
-60
-80
-100
-120
-140
-160
-180
-200
2003
2004
2005
2006
2007
2008
2009
2010
2011
2112
Figure 14: Interest repayments on foreign debt (%GDP)
% GDP equivalent
LIC LMIC UMIC Total developing countrySource: World Bank, Eurodad calculations
0
-0.5
-1
-1.5
-2
-2.5
2003
2004
2005
2006
2007
2008
2009
2010
2011
2012
20. 20
The State of Finance for Developing Countries, 2014
Scale and trends
• Developing countries lose a consistent
and large proportion of GDP to investors
repatriating profits from their FDI
investments – over 2% of total GDP
since 2005 (see Figure 16.19
Since 2010,
repatriated profits have exceeded new
inflows of FDI as a percentage of GDP, as
Figure 16 shows.20
• This does not mean that FDI has a
negative impact whenever it occurs.
The question is whether significant
benefits can be gained during this
period to compensate for the losses
through repatriated profits, either
through investing in areas that domestic
investment will not reach, or, more
likely, through the adoption of new
technologies that come with FDI. As
UNDESA has noted, “the evidence on
the impact of FDI on the domestic
economy remains mixed. In countries
that experienced positive spillovers, there
is evidence that government policies
played an important role in facilitating
these spillovers.”21
This is why UNCTAD
has developed an FDI Contribution
Index, which provides one template for
assessing when FDI is a positive flow, and
how to improve FDI inflows.
• Interestingly, the World Bank data for net
FDI22
(not including boomerang flows)
paints an even gloomier picture: it shows
a net negative FDI flow for developing
countries every year since 2005 (when
the dataset begins). In 2012, the World
Bank figures show a net FDI flow for
developing countries of -$418 billion.23
Volatility
• The increase in repatriated profits since
2009 may reflect the fact that investors
have responded to troubling economic
conditions in their home countries that
have been caused by the financial crisis.
About the data
• The data on repatriated profits on money earned from
FDI (see section 4.1) is calculated from World Bank
figures.
• However, there is no data for the dividends and other
income earned by the foreign investors on their portfolio
equity (stocks and shares where the total holding is
less than 10% of the company) that leaves the country,
meaning the figures are underestimates.
$billions % GDP equivalent
LICs -28 -8.1
LMICs -88 -1.9
UMICs -371 -2.2
All Developing
Countries
-486 -2.3
Table 8: Profits repatriated by foreign investors (2012)
2.5 Profits repatriated by
foreign investors
3.5
3
2.5
2
1.5
1
0.5
0
2003
2004
2005
2006
2007
2008
2009
2010
2011
2012
Figure 17: FDI inflows and repatriated
profits, all developing countries
(%GDP)
% GDP
Repatriated profit FDI inflow
Source: UNCTAD + World Bank data, Eurodad calculations
2003
2004
2005
2006
2007
2008
2009
2010
2011
2112
Figure 15: Profits repatriated by foreign investors ($bn)
$bn
Source: World Bank, Eurodad calculations
0
-100
-200
-300
-400
-500
-600
2003
2004
2005
2006
2007
2008
2009
2010
2011
2112
Figure 16: Profits repatriated (%GDP)
%
0
-2
-4
-6
-8
-10
-12
LIC LMIC UMIC Total developing country
21. The State of Finance for Developing Countries, 2014
Scale and trends of different resources
3International public
resources
Summary
Country programmable aid (CPA) levels, while
increasing in absolute terms to a high of $96 billion
in 2011, have been falling relative to developing
country GDP, which has been growing at a
faster rate.
In LICs, however, aid remains an important resource,
with CPA accounting for over 7% of GDP in 2012.
Reliable statistics on non-aid government-to-
government flows are not available.
21
22. 22
The State of Finance for Developing Countries, 2014
Trends and distribution
• CPA received by developing countries
increased steadily from 2005, peaking
at $96 billion in 2011. These increases
were directed at LMICs and particularly
LICs: CPA to UMICs fell from $20 billion in
2005 to $16 billion in 2012.
• However, as a share of developing
country GDP, CPA decreased from 0.7%
in 2005 to 0.4% in 2012. This was driven
by the significant growth of GDP in
developing countries.
• There is a huge difference between
developing countries, with LICs relying
heavily on CPA where it made up the
equivalent of 7.2% of total GDP in 2012,
although this has been decreasing
since 2009, when it was the equivalent
8.7% of GDP. In 2012, CPA received was
equivalent to 0.7% of GDP in LMICs – still
a significant figure – but only 0.1% in
UMICS.
• CPA figures are not available for aid flows
between developing countries. These
‘South-South cooperation’ flows are
significant, estimated to be between $16
and $19 billion in 2011.30
Volatility
• Overall, CPA levels have not responded
rapidly to economic changes in donor
countries – increasing even after the
financial crisis – meaning it could be a
valuable counter-cyclical resource.
• However, it can be a very volatile at
national level for developing countries. In
Africa, UNCTAD has estimated that ODA
is up to four times more volatile than
domestic tax revenue.31
About the data
• The data is from the OECD Development Assistance
Committee (DAC), and shows Country Programmable Aid
(CPA). This is a subset of Official Development Assistance
(ODA), removing items that are: unpredictable by nature;25
entail no cross-border flows;26
do not form part of co-
operation agreements between governments;27
or are not
country programmable by the donor.28
• According to the DAC, “CPA is much closer to capturing the
flows of aid that go to the partner countries than the concept
of Official Development Assistance (ODA).”
• CPA does not cover all aid flows – those between developing
countries are not included, and some high-income countries
are not included.29
It is based on disbursements, and does not
net out repayments of concessional loans (which means there
will be some double counting with section 6.)
$billions % GDP equivalent
LICs 33 7.2
LMICs 35 0.7
UMICs 16 0.1
Developing Country
Total (including
regional aid)
90 0.4
Table 9: Country Programmable Aid (CPA) 2012
3.1 Aid
2005
2006
2007
2008
2009
2010
2011
2012
Figure 18: Country Programmable Aid ($bn)
$bns
Source: OECD, Eurodad calculations
120
100
80
60
40
20
0
1 2 3 4 5 6 7 8
Figure 19: Country Programmable Aid (%GDP)
% GDP equivalent
10
8
6
4
2
0
LIC LMIC UMIC Developing Country total (inc. regional aid)
23. 23
The State of Finance for Developing Countries, 2014
Trends and distribution and risk
• As the figures above show, OOFs are
a relatively small share of GDP in all
categories of developing countries,
but can be a highly volatile one, and
sometimes represent net negative
transfers, due to repayments of OOF
loans.
About the data
• Reliable, accurate statistics on all government-to-government
financial transfers – which would include, for example,
transfers for political, military or economic purposes – are
not kept by an international organisation, which represents a
significant gap in the figures.
• We use the best data available – Other Official Flows (OOFs)
– from the OECD DAC. This is less an attempt to capture
all non-ODA government-to-government transfers than a
mechanism to classify reporting to the DAC that does not
meet ODA requirements. This includes, for example, non-
concessional loans or security-related expenditure.
$billions % GDP equivalent
LICs 0.3 0.1
LMICs 8 0.2
UMICs 15 0.1
All Developing
Countries
23 0.1
Table 10: Other Official Flows (2012)
3.2 Other official flows (OOFs)
Source: OECD, Eurodad calculations
Figure 20: Other Official Flows ($bn)
$bns
2003
2004
2005
2006
2007
2008
2009
2010
2011
2112
50
25
0
-25
-50
2003
2004
2005
2006
2007
2008
2009
2010
2011
2112
Figure 21: Other Official Flows (%GDP)
% GDP equivalent
50
25
0
-25
-50
LIC LMIC UMIC Total developing country
24. 24
The State of Finance for Developing Countries, 2014
This report has focused on the main
existing sources of finance. However,
considerable efforts have been
made in recent years to promote
new, additional ‘innovative’ sources
of public finance, some of which are
bearing fruit, although totals mobilised
so far are very low. Eurodad examined
these in detail in a previous report.32
Below we summarise the findings.
Financial Transaction Taxes
Financial Transaction Taxes (FTTs) are
taxes on the trading of shares, bonds,
derivatives and foreign exchange. In
a sample of just seven G20 countries,
the IMF has estimated that FTTs are
already raising $15 billion per year,
although this is not allocated to
development.33
A group of 10 European countries
have agreed to adopt new FTTs in
stages, starting with shares and some
derivatives. In 2011, the European
Commission estimated that an EU-
implemented FTT across all asset
classes could raise “between €16.4
billion and €400 billion depending on
assumptions on decrease in volume,
the scope of products covered and the
tax rates (0.01% for the first estimate
and 0.1% for the second).”34
Carbon and other Environmental
Taxes
Airline ticket levy: This is already
in existence in nine countries, with
the proceeds from most countries
earmarked for UNITAID. It has raised
over $1 billion for UNITAID since
2006.35
If expanded to more countries,
or increased in scope, the potential
raised could increase significantly.
Developed country carbon taxes: A
2011 joint report by the IMF, World
Bank and OECD estimated that a
tax of $50 per tonne in developed
countries would yield about $450
billion per year, or $250 billion ($25
per tonne) or $155 billion ($15 per
tonne.)36
If a tax of $25 per tonne
was levied on aviation and bunker
fuels and taxes paid by developing
countries were rebated, the same
report estimates that $22 billion per
year could be raised, or $14 billion if
the rate was $15 per tonne.
New SDR creation
Special Drawing Rights (SDRs) are
an international reserve asset held at
the IMF by all member governments.
The main proposal is to agree regular
additional allocations of SDRs – in
effect to create new reserve assets.
In 2009, a G20 agreement led to
the issuance of $250 billion in extra
SDRs,37
showing that such ‘global
quantitative’ easing is possible.
UNDESA suggests annual allocations
of $100 billion to £250 billion per
year38
and, if the majority of new SDRs
went to developing countries this
would yield them $100 billion to $167
billion annually.
Box 1:
‘Innovative’ public finance
25. The State of Finance for Developing Countries, 2014
Scale and trends of different resources
4International for-profit
private flows
Summary
FDI to developing countries was badly hit by the
global crisis, but has risen since then, although it
remains below its 2008 peak. Rising GDP means FDI
has fallen as a percentage of GDP from 3.2% in 2008
to 2.1% in 2012.
LICs, however, have had steadily increasing amounts
of FDI compared to GDP, rising from 2.6% in 2003 to
5.1% in 2012, driven by a small number of countries.
For-profit flows can be highly volatile, particularly
portfolio equity flows of stocks and shares, which
rose sharply before the global financial crisis before
collapsing into negative figures in 2008.
25
26. 26
The State of Finance for Developing Countries, 2014
Trends and distribution
• Developing countries have been
receiving increasing quantities of FDI
but this reflects overall increases in their
economies. In fact, as an equivalent of
GDP, FDI inflows have risen and then
fallen over the past decade, driven by
LMICs and UMICs, starting at 2.4% in
2003, rising to 3.2% in 2008 and falling
again after the financial crisis to 2.1% in
2012.
• LICs have had steadily increasing
amounts of FDI compared to GDP,
rising from 2.6% in 2003 to 5.1% in 2012.
However, this is heavily concentrated in
a few countries – with half of the 2012
total going to just four resource-rich
countries.40
• Developing country FDI outflows – where
the developing country is investing
overseas – have experienced a similar
trend, but on a smaller scale. Outflows
rose from $17 billion in 2003 to $195
billion in 2012, and increased from 0.4% of
GDP to 0.8% over the same period, with a
peak of 1% in 2008.41
Volatility
• FDI can be a highly pro-cyclical flow
on a global scale, as it responds heavily
to incentives in the home country. FDI
inflows to developing countries also
fell from $491 billion in 2008 to $354
billion in 2009 due to the financial crisis.
Although they have subsequently
recovered, this is in part also driven by
low interest rates in developed countries
driving investors to ‘search for yield’
elsewhere. When interest rates begin to
rise again in the coming years, developing
countries could face significant shocks in
terms of reduced FDI and other private
flows.42
• FDI can also be highly volatile at the
national level, for a variety of reasons.
A study of FDI to low-income countries
found that “it has been quite volatile
in eight countries, reflecting peaks
in oil investment in Cameroon, Chad
and Gabon, large individual projects in
Gambia and Mali, and political instability
in Bolivia, CAR [Central African Republic]
and Togo”.43
About the data
• FDI is foreign investment where the investor is thought
to take an active interest in management of the company
– normally assumed when they own 10% or more of the
company. It is made up of three elements: equity capital,
reinvested earnings and intra-company loans.39
• The data on inflows and outflows is from UNCTAD, which
takes great care to compile accurate statistics, including
removing flows that are routed through ‘special purpose
entities’ to avoid taxes. However, FDI figures are inevitably
distorted by companies’ efforts to dodge taxes. For example,
the concept of ‘round tripping’ – exporting FDI in order to
import it again and earn more favourable tax advantages – is
well known.
$billions % GDP equivalent
LICs 24 5.1
LMICs 107 2.2
UMICs 349 2.0
All Developing
Countries
480 2.1
Table 11: FDI (2012)
4.1 Foreign Direct Investment (FDI)
2003
2004
2005
2006
2007
2008
2009
2010
2011
2012
Figure 22: FDI ($bn)
$bn
Source: UNCTAD, Eurodad calculations
600
500
400
300
200
100
0
2003
2004
2005
2006
2007
2008
2009
2010
2011
2012
Figure 23: FDI (%GDP)
% GDP equivalent
6
5
4
3
2
1
0
LIC LMIC UMIC Total developing country
27. 27
The State of Finance for Developing Countries, 2014
Trends and distribution
• Portfolio equity flows have proven to
be highly pro-cyclical and volatile, rising
before the global financial crisis and then
collapsing into negative figures in 2008,
as investors sold stocks and shares in
response to their own problems at home.
• In LMICs and UMICs, portfolio equity flows
are concentrated in a small number of
countries. For example, India and Nigeria
accounted for $23 billion of the $38 billion
LMIC total in 2012, while China and Mexico
accounted for $40 billion of the $66 billion
UMIC total in 2012. As LICs tend to have
small stock markets, portfolio equity as a
share of GDP has been tiny.
Volatility
• Portfolio equity flows tend to be the
most volatile and pro-cyclical of all
financial flows, along with short-term
debt, as they respond rapidly to investors’
changing perceptions of risk and reward,
and can therefore become ‘hot money’
flows, which can cause and exacerbate
financial crises. This is because stocks
and shares are highly liquid assets, and
hence are easily sold should the investor
face problems at home or lose faith in the
economy in which they have invested.
Figure 25 shows how volatile these flows
can be for individual countries.
• As Figure 24 shows, private equity
inflows reversed in response to the global
financial crises, as investors sold stocks
and shares to bring money home, and
have been volatile since then. UNDESA
argues that this volatility has been partly
due to investors’ changing opinions about
the investment climate in developed
countries.45
• For this reason, an increasing number
of developing countries are re-imposing
capital controls to prevent sudden
outflows or excessive inflows from
causing macro-economic problems.46
About the data
• The data is from the World Bank estimates of portfolio
equity inflows, which record the buying and selling of stocks
and shares and other equity assets in developing countries
by foreign investors. As noted above, it is distinguished
from FDI by a cut-off point of 10% ownership – if the investor
owns less than 10% of the company, it is counted as
portfolio equity.
• The data includes both purchases and sales of stocks and
shares, and hence reflects the extent to which foreign investors
increased their holdings of developing country equities.
$billions % GDP equivalent
LICs 0.1 -0.1
LMICs 38 1.5
UMICs 66 0.5
All Developing
Countries
104 0.6
Table 12: Portfolio Equity (2012)
4.2 Portfolio equity
150
100
50
0
-50
2003
2004
2005
2006
2007
2008
2009
2010
2011
2112
Figure 24: Portfolio Equity ($bn)
$bns
Source: World Bank, Eurodad calculations
2003
2004
2005
2006
2007
2008
2009
2010
2011
2012
Figure 25: Portfolio Equity (%GDP)
% GDP equivalent
2.5
2
1.5
1
0.5
0
-0.5
-1.0
LIC LMIC UMIC Total developing country
1994
1996
1998
2000
2002
2004
2006
2008
2010
2012
Figure 26: Portfolio Equity, selected
countries ($bn)
$bns
4
3
2
1
0
-1
-2
-3
-4
-5
-6
Egypt, Arab Rep. Indonesia Philippines
World Bank, Eurodad calculations
28. 28
The State of Finance for Developing Countries, 2014
Development Finance Institutions
(DFIs) are government-controlled
institutions that invest in private-sector
projects in developing countries. They
include the private sector arms of the
multilateral development banks, such as
the International Finance Corporation
(IFC) of the World Bank Group (WBG).
There are also bilateral DFIs linked to
donor country governments. In Europe,
15 bilateral DFIs are members of the
Association of European Development
Finance Institutions (EDFI).
We have not examined these
institutions in detail in this report. This
is because it is not currently possible to
disentangle their activities from other
existing flows, principally FDI, but also
including OOFs and ODA, and also
because there is a limited amount of
data available.
According to a report published by
the IFC in 2011, the joint financial
commitments of 31 DFIs, including
bilateral and multilateral institutions,
increased from $10 billion in 2002
to over $40 billion per year in 2010.
However, commitments do not always
translate into disbursements, and it
is not clear how much of this money
actually flowed to developing countries.
We will attempt to produce a more
detailed analysis in future editions.
Box 2:
Estimating lending by
Development Finance
Institutions (DFIs)
29. The State of Finance for Developing Countries, 2014
Scale and trends of different resources
5International not-for-
profit flows
Summary
Remittances increased from just over $130 billion
in 2003 to more than $350 billion in 2012, although
this may be due to improvements in data collection.
They are highly concentrated in a small number of
countries.
Remittances are particularly important in LICS and
LMICs; they represented 7% of GDP in LICs and 4.6%
in LMICs in 2012.
Charitable flows remain relatively small – around
$30 billion in 2012, or 0.13% of developing country
GDP.
29
30. 30
The State of Finance for Developing Countries, 2014
Trends, distribution and risk
• The scale of the flows is small – around
$30 billion, or 0.13% of developing
country GDP in 2012. Although it has
been growing in absolute terms, up from
$10 billion in 2003 – it has been shrinking
as a proportion of developing country
GDP, down from 0.16% in 2003, as Figure
27 shows.
• However, this may paint an inaccurate
picture – if the majority is directed to
LICs, as is the case for net ODA received,
it may be a more important share of GDP
in those countries.
• The Hudson Institute provides alternative
statistics, which put the figure at $59
billion in 2011.47
However, this is not a
reliable estimate of actual transfers
as it includes many expenditures in
developed countries, such as volunteer
time. Development Initiatives provided
an alternative estimate of ‘private
development assistance’ of $45 billion
annually.48
Volatility
• It is not possible to estimate volatility
given the paucity of the data.
About the data
• The data, from the OECD, records flows from donor countries
to developing countries by NGOs, private foundations and
similar bodies.
• It includes expenditure in donor countries, and there is no
measure of how much actually reaches developing countries.
It is also therefore impossible to estimate how much went to
different categories of country.
$billions % GDP equivalent
All Developing
Countries
30 0.1
Table 13: Charitable flows (2012)
5.1 Charitable flows
2003
2004
2005
2006
2007
2008
2009
2010
2011
2012
Figure 27: Charitable flows as a percentage of
developing country GDP
% GDP
0.20
0.15
0.10
0.5
0
31. 31
The State of Finance for Developing Countries, 2014
Trends and distribution
• Remittances have been rising strongly
and steadily for all categories of
developing countries over the past
decade, from just over $130 billion in
2003 to over $350 billion in 2012, as
Figure 28 shows.
• They are an important resource,
particularly in LICS and LMICs, where
they represent a significant share of GDP
– 7% in LICs and 4.6% in LMICs in 2012.
However, as remittances tend to be highly
concentrated in certain countries, this
means that some countries are heavily
dependent on remittances. According
to World Bank estimates, in 2012, 21
countries had inflows of remittances
exceeding 10% of GDP.49
• The most significant changes have
occurred in LICs, where remittances
have risen from the equivalent of 4.8% of
GDP in 2003 to 7% of GDP. In LMICS and
UMICS, remittances have been falling as
a share of GDP, despite rising in absolute
terms, because of GDP increases.
• However, a recent paper suggests that
rises in remittances have not been
driven by changes in migration patterns,
but rather by improvements in data
collection.50
If this is true, it would mean
that remittances have played a much
more important role in some developing
countries for the past decade than the
official figures suggest.
• It is important to note that remittance
transfers are dominated by a relatively
small number of countries, as they
depend on migration patterns. For
example, in 2012, Bangladesh accounted
for $14 billion of the $29 billion LIC total,
while five countries accounted for $147
billion of the $200 billion LMIC total.51
• A significant portion of remittances may
be lost during transfer. Sub-Saharan
Africa is particularly badly affected, with
remittance costs in the first quarter of
2014 estimated by the World Bank at a
little under 12%.52
Volatility
• Remittances have proved to be stable
and counter-cyclical as a whole, rising
steadily, including after the global
financial crisis. However, it is not clear
whether this is the case on a country
level.53
About the data
• Remittances data, from the World Bank, records transfers
from people living or working overseas to their families and
friends, or to invest at home.
5.2 Remittances
$billions % GDP equivalent
LICs 29 7.0
LMICs 200 4.6
UMICs 121 0.8
All Developing
Countries
350 1.8
Table 14: Remittances (2012)
400
350
300
250
200
150
100
50
0
2003
2004
2005
2006
2007
2008
2009
2010
2011
2012
Figure 28: Total Remittance inflows
$bns
Source: World Bank, Eurodad calculations LIC LMIC UMIC Total developing country
2003
2004
2005
2006
2007
2008
2009
2010
2011
2012
Figure 29: Remittances
% GDP equivalent
9
8
7
6
5
4
3
2
1
0
32. The State of Finance for Developing Countries, 2014
Scale and trends of different resources
6Debt-creating
flows
Summary
Since 2006, there has been a sharp increase in new
debt taken on by developing countries, driven by
LMICs and UMICs.
Developing country debt stocks reached their
highest level ever in 2012 – $4.8 trillion, according
to the World Bank – which was largely driven by
increases in indebtedness by private actors.54
LIC governments have remained heavy net
borrowers throughout the period, averaging
between 1.3% and 2% of GDP in additional long-term
borrowing between 2003 and 2012.
32
33. 33
The State of Finance for Developing Countries, 2014
Trends and distribution
• As Figure 30 shows, up to 2006,
developing country governments were
taking on low levels of additional debt, or
paying off existing debts. However, since
2006, there has been a sharp increase
in additional debt taken on. This means
that additional borrowing minus capital
repayments for developing countries as a
whole rose from a negative figure in 2006
(more capital being repaid than new
loans taken on) to close to $170 billion in
2012. This was caused by sharp increases
in borrowing, by LMICs and UMICs, as
Figure 31 shows.
• However, the most telling figure is that
LIC governments have remained heavy
long-term borrowers throughout the
period, averaging between 1.3% and 2%
of GDP in additional borrowing between
2003 and 2012.
• This increased public borrowing by LMICs
and UMICs, and consistently high levels
by LICs, has largely come from private
sources, accounting for 90% of net debt
flows (public and private) in 2012.55
Volatility
• The World Bank’s latest International
Debt Statistics56
report shows
that, although developing country
governments’ debt levels are low by
historical standards, they are increasing,
in particular through the issue of
sovereign bonds.
About the data
• The data, from the World Bank, measures long-term
loans (more than a year) received by developing country
governments minus repayment of principal on existing loans.
Interest repayments are recorded for all categories of loans
together in section 2.4.
$billions % GDP equivalent
LICs 8 1.7
LMICs 51 1.0
UMICs 109 0.6
All Developing
Countries
168 0.8
Table 15: Net public external borrowing, long term (2012)
6.1 Long-term foreign borrowing –
public
Figure 30: Public external borrowing, long term ($bn)
$bns
Source: World Bank, Eurodad calculations LIC LMIC UMIC Total developing country
200
150
100
50
0
-50
2003
2004
2005
2006
2007
2008
2009
2010
2011
2012
2003
2004
2005
2006
2007
2008
2009
2010
2011
2012
Figure 31: Public external borrowing, long term (%GDP)
% GDP equivalent
2.5
2
1.5
1
0.5
0
-0.5
-1
• According to the World Bank and IMF, by
November 2014 there were two LICs in
debt distress57
and 15 LICs at high risk of
debt distress (up from 13 in August the
same year) and a further 29 at moderate
risk of debt distress (up from 27 in
August the same year).58
34. The State of Finance for Developing Countries, 2014
34
Trends and distribution
• Long-term borrowing by private actors
has been a significant flow, reaching 1.8%
of developing country GDP in 2006 and
2007.
• This represents a very large cumulative
increase in private debt for LICs over this
period. Developing country debt stocks
reached their highest level ever in 2012 –
$4.8 trillion, according to the World Bank
– which was largely driven by increases in
indebtedness by private actors.59
• Ultimately, as recent experience shows,
private debts can become public debts
during times of crisis. This problem
of ‘contingent liabilities’ has been a
frequent feature of debt crises, and is one
reason why financial crises are normally
succeeded by sovereign debt crises, as
governments inevitably bail out stricken
financial institutions, often at great cost.60
For example, the fiscal cost of the 1997
Indonesian banking crisis was close to
50% of the country’s GDP.61
Volatility
• Private debt has proved to be a volatile
flow – as witnessed by the crash in
2009-10 following the global financial
crisis, caused by decreased willingness
or ability of developed country financial
institutions to lend over the long term to
developing country private actors.
• As a recent Eurodad report has pointed
out, increases in private debt have played
a key role in previous crises, including the
Asian financial crisis at the end of the last
century, and the recent global financial
crisis.62
About the data
• The data, from the World Bank, shows long-term private
borrowing, minus repayment of principal on existing loans.
This is private debt that is not guaranteed by a public
body, and has a maturity of more than one year. Interest
repayments are recorded for all categories of loans together
in section 2.4 above.
$billions % GDP equivalent
LICs 1 2.2
LMICs 44 0.9
UMICs 108 0.7
All Developing
Countries
154 0.7
Table 16: Net private external borrowing, long term (2012)
6.2 Private external borrowing –
long term2003
2004
2005
2006
2007
2008
2009
2010
2011
2012
Figure 32: Private external borrowing, long term ($bn)
$bns
250
200
150
100
50
0
-50
Source: World Bank, Eurodad calculations
2003
2004
2005
2006
2007
2008
2009
2010
2011
2012
Figure 33: Long term foreign borrowing – private (%GDP)
% GDP equivalent
2.5
2
1.5
1
.5
0
-0.5
LIC LMIC UMIC Total developing country
35. 35
The State of Finance for Developing Countries, 2014
Trends and distribution
• Short-term foreign borrowing by
developing countries has followed the
pattern of long-term private borrowing,
rising before the global financial crisis,
slumping to around zero in 2008 and
then rising again since.
• As a percentage of GDP, it has been an
important flow for UMICs in particular,
exceeding 1% in four out of ten years
between 2003 and 2012.
• In LICs, it has been a negative flow in four
out of ten years between 2003 and 2012,
meaning that they have frequently been
paying back more loans than they take
on. In LMICs and UMICs, of course, the
consistently net positive figures mean
that they are taking on more loans than
they are paying back.
Volatility
• Like private equity, short-term
borrowing can be particularly high risk
for developing countries, as it needs
to be paid back over a rapid timescale.
Whether or not lenders are willing to
roll over loans will depend upon their
assessment of the borrowing country.
As the Figures 34 and 35 show, during
times of crisis, short-term credit can dry
up, causing problems for companies that
have relied on it.
About the data
• The data, from the World Bank, shows short-term borrowing
minus repayment of principal on existing loans. These are
loans with a maturity of less than one year. It includes both
public and private borrowing. Interest repayments are
recorded for all categories of loans together in section
2.4 above.
$billions % GDP equivalent
LICs -1 -0.3
LMICs 28 0.6
UMICs 76 0.4
All Developing
Countries
103 0.5
Table 17: Short-term foreign borrowing (public private), 2012
6.3 Short-term foreign borrowing
– public private2003
2004
2005
2006
2007
2008
2009
2010
2011
2012
Figure 34: Short-term foreign borrowing (public
private) ($bn)
$bns
300
250
200
150
100
50
0
-50
Figure 35: Short-term foreign borrowing (public
private) (%GDP)
% GDP equivalent
2.0
1.5
1.0
0.5
0
-0.5
Source: World Bank, Eurodad calculations LIC LMIC UMIC Total developing country
2003
2004
2005
2006
2007
2008
2009
2010
2011
2012
36. The State of Finance for Developing Countries, 2014
In this report, we have focused on the scale,
distribution among countries and volatility
of different financing resources. However,
the quality of different resources matters as
much as, if not more than, their quantity. We
will focus on these issues in future editions
of this report. Previous Eurodad research
highlighted several of these, as summarised
below.63
Macro-economic risks
Inflows and outflows of resources affect a
countries’ exchange rate directly, but also
affect the confidence of investors in the
country. For example, ‘hot money’ outflows
of short-term investment and lending
caused by perceived problems in the host
economy, or issues in the home economy,
can trigger severe crises in the currency
market and financial sector. These have
damaging and often long-term impacts on
the real economy. This type of panic exit of
capital triggered the Asian financial crisis of
1997-98 and was a major mechanism for the
transmission of the global financial crisis to
developing countries.
Accountability and transparency
All of the resources discussed would
benefit from significant improvements in
their accountability and transparency. Civil
society organisations have often focused
on public flows – aid and domestic public
resources – precisely because some notion of
accountability and transparency is expected
of the actors involved, even though they
may not live up to those expectations.
Efforts made to make private resources
more accountable and transparent, such as
working on minimum social or environmental
standards, have been less successful.
Impacts on domestic politics
The domestic political impacts of resource
flows can be extremely important for poverty
reduction and sustainable development. For
example, the conditionalities attached to
lending by IFIs proved highly controversial.
In addition, the strong influence of
external actors on domestic policy-making
undermines the space for developing
countries to set their own policy agendas,
and for citizens of those countries to hold
their governments to account.
It is also important to note that the process
of international economic liberalisation
over recent decades, and the growth in the
offshore economy, have provided incentives
for governments to engage in a ‘race to
the bottom’ on taxation and on standards
expected of companies.64
Contributions to sustainable
development
Ultimately, the impacts of different resources
on poverty reduction depend on the overall
macro-economic, political and environmental
conditions in each individual country. It may
be worth distinguishing between two spheres
where resources may be needed. In the first
sphere of public goods – including basic
services, the environment, natural resources
and security – there is a greater demand
for public sources of finance. However,
in the area of productive development –
the financing of infrastructure, business
expansion and so on – the debate is highly
contested. Ultimately, impacts on poverty
reduction in this sphere depend both on how
much real economic growth is created, how
sustainable this is and how the proceeds of
that growth are distributed.
Other important
characteristics of available
resources
36
37. As the United Nations gears up for its
critically important summit on financing for
development (FfD) in Addis Ababa in 2015, it
will be important to have a clear-eyed view
of the current scale of all different financing
resources available. It is hoped that this
report will make a significant contribution to
that understanding.
In addition to giving a comprehensive
analysis of all types of resources available
and classifying them into sensible groups,
we have attempted to add important lenses
to our analysis that are not available in other
reviews of the data.
First, we have examined the data as a
percentage of GDP, which gives a far better
impression of the importance of different
resources from the perspective of the
developing country than just examining
total numbers. Second, we have examined
the data over a ten-year time frame, which
allows us to see trends and examine overall
volatility. For future editions we will consider
extending the time series further backwards,
and providing more commentary on the
causes of the trends.
Finally, we have examined the data by
different categories of developing countries,
which has helped to highlight the particular
problems faced by low-income countries.
These countries are far more affected by
external resource inflows, as well as losses
of domestic resources, than developing
countries with higher levels of income.
The most striking finding of the report is that
losses of financial resources by developing
countries have been more than double the
inflows of new financial resources since the
financial crisis. Lost resources have been
close to or above 10% of GDP for developing
countries as a whole since 2008.
This single statistic helps to highlight
an important truth: the international
economic and financial system is currently
failing developing countries. Readers
are encouraged to examine the set of
recommendations endorsed by Eurodad and
over 100 other civil society organisations
(CSOs),65
which set out how the governments
of the world can begin to change this at the
FfD summit next year.
Conclusions 37
38. 38
The State of Finance for Developing Countries, 2014
Endnotes
1 UN. (2014). Report of the Intergovernmental
Committee of Experts on Sustainable Development
Financing. New York. UN.
2 There is double counting with a portion of a number
of external flows, most significantly FDI (section B4.1),
private external borrowing (sections 6.2 and 6.3) and
aid (section 3.1).
3 By comparison, the figure for developed countries was
under 20% in 2012.
4 Figures are Eurodad calculations, using UN population
figures, and World Bank GFCF figures.
5 Unfortunately, World Bank data that splits domestic
investment between public and private sources is
only available for LICs and LMICs at present. This may
be an underestimate, as it is not clear whether public
enterprises are included in the World Bank’s private
investment figures.
6 2012 figures not yet available for all income groups.
7 Eurodad analysis of World Bank figures, using UN
population estimates.
8 See http://www.imf.org/external/pubs/ft/survey/
so/2012/POL032812A.htm
9 Figures for 2012 are not yet published.
10 Kar, Dev and LeBlanc, Brian. (2013). Illicit Financial
Flows from Developing Countries: 2002-2011.
Washington, D.C. Global Financial Integrity, p.1.
11 See http://www.undp.org/content/undp/en/home/
librarypage/democratic-governance/anti-corruption/
a-snapshot-of-illicit-financial-flows-from-eight-
developing-coun/
12 Murphy, Richard. (2012). Closing the European Tax
Gap. UK. Tax Research UK.
13 IMF. (2014). Spillovers in international corporate
taxation. Washington D.C. IMF.
14 TJN has developed the Financial Secrecy Index to
define such jurisdictions that provide: “(1) anonymity
for them, their families, and their business and political
dealings; (2) the ability to minimize the net present
value of future taxes…; (3) investment management…;
(4) ability to easily access and manage their wealth
from anywhere on the planet; (5) secure places to
hang out, hide out and enjoy life; and (6) iron clad
financial security.” Henry, James. (2012). The price of
offshore revisited. London. Tax Justice Network, p.10.
15 Henry, James. (2012). The price of offshore revisited.
London. Tax Justice Network.
16 UNDESA. (2012). World Economic Situation and
Prospects 2012. New York. UN.
17 Timor Leste, Libya, Mongolia, Mauritania, Bhutan,
Lebanon, Peru, Vietnam, Moldova, Comoros, Bolivia,
Bulgaria, Cambodia, Solomon Islands, Yemen and
Niger.
18 Eurodad. (2010). The cost of reserves. Brussels.
Eurodad.
19 The number of countries for which repatriated profit
data is available is different from the number for which
FDI data is available, which means that the GDP base
for comparison is different. This explains why the
figures for repatriated profit as % GDP are higher than
those for FDI as a percentage of GDP, even when the
absolute totals are lower.
20 Given the fact that a proportion of FDI is also the
reinvestment of earnings from within the host
(developing) country, this suggests that the net
investment benefit in terms of new money entering
the country is also lower.
21 UNDESA. (2014), World Economic Situation and
Prospects 2014. New York. UN.
22 “Net FDI in the reporting economy from foreign
sources less net FDI by the reporting economy to the
rest of the world” http://data.worldbank.org/indicator/
BN.KLT.DINV.CD?display=Figure
23 This may be due to the fact that the World Bank does
not take the same care as the UN Conference on Trade
and Development (UNCTAD) to remove distortions
caused by tax dodging practices.
24 A portion of CPA is only allocated by the DAC on a
regional basis ($6 billion in 2012), which explains why
the total for All Developing Countries is higher than
the sum of LICs+LMICs+UMICs.
25 Humanitarian aid and debt relief.
26 Administrative costs, imputed student costs,
promotion of development awareness and research
and refugees in donor countries.
27 Food aid and aid from local governments.
28 Core funding of non-governmental organisations
(NGOs).
29 CPA covers flows from 29 DAC members, 25 of
the largest multilateral agencies, 3 OECD non DAC
members and 3 non OECD members.
30 United Nations. (2014). Trends and progress in
international development cooperation
Report of the Secretary-General. New York. UN.
31 UNCTAD. (2009). Enhancing the role of domestic
financial resources in Africa’s development. Geneva,
UN, p.7.
32 Griffiths, Jesse. (2013). Global Financial Flows, Aid and
Development. Brussels. CONCORD.
33 Gates, Bill. (2011). Innovation With Impact: Financing
21st Century Development, p.13.
34 See http://www.consilium.europa.eu/uedocs/cms_
data/docs/pressdata/en/ecofin/142513.pdf, Financial
Transaction Tax, p.9.
35 UNDESA. (2012). World Economic and Social Survey
2012. In Search of New Development Finance.
36 World Bank Group. (2011). Mobilizing Climate Finance
A Paper Prepared at the Request of G20 Finance
Ministers.
37 See http://www.brettonwoodsproject.org/art-564159
38 UNDESA. (2012). World Economic and Social Survey
2012. In Search of New Development Finance.
39 As noted above, these will cross over with the
domestic investment figures (section 1.1).
40 Mozambique, Myanmar, Congo and Tanzania.
41 Again, this reflects patterns in LMICS and UMICS – in
LICs, the ratio was relatively low and stable at between
0.1% and 0.2% of GDP until an increase in 2011 and
2012, when it reached 0.4%, still far smaller than
inflows.
42 Akyüz, Yilmaz. (2012). Financial Crisis and Global
Imbalances: A Development Perspective. South Centre.
Geneva.
43 Bhinda, Nils Martin, Matthew. (2010). Private capital
flows to low-income countries. Dealing with boom and
bust.
44 Korinek, Anton. (2011). Hot Money and Serial Financial
Crises, IMF Economic Review.
45 UNDESA. (2013). World Economic Situation and
Prospects 2013. New York. UN, pp.67-68.
46 Chowla, Peter. (2011). Time for a New Consensus.
Regulating Financial Flows for Stability and
Development. London. Bretton Woods Project.
47 Hudson Institute. (2014). Index of Global Philanthropy
2013.
48 Hénon, Sarah. (2014). Measuring private development
assistance. Emerging trends and challenges. Bristol.
Development Initiatives.
49 See http://data.worldbank.org/indicator/BX.TRF.
PWKR.DT.GD.ZS (accessed 9 September 2014).
50 Clemens, Michael McKenzie, David. (2014). ‘Why
Don’t Remittances Appear to Affect Growth?’ World
Bank Policy Research Working Paper No. 6856.
Washington D.C. World Bank.
51 India, Philippines, Nigeria, Egypt and Pakistan.
52 See https://remittanceprices.worldbank.org/sites/
default/files/RPW_Report_Mar2014.pdf
53 Neagu, I and Schiff, M. (2009). Remittance Stability,
Cyclicality and Stabilizing Impact in Developing
Countries. Washington, D.C. World Bank suggest they
are pro-cyclical, but less so than FDI.
54 World Bank. (2014). International Debt Statistics 2014.
Washington D.C. World Bank.
55 World Bank. (2014). International Debt Statistics 2014.
Washington, D.C. World Bank, p.1.
56 World Bank. (2014). International Debt Statistics 2014.
Washington, D.C. World Bank.
57 Sudan and Zimbabwe – see http://www.imf.org/
external/pubs/ft/dsa/dsalist.pdf
58 See https://www.imf.org/external/pubs/ft/dsa/dsalist.
pdf
59 World Bank. (2014). International Debt Statistics 2014.
Washington, D.C. World Bank.
60 Rogoff, Eric Reinhart, Carmen. (2011). This time is
different. Eight Centuries of Financial Folly.
61 Ellmers, Bodo. (2013). The new debt vulnerabilities.
Brussels. Eurodad, p.19.
62 Ellmers, Bodo. (2013). The new debt vulnerabilities.
Brussels. Eurodad.
63 Griffiths, Jesse. (2013). Global financial flows, aid and
development. Brussels. CONCORD.
64 Zambia is a case in point. See Mwambwa et al. (2010).
A Fool’s Paradise? Zambia’s Mining Tax Regime, http://
www.ctpd.org.zm/index.php?option=com_phocad
ownloadview=categorydownload=8:ctpd_fools-
paradise_zambia-mining-tax-regime-briefing-paperi
d=4:publicationsItemid=119.
65 137 CSOs (2014). UN Financing for Development
negotiations: What outcomes should be agreed in
Addis Ababa in 2015?
39. Eurodad
The European Network on Debt and
Development is a specialist network analysing
and advocating on official development
finance policies. It has 47 member groups in 19
countries. Its roles are to:
• research complex development finance
policy issues
• synthesise and exchange NGO and official
information and intelligence
• facilitate meetings and processes which
improve concerted advocacy action by
NGOs across Europe and in the South.
Eurodad pushes for policies that support pro-
poor and democratically-defined sustainable
development strategies. We support the
empowerment of Southern people to chart their
own path towards development and ending
poverty. We seek appropriate development
financing, a lasting and sustainable solution
to the debt crisis and a stable international
financial system conducive to development.
www.eurodad.org
Acknowledgements
This paper was written by Jesse Griffiths.
Extremely valuable research support
was provided by Gemma Pinto, Tiago
Stichelmans, Giulia Carpentieri, Hernán
Cortés and Justyna Różańska. Special
thanks are due to the many colleagues
who provided vital comments on early
drafts, including:
• Hernán Cortés, Bodo Ellmers, Christian
Hallum, María José Romero, Jeroen
Kwakkenbos, Tove Ryding, and Mathieu
Vervynckt (Eurodad)
• Mark Herkenrath (Alliance Sud)
• Tim Strawson (Development Initiatives)
• Romilly Greenhill and Gideon Rabinowitz
(ODI)
• Matthew Martin (DFI)
• Eero Saue (European Commission)
• Momodou Touray (AFRODAD)
• David Hillman (Stamp Out Poverty)
• Alex Cobham (CGD)
• David McNair (One)
• Simon Scott (OECD)
• Tom Cardomone (GFI).
Any errors or omissions are the
responsibility of the author.
Design: studio@base-eleven.com
December 2014