Tricumen / Profit Masters 091213

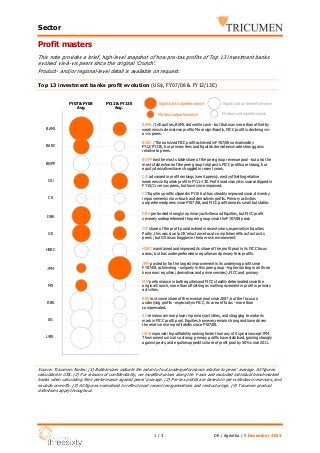
Profit masters This note provides a brief, high-level snapshot of how pre-tax profits of Top 13 investment banks evolved vis-à-vis peers since the original ‘Crunch’. Product- and/or regional-level detail is available on request. Highlights: The two banks that most improved their share of the peer group profit pool are J.P.Morgan and UBS. Uniquely among its peers, JPM improved its ranking vis-à-vis peers in all three major areas of business: primary issuance & advisory, FICC and Equities sales & trading. UBS performed strongly in primary activities, and has upped its share of Equities profit pool by 50% since 2011. Bank of America Merrill Lynch was knocked off the #1 spot and has been losing ground in recent years, especially in FICC. Similarly, Deutsche Bank‘s decline is largely due to underperformance in FICC. Goldman Sachs lost some ground in recent years; it appears to be struggling in the low-risk/client-centric environment.

Recommended
Recommended
More Related Content
More from Tricumen Ltd
More from Tricumen Ltd (20)
Recently uploaded
Recently uploaded (20)
Tricumen / Profit Masters 091213
- 1. Sector Profit masters This note provides a brief, high-level snapshot of how pre-tax profits of Top 13 investment banks evolved vis-à-vis peers since the original ‘Crunch’. Product- and/or regional-level detail is available on request. Top 13 investment banks profit evolution (US$, FY07/08 & FY12/13E) FY12 & FY13E Avg. FY07 & FY08 Avg. Significant outperformance Modest outperformance 2 Significant underperformance Modest underperformance BAML 3 BAML / In Equities, BAML did well in cash - but that was more than offset by weakness in derivatives profits. More significantly, FICC profit is declining visa-vis peers. BARC 4 BARC / The outs ized FICC profit achieved in FY07/08 normalised by FY12/FY13E, but primary fees and Equities derivatives made s trong gains relative to peers. BNPP 5 BNPP has the most stable s hare of the peer group revenue pool - but also the most s table share of the peer group total costs. FICC profits are strong, but equity derivatives have struggled in recent years. Citi 6 Citi advanced in profit rankings (s ee Appenix), eas ily offsetting relative weakness in Equities profit in FY11-13E. Profit in advisory & issuance dipped in FY10/11 versus peers, but have s ince improved. CS 7 CS' Equities profits slipped in FY10 but has s teadily improved s ince, driven by improvements in low-touch and derivatives profits. Primary activities outperformed peers since FY07/08, and FICC profit remains small but stable. DBK 8 DBK performed strongly in primary activities and Equities, but FICC profit severely underperformed the peer group s ince the FY07/08 peak. GS 9 GS' share of the profit pool declined in recent years, especially in Equities. Partly, this was due to GS' reluctance to cut comp & benefits as fast as its peers ; but GS also struggles in the low-risk environment. HSBC maintained and improved its s hare of the profit pool in its FICC focus areas; but has underperformed in equities and primary fees profits. HSBC10 JPM 11 JPM posted by far the largest improvement in its underlying profit since FY07/08, achieveing - uniquely in this peer group - higher ranking in all three key areas: equities (derivatives and prime s ervices), FICC and primary. MS 12 MS' performance in both equities and FICC steadily deteriorated since the original Crunch, more than offsetting a small improvement in profit in primary activities. RBS 13 RBS lost s ome share of the revenue pool s ince 2007, but the focus on underlying profits - especially in FICC, its area of focus - more than compensated. SG 14 SG remains a minor player in primary activities, and strugging to make its mark in FICC profit pool. Equities, however, remain strong and have driven the relative rise in profitability since FY07/08. UBS improved its profitability ranking faster than any of its peers except JPM. The momentum is also strong: primary profits have stabilised, gaining strongly against peers, and equities upped its share of profit pool by 50% since 2011. UBS 15 16 0.25 0.5 0.75 1 1.25 Source: Tricumen. Notes: (1) Bubble sizes indicate the extent of out/underperformance relative to peers’ average. All figures calculated in US$. (2) For reasons of confidentiality, we modified values along the Y-axis and excluded individual benchmarked banks when calculating their performance against peers’ average. (2) Pre-tax profits are based on pre-writedown revenues, and exclude one-offs. (3) All figures normalised to reflect most recent reorganisations and restructurings. (4) Tricumen product definitions apply throughout. 1/3 DK / Agentha / 9 December 2013
- 2. Sector Appendix: Operating Pre-Tax Profit (Global) Capital Markets: TOTAL Rank FY07 & FY12 & FY08 Avg. FY13E Avg. Primary Rank FY12 & FY13E Avg. / FY07 & FY08 Avg. (Movement) FY07 & FY12 & FY08 Avg. FY13E Avg. JPM #7 #1 JPM #2 #1 Citi #5 #2 BAML #1 #2 GS #3 #3 CS #5 #3 BAML #1 #4 DBK #8 #4 DBK #2 #5 MS #6 #5 UBS #11 #6 GS #7 #6 BARC #4 #7 Citi #4 #7 CS #8 #8 BARC #12 #8 #13 FY12 & FY13E Avg. / FY07 & FY08 Avg. (Movement) #9 MS #6 #9 UBS RBS #13 #10 RBS #3 #10 HSBC #9 #11 SG #10 #11 SG #12 #12 BNPP #11 #12 BNPP #10 #13 HSBC #9 #13 FICC Equities Rank FY07 & FY12 & FY08 Avg. FY13E Avg. Rank FY12 & FY13E Avg. / FY07 & FY08 Avg. (Movement) FY07 & FY12 & FY08 Avg. FY13E Avg. Citi #4 #1 GS #1 #1 JPM #5 #2 JPM #12 #2 BAML #3 #3 UBS #3 #3 DBK #2 #4 DBK #4 #4 GS #6 #5 BARC #5 #5 HSBC #9 #6 SG #10 #6 RBS #13 #7 MS #2 #7 BARC #1 #8 BAML #8 #8 UBS #10 #9 CS #6 #9 SG #12 #10 RBS #11 #10 BNPP #7 #11 BNPP #9 #11 CS #11 #12 HSBC #13 #12 MS #8 #13 Citi #7 FY12 & FY13E Avg. / FY07 & FY08 Avg. (Movement) #13 Source: Tricumen. Notes: (1) Green arrows indicate top-quartile move up in rankings relative to the entire peer group, in US$; conversely, red arrows indicate extreme underperformance relative to peers. Yellow arrows indicate mid-quartile up/down ranking dynamics. Each product category is calculated separately. (2) Pre-tax profits are based on pre-writedown revenues, and exclude one-offs. (3) All figures normalised to reflect most recent reorganisations and restructurings. (4) Tricumen product definitions apply throughout. 2/3 DK / Agentha / 9 December 2013
- 3. Sector About Tricumen Tricumen was founded in 2008. It quickly become a strong provider of diversified market intelligence across the capital markets and has since expanded into transaction and corporate banking coverage. Tricumen’s data has been used by many of the world’s leading investment banks as well as strategy consulting firms, investment managers and ‘blue chip’ corporations. Situated near Cambridge in the UK, Tricumen is almost exclusively staffed with senior individuals with an extensive track record of either working for or analysing banks; and boasts what we believe is the largest capital markets-focused research network of its peer group. Notes & Caveats This report and the information contained herein may not be reproduced or distributed in the whole or in part without the prior written consent of Tricumen Limited. Such consent is often given, provided that the information released is sourced to Tricumen and that it does not prejudice Tricumen Limited’s business or compromise the company’s ability to analyse the financial markets. Tricumen Limited has used all reasonable care in writing, editing and presenting the information found in this report. All reasonable effort has been made to ensure the information supplied is accurate and not misleading. For the purposes of cross- market comparison, all numerical data is normalised in accordance to Tricumen Limited’s proprietary product classification. Fully-researched dataset may contain margin of error of +/-10%; for modelled datasets, this margin may be wider. The information and commentary provided in this report has been compiled for informational purposes only. We recommend that independent advice and enquiries should be sought before acting upon it. Readers should not rely on this information for legal, accounting, investment, or similar purposes. No part of this report constitutes investment advice, any form of recommendation, or a solicitation to buy or sell any instrument or to engage in any trading or investment activity or strategy. Tricumen Limited does not provide investment advice or personal recommendation nor will it be deemed to have done so. Tricumen Limited makes no representation, guarantee or warranty as to the suitability, accuracy or completeness of the report or the information therein. Tricumen Limited assumes no responsibility for information contained in this report and disclaims all liability arising from negligence or otherwise in respect of such information. Tricumen Limited is not liable for any damages arising in contract, tort or otherwise from the use of or inability to use this report or any material contained in it, or from any action or decision taken as a result of using the report. 3/3 DK / Agentha / 9 December 2013