Beginners Guide to TikTok for Search - Rachel Pearson - We are Tilt __ Bright...
cmpe557-slopedSandpile-Hopper
1. A SLOPED SANDPILE MODEL
CORBIN HOPPER
1. Introduction
A deterministic cellular automata is pro-
posed to model a sandpile on a slope. The
proposed formulation allows a slant along
one axis. Increasing slope seems to introduce
newfound instabilities. The model reorga-
nizes by horizontally displacing low height
cascades across walls of high height. How-
ever, the model falls short of a natural de-
scription of sand movement, especially when
moving up a slope.
2. Rules
As in previous models, when a given tile
reaches a critical height, it distribute sand
to its neighbors. 1 Each patch includes 4
adjacent tiles in its neighborhood. Here the
critical height is 100, so that the grains can
be distributed in a number of asymmetrical
ways. Importantly, this model can also tilt
in slope along one axis along 180 degrees,
where x is an input number in radians:
Up: 25(sin(x) + 1)2
Down: 25(−sin(x) + 1)2
Horizontal: 25cos2x
Self: -100
These formulas were largely derived from
linear regression analysis based on points of
interest (such as all producing 25 when no
slope is present). Additionally, if Up, Down,
and Horizontal are less than 100, the remain-
ing grains are distributed in the direction op-
posite to the slope (in addition to the previ-
ous formulas):
Up < Down
Up: 100 − (Up + Down + Horizontal)
Down < Up
Down: 100 − (Up + Down + Horizontal)
Sand is always dropped on the same tile.
All tiles are updated synchronously. Thus
they only collapse if they begin the turn with
over 100 grains of sand. All gains (from
falling neighbors) are stacked and combined
at the end of a time tick. Sand that crossed
the borders is simulated as falling off and is
no longer included in the model. One could
also view the model as a subset (that extends
to its boarders) of a larger field.
3. Discussion
The model preforms as expected in a num-
ber of baseline cases. With a slope of ±0.5
the sand slides off in a completely vertical
line (although in clumps of 100 due to model
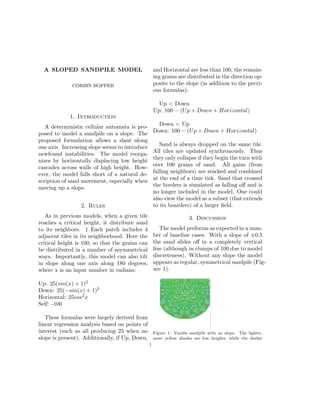
discreteness). Without any slope the model
appears as regular, symmetrical sandpile (Fig-
ure 1).
Figure 1: Vanilla sandpile with no slope. The lighter,
more yellow shades are low heights, while the darker
1
2. 2 CORBIN HOPPER
shades are higher.
The height at each tile was grouped into
lows (< 40), medium (> 40, < 80), and
highs (> 80). This revealed a switch from
primarily medium heights to predominantly
low heights around a slope of ±0.15 radi-
ans (Figure 2). Higher slopes could translate
to less stability, meaning that lower energy
states are a more stable response for the sys-
tem.
Figure 2: Change in height distributions. Top: Slope =
0.1, the adjacent graph displays the frequency of different
height groups. Bottom: slope = 0.15, note the change in
height groups, where the low heights are now the most
frequent.
This is reinforced by the dynamics of each
height group. At lower slopes they all steadily
increase. However, at higher slopes they be-
come increasingly turbulent (Figure 3). Per-
haps quickly fluctuating states are better man-
aged with a large number of low heights.
Figure 3: Change in high variability. Left: Slope = 0.1;
Right: Slope = 0.3. Both are recorded over the same
number of ticks, but the later is far less steady.
These fluctuations appear to be a result
of vertical walls that are built up. A side-
ways break tends to cause low heights to
spill out causing a sudden change in height
group frequencies (Figure 4). Lateral disper-
sion of energy may be a stabilizing solution
to vertical instability. However, it is unclear
whether this is a way to contain larger spikes
or the cause of these fluctuations in the first
place.
Figure 4: Horizontal wall break. All images are with
slope = 0.3. Left: up to tick 3400. Right: up to tick
3500, the low height tiles break horizontally out of the
wall. Center: This coincides with a dramatic spike in low
height frequency at the righthand side of the graph.
4. Further Work
This model fell short of a realistic sloped
sandpile is a few important ways. First, the
formulas have some natural fluidity, such as
sinx and cosx for the different axis. While
3. A SLOPED SANDPILE MODEL 3
the Up and Down formulas have some ap-
propriate symmetry, the three formulas do
not form inverses of one another as might be
expected. This results in a poor explanation
of movement up the slope, where it is a mix
of the earlier formula and the leftover sand.
Moreover, the memory limits of a personal
computer prevented large scale simulations.
This is particularly relevant at high slopes,
where the sandpile quickly met the model
boundaries.
Movement up the slope could be better
described. Perhaps it could be based on
the height of neighbors, seeing as real sand
would only fall ’up’ if the upwards height
was comparatively less than its other op-
tions. Further work could explore the geo-
metric dispersion of slope-induced instabil-
ity. A more continuous model might do a
better job explaining how walls that build
up in height are broken horizontally.
5. Conclusion
A preliminary model was devised to de-
scribe varying slope along one axis. This
changes how instabilities are created and dealt
with. In general an increasing slope seems to
increase turbulent fluctuations. This results
in vertical walls of high height that are liable
to cause large avalanches. Rather than en-
tirely collapsing, these walls tend to be bro-
ken laterally. Small heights of sand are then
dispersed around such walls. It is unclear
whether these dispersions are the cause of
such fluctuations or a way to avert larger
cascades.
6. Bibliography
1 Bak et al., ”Self-Organized Criticality: An Expla-
nation of 1/f Noise,” Physical Review Letters, The Amer-
ican Physical Society. 27 July, 1987.