1. Coordinated Gene Activity in Pattern Sets (CoGAPS)
Conor Kelton and John Stansfield; Faculty Mentor: Dr. Michael F. Ochs
Department of Math/Statistics, Department of Biology, The College of New Jersey
Future Work
Acknowledgements
We would like to thank Dr. Ochs and his team, Elana Fertig, Wai Lee, and Alexander Favorov,
for mentoring us on this project. We also would like to thank Ondrej Maxian for his work on
modularizing and adding to the c++ code.
References
1.Hanahan, Douglas, and Robert A. Weinberg. "Hallmarks of Cancer: The Next Generation." Cell 144.5 (2011): 646-74.
2.Kossenkov, Andrew V., Aidan J. Peterson, and Michael F. Ochs. "Determining Transcription Factor Activity from Microarray Data Using Bayesian Markov Chain Monte Carlo Sampling." MEDINFO (2007)
3.Ochs, Michael F., et Al. "CoGAPS: Stochastic Nonnegative Matrix Factorization by Bayesian Markov Chain Monte Carlo.“
4.Ochs, M. F. "Knowledge-based Data Analysis Comes of Age." Briefings in Bioinformatics 11.1 (2010): 30-39.
5.Ochs, Michael F., and Et Al. "CoGAPS: Stochastic Nonnegative Matrix Factorization by Bayesian Markov Chain Monte Carlo."
Presented at TCNJ MUSE 2015 Poster Session, September 12, 2015Funded by Nation Library of Medicine Grant R01LM011000
Biology of Cancer
Integration of Signaling Networks
• Various biological databases for cell signaling data were
searched for gene interactions in order to compile relevant
networks for head and neck cancer.
• The biological goal of the project is to integrate the
information from cell signaling networks as prior statistical
information.
The source of many cancers is a mutation or multiple
mutations in the cellular signaling networks that
eukaryotic cells have to control growth and
metabolism. Common pathways involved in the onset
of cancer are the RAS-RAF, JAK-STAT, and TGFbR
signaling pathways. Mutations in these pathways can
cause proliferative growth signals or block signals that
inhibit growth and proliferation. CoGAPS uses gene
expression data from cancer studies as input.
In order to aid in statistical analysis
and data visualization, as well as to
ease prospective research
reproducibility, R and MATLAB
interfaces were created to pass data
to and receive results from, the main
C++ algorithm. The RCPP package
and MEX files were used to allow for
data conversions and piping on their
respective software.
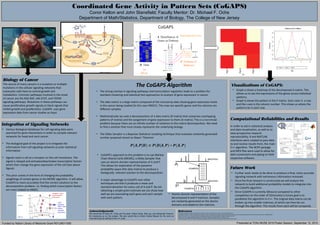
The CoGAPS Algorithm Visualizations of CoGAPS:
• Atomic domain representation of the
decomposed A and P matrices. Samples
are randomly generated on the atomic
domains and added to the matrices.
Computational Reliabilities and Results
• Signals reach a cell at a receptor on the cell membrane. The
signal is relayed and activates/deactivates transcription factors
which then change the gene expression of the cell (See above
figure).
• This prior comes in the form of changing the probability
weightings of certain genes in the MCMC algorithm. It will allow
CoGAPS to more accurately find the correct solutions to the
decomposition problem, i.e. finding which transcription factors
are most related to HNSCC.
• Further work needs to be done to produce a final, more accurate
signaling network with extraneous information removed.
• Once the final network is constructed we will analyze the
network to build additional probability models to integrate into
the CoGAPS algorithm.
• Since CoGAPS is currently O(hours) compared to other
competitors on the order of O(minutes) a future goal is to
parallelize the algorithm in C++. The original data matrix can be
broken up into smaller matrices, of which can then be run
through the algorithm. The results from each will be compared.
• Graph a shows a heatmap of the decomposed A matrix. This
allows us to see the expressions of the genes across individual
patterns.
• Graph b shows the patters in the P matrix. Each color is a row
and the x axis is the column number. This shows us where the
patterns lie in each row.
• CoGAPS’s approach to this problem is to use Markov
Chain Monte Carlo (MCMC), a Gibbs Sampler that
uses an atomic domain representation of A and P.
This allows for exploration of the posterior
probability space (the data matrix) to produce a
biologically relevant solution to the decomposition.
• A major advantage to CoGAPS over other
techniques are that it produces a mean and
standard deviation for every cell of A and P. By not
obtaining a simple point estimate we can show how
well we are associating each gene and each sample
with each pattern.