Journal of financial and quantitative analysis financial innovation, market participation, and asset prices
1. JOURNAL OF FINANCIAL AND QUANTITATIVE ANALYSIS VOL. 39, NO. 3, SEPTEMBER 2004
COPYRIGHT 2004, SCHOOL OF BUSINESS ADMINISTRATION, UNIVERSITY OF WASHINGTON, SEATTLE, WA 98195
Financial Innovation, Market Participation, and
Asset Prices
Laurent Calvet, Mart´ın Gonzalez-Eiras, and Paolo Sodini£
Abstract
This paper investigates the pricing effects of financial innovation in an economy with en-
dogenous participation and heterogeneous income risks. The introduction of non-redundant
assets endogenously modifies the participation set, reduces the covariance between divi-
dends and participants’ consumption and thus leads to lower risk premia. In multisector
economies, financial innovation spreads across markets through the diversified portfolio
of new entrants, and has rich effects on the cross-section of expected returns. The price
changes can also lead some investors to leave the markets and give rise to non-degenerate
forms of participation turnover. The model is consistent with several features of financial
markets over the past few decades: substantial innovation, higher participation, significant
turnover in investor composition, improved risk management practices, a slight increase in
real interest rates, and a reduction in risk premia.
I. Introduction
The introduction of a vast array of non-redundant securities has transformed
financial markets over the past few decades. Derivative contracts now allow firms
to routinely manage their exposure to commodity and financial prices.1
New in-
surance and financial products provide additional diversification opportunities to
individual investors. Initial public offerings have enabled entrepreneurs to diver-
sify some of their wealth away from the companies in which they had managerial
£Calvet, lcalvet@aya.yale.edu, Department of Economics, Harvard University, Cambridge, MA
02138, Department of Finance, Stern School of Business, New York, NY 10012, and NBER;
Gonzalez-Eiras, mge@udesa.edu.ar, Departamento de Econom´ıa, Universidad de San Andr´es, Vito
Dumas 284 (1644), Victoria, Buenos Aires, Argentina; Sodini, paolo.sodini@hhs.se, Department of
Finance, Stockholm School of Economics, Sveav¨agen 65, Box 6501, SE-113 83 Stockholm, Sweden.
Earlier versions of this paper appear in the Ph.D. dissertations of M. Gonzalez-Eiras and P. Sodini.
We received helpful comments from D. Acemoglu, F. Alvarez, S. Basak, O. Blanchard, R. Caballero,
J. Campbell, J. Detemple, P. Diamond, A. Fisher, R. Giammarino, G. Mankiw, E. Maskin, M. Pagano,
T. Persson, S. Ross, R. Uppal, D. Vayanos, T. Vuolteenaho, J. Wang, an anonymous referee, and
seminar participants at Boston University, CEU, ESSEC, Gerzensee, Harvard, INSEAD, the London
School of Economics, MIT, NYU, Salerno, San Andr´es, the Stockholm School of Economics, UBC,
the University of Amsterdam, the University of Cyprus, UTDT, the University of Trieste, the Rolf
Mantel Memorial Conference, the 2000 LACEA Meeting, the 2001 European Summer Meeting of the
Econometric Society, and the 2002 NBER Meeting on Economic Fluctuations and Growth. The paper
also benefited from excellent research assistance by Charles P. Cohen.
1See, for instance, Ross (1976).
431
2. 432 Journal of Financial and Quantitative Analysis
interests.2
Financial theory suggests that these innovations might have profound
implications for portfolio choice, asset pricing, and the cross-sectional allocation
of risk.3
For instance, new instruments allow agents to reduce their exposure to
idiosyncratic or background shocks, which increases the demand for stocks and
leads to a lower market premium (e.g., Kihlstrom, Romer, and Williams (1981),
Nachman (1982), and Campbell and Viceira (2002)).
This paper shows that new mechanisms arise when participation is endoge-
nized in an economy with heterogeneous income risks.4
The introduction of new
securities changes the participation set, decreases the covariance between divi-
dends and participants’ consumption, and thus amplifies the reduction in the mar-
ket premium. In multifactor economies, financial innovation also spreads across
markets through the diversified portfolio choices of new entrants and has rich ef-
fects on the cross-section of expected returns. The price changes can also lead
some investors to leave financial markets. Innovation then induces the simultane-
ous entry and exit of investors, giving rise to non-degenerate forms of participa-
tion turnover.5
Our approach builds on the existence of fixed costs to participate in financial
markets. Corporate hedging requires the employment of experts able to effec-
tively reduce the firm’s risk exposure using existing financial assets. Investors
have to sustain learning efforts and expenses related to the opening and mainte-
nance of accounts with an exchange or a brokerage firm. Statutory and govern-
ment regulations often create costly barriers to the participation of institutional
investors in some markets.
We introduce a two-period economy with incomplete markets and endoge-
nous participation. Agents can borrow or lend freely, but have to pay a fixed entry
cost to invest in risky assets. They receive heterogeneous random incomes deter-
mined by a finite number of macroeconomic risk factors. Security prices and the
participation structure are jointly determined in equilibrium. The model is com-
putationally tractable and leads to a closed-form system of equilibrium equations
in the CARA-normal case. As mentioned earlier, three new mechanisms arise in
this economy.
First, the introduction of non-redundant instruments encourages more in-
vestors to participate in financial markets for hedging and diversification pur-
poses. Under plausible conditions on the cross-sectional distribution of risk, the
new entrants reduce the covariance between stock returns and the mean consump-
tion of participants, leading to a lower market premium. The model thus illus-
trates the connection between the cross-sectional distribution of risk and the price
impact of new assets. It is also consistent with features that have characterized
financial markets in the past few decades: substantial financial innovation, a sharp
2Shiller (2003) provides a recent review of these developments.
3Theoretical investigations of financial innovation include Allen and Gale (1994a), (1994b), Cal-
vet (2001), Cass and Citanna (1998), Detemple and Selden (1991), Duffie and Jackson (1989), Gross-
man (1989), Huang and Wang (1997), and Stein (1987). See Duffie and Rahi (1995) for a review.
4While the discussion focuses on the effect of an increase in spanning, the paper also analyzes the
consequences of a reduction in transactions costs.
5Hurst, Luoh, and Stafford (1998) and Vissing-Jørgensen (2002) report substantial rates of entry
and exit in U.S. stock ownership.
3. Calvet, Gonzalez-Eiras, and Sodini 433
increase in investor participation, improvements in risk-management practices, a
slight increase of real interest rates, and a reduction in the risk premium.6
Second, participation plays an important role in spreading the effects of in-
novation across markets. When a common factor becomes tradable, some agents
decide to pay the entry fee and trade the new contract in order to manage their risk
exposure. The new participants achieve optimal diversification by trading other
assets, which modifies the risk premia even in sectors uncorrelated to the new
contract. Furthermore, the entrants tend to have a stronger impact on the average
exposure to the factor than on other sectors of the economy. As a result, price
changes are more pronounced for assets correlated with the new contract. Finan-
cial innovation thus differentially affects distinct sectors of the economy and has
a rich impact on the cross-section of expected returns.
Third, the price changes induced by financial innovation can give rise to
non-degenerate forms of participation turnover. For instance, the introduction of
a new asset leads some agents to enter financial markets to manage their income
risk. Other agents, however, are adversely affected by the induced changes in risk
premia and may find it optimal to stop trading. Innovation can therefore induce
simultaneous entry and exit. The paper thus helps relate participation turnover
with the cross-sectional distribution of risk in multisector economies.
Section II introduces a tractable asset pricing model with endogenous entry.
Section III demonstrates the pricing and participation effects of financial inno-
vation in a one-factor model of risk exposure. Multiple factors are considered
in Section IV. Simple simulations suggest that financial innovation substantially
reduces the equity premium, differentially spreads across security markets, and
either increases or decreases the interest rate. All proofs are given in the Ap-
pendixes.
A. Review of Previous Literature
This paper builds on two strands of the asset pricing literature that have es-
sentially been developed separately. First, researchers have examined how lim-
ited investor participation affects the prices of a fixed set of securities. Second,
the price impact of financial innovation has been examined both empirically and
theoretically without consideration of participation. The novelty of this paper is
to combine these two lines of research in a simple and tractable framework.
Empirical research on stock market participation was pioneered by Blume,
Crockett, and Friend (1974), Blume and Friend (1978), and King and Leape
(1984). Mankiw and Zeldes (1991) report that only 28% of households owned
stocks in 1984, and that 47% of households with liquid assets in excess of $100,000
held any equity.7
The fraction of households owning stocks increases with income
and education, implying that there could be fixed information costs to participate
in financial markets. Stockholder consumption is also more highly correlated
with the market portfolio than aggregate consumption. The distinction between
6The decrease in the risk premium is reported in Blanchard (1993), Campbell and Shiller (2003),
Cochrane (1997), and Fama and French (2002). Similarly, Barro and Sala-i-Martin (1990) and Hono-
han (2000) document a slight increase in real interest rates over the past three decades.
7The structure of stock ownership is further analyzed by Blume and Zeldes (1993) and Bertaut
and Haliassos (1995).
4. 434 Journal of Financial and Quantitative Analysis
stockholders and non-stockholders therefore helps explain the equity premium
puzzle. The empirical validity of this mechanism is further confirmed by Vissing-
Jørgensen (1997). Poterba and Samwick (1995) and Vissing-Jørgensen (1997)
also document the sharp increase of stock market participation in the U.S. since
1945.
These empirical findings have prompted the development of theoretical mod-
els that restrict participation exogenously. Saito (1995) and Basak and Cuoco
(1998) thus consider two-asset exchange economies in which the risky security
spans individual income. At low participation levels, a small number of agents
bears in equilibrium the aggregate risk of the entire population. As a result, the
market premium is high and matches the historical average under reasonable lev-
els of risk aversion. Heaton and Lucas (1999) extend the analysis by consider-
ing heterogeneous incomes with a common non-marketable factor. In contrast
to this earlier work, we consider multiple assets and factors, and endogenize the
participation structure by considering fixed costs to trading in financial markets.
The entry-cost approach has been widely used in finance to analyze issues such
as portfolio choice (Campbell, Cocco, Gomes, and Maenhout (2001)), volatility
(Pagano (1989), Allen and Gale (1994b), and Orose (1998)), futures risk premia
(Hirshleifer (1988)), market size (Allen and Gale (1990), Pagano, (1993)), and
the effect of social security reform on capital accumulation (Abel (2001)). We
use this setup to analyze how financial innovation affects investor participation
and asset prices.
The paper is also related to the literature that examines the price impact of
financial innovation without consideration of participation. Conrad (1989) and
Detemple and Jorion (1990) find empirically that the introduction of new batches
of options had a substantial price impact between 1973 and 1986. The effect is
stronger for underlying stocks, but can also be observed for an industry index that
excludes the optioned stock as well as for the market index. Similar empirical
evidence is available for other countries and derivative markets (e.g., Jochum and
Kodres (1998)).
A rich theoretical literature has also explored the impact of innovation, and
three results are most directly related to our model. First, the introduction of
a new security permits agents to better share risk and thus weakens the precau-
tionary supply of savings. This leads to a higher equilibrium interest rate, which
reduces the price of all assets in fixed-participation exchange economies (Weil
(1992), Elul (1997)).8
In contrast, we will show that price changes induced by in-
novation can cause some investors to exit the market. Lower participation then en-
courages precautionary savings and reduces the equilibrium interest rate in some
economies.
Second, financial innovation does not affect risk pricing in standard mean-
variance settings with fixed participation (Oh (1996)). Specifically in quadratic
or CARA-normal economies, the price of any risky security relative to the bond
is unaffected by changes in the span. For this reason, researchers have made little
use of mean-variance models to analyze the pricing implications of innovation.9
8See Angeletos and Calvet (2000) for the analysis of production economies.
9Detemple and Selden (1991) is a notable exception.
5. Calvet, Gonzalez-Eiras, and Sodini 435
We will show that CARA-normal economies can be quite useful when the partic-
ipation structure is endogenized. New assets induce the entry of new investors,
which lowers the systematic consumption risk of participants and therefore in-
creases the price of preexisting securities.
Third, financial innovation allows agents to reduce their exposure to id-
iosyncratic or background shocks, which stimulates the demand for stocks (e.g.,
Kihlstrom, Romer, and Williams (1981), Nachman (1982), Gollier (2001), and
Campbell and Viceira (2002)). As a result, equilibrium risk premia tend to be
lower after the introduction of new assets. In our model, however, agents have
CARA utilities and reductions in background risk do not affect the demand for
risky assets. Changes in the systematic consumption risk of participants are the
only contributing factors to lower premia in our setup, which will greatly simplify
the interpretation of the results. We anticipate that our mechanism complements
and amplifies the background risk channel when individual utilities are isoelastic
or more generally exhibit decreasing absolute risk aversion.
II. A Model of Endogenous Market Participation
We examine an exchange economy with two periods ´t 0 1µ and a single
perishable good. The economy is deterministic at date t 0 and stochastic at
t 1. During her life, each agent h receives an exogenous random endowment
eh
´eh
0 ˜eh
µ, which corresponds for instance to a stochastic labor income. Her
preference over consumption streams ´ch
0 ch
µ is represented by a utility function
Uh
´ch
0 ch
µ. We thus adopt the two-period setup that has widely been used in the
financial innovation literature for its tractability (e.g., Allen and Gale (1994a),
(1994b)). We anticipate that our model provides useful insights on the properties
of multiperiod economies with permanent shocks.10
This paper places no restriction on the set of agents H, which can be finite or
infinite. To provide a uniform treatment, we endow the space H with a measure
that satisfies ´Hµ 1. This is equivalent to viewing each element of H as a type,
and the measure as a probability distribution over all possible types.
At date t 0, agents can exchange a finite number of real securities, whose
initial prices and final payoffs are denominated in units of the consumption good.
The financial structure is exogenous and contains two types of assets. First, agents
can trade a riskless asset costing 0 1 R in date t 0 and delivering one unit of
the good with certainty at date t 1. Note that R is the gross interest rate. Second,
there also exist J risky assets ´j 1 Jµ with price j and random payoff ˜aj. We
assume for simplicity that all assets are in zero net supply.11
Investors can freely
operate in the bond market but have to pay a fixed entry cost in order to invest
in one or more risky assets. This assumption is consistent with complementarities
10A large body of research shows that transitory shocks can be easily self-insured while persistent
shocks have profound pricing and welfare implications in dynamic economies with incomplete mar-
kets (e.g., Bewley (1977), Telmer (1993), Constantinides and Duffie (1996), Storesletten, Telmer, and
Yaron (1996), and Levine and Zame (2002)). The extension of our framework to the dynamic case,
following Calvet (2001), is a promising direction for future research.
11A positive supply of assets could be considered by redefining individual endowment as the sum
of a labor income and an exogenous portfolio of securities. This is a standard convention in asset
pricing theory, as discussed in Magill and Quinzii ((1996), ch. 3).
6. 436 Journal of Financial and Quantitative Analysis
of learning in trading activities, and the results of the paper easily generalize to
more flexible specifications of the entry cost. Investors are price takers both in
their entry and portfolio decisions, and there are no constraints on short sales. The
prices and payoffs of risky securities are conveniently stacked into the vectors
and ˜a. Let h
¾ ÊJ
denote the units of risky assets bought (or sold) by investor h.
We also consider the dummy variable 1 h 0 equal to 1 if h
0, and equal to 0
otherwise. The agent is subject to the budget constraints,
ch
0 +
h
0
R
+ ¡ h
+ 1 h 0 eh
0
˜ch
˜eh
+ h
0 + ˜a ¡ h
These equations are standard, except for the presence of the entry cost in the re-
source constraint at date 0. We determine the optimal choice ´ch
0 ˜ch h
0
h
µ by
calculating the consumption-portfolio decision under entry and non-entry. Com-
paring the resulting utility levels yields the optimal participation decision.
Let e0
Ê
H
eh
0d ´hµ and ˜e
Ê
H
˜eh
d ´hµ respectively denote the average
income of the entire population in each period.
Definition (Equilibrium). A general equilibrium with endogenous participation
(GEEP) consists of an interest rate R, a price vector , and a collection of optimal
plans ´ch
0 ˜ch h
0
h
µh¾H such that
i) The good market clears in every state:
Ê
H
´ch
0 + 1 h 0 µd ´hµ e0, and
Ê
H
˜ch
´ µd ´hµ ˜e´ µ for all ¾ ª;
ii) The asset markets clear:
Ê
H
h
j d ´hµ 0 for all j ¾ 0 J .
In the absence of entry fee ´ 0µ, the definition coincides with the traditional
concept of general equilibrium under incomplete markets (GEI). When participa-
tion is costly, a GEEP differs from a GEI through two different channels. First,
agents endogenously decide whether to pay the entry fee in order to trade risky
assets. Second, trading activities use some of society’s resources and crowd out
private consumption, as seen in the market clearing condition at date t 0. This
phenomenon, which we call the displacement effect, probably plays a minor role
in actual economies. Extensions of our model could transfer a fraction of trading
fees to some consumers (such as exchange owners), or seek to provide a more
detailed description of the financial industry.
The existence of equilibrium is proven in Appendix A. As in the GEI case,
equilibrium allocations are usually Pareto inefficient because missing markets in-
duce incomplete risk sharing. With two periods and a single good, however, GEI
allocations are known to satisfy a limited or constrained form of efficiency. No
social planner can improve the utility of all agents when income transfers are
constrained to belong to the asset span. This limited form of efficiency easily
generalizes to our setting when the planner pays the entry fee required to use the
risky asset.
Definitions (Constrained Efficiency). An allocation ´ch
0 ˜ch
µh¾H is feasible if:
i) For all h, there exists ´ h
0
h
µ ¾ Ê ¢ ÊJ
such that ˜ch
˜eh
+ h
0 + ˜a ¡ h
.
ii)
Ê
H´ch
0 + 1 h 0 µd ´hµ e0, and
Ê
H ˜ch
´ µd ´hµ ˜e´ µ for all ¾ ª.
7. Calvet, Gonzalez-Eiras, and Sodini 437
A feasible allocation is called constrained Pareto-efficient if no other feasible al-
location makes all agents strictly better off.
Appendix A shows that a GEEP allocation is constrained Pareto-efficient. As a
result, the introduction of a non-redundant asset cannot make all agents worse off.
In order to analyze the effect of financial innovation on participation and
prices, we now specialize to a tractable class of CARA-normal economies. In-
vestors have identical utility of the Epstein-Zin type:
U ´c0 cµ e c0
¬ e c
where and are positive coefficients. The agent maximizes e c0
¬e c1
when she reallocates through time a deterministic income flow. On the other
hand, atemporal risky choices only depend on e c
. When future consumption
is normally distributed, we can rewrite the utility as e c0
¬e EE c var´cµ 2
.
The specification reduces to standard expected utility when .
Individual endowments and the payoffs of risky assets are jointly normal.
The securities generate a linear subspace in the set L2
´ªµ of square-integrable
random variables. We assume without loss of generality that risky assets are cen-
tered and mutually independent: ´˜a1 ˜aJµ × Æ´0 Iµ. Let A denote the span
of the risky assets, and A the subspace orthogonal to all securities (including the
bond). Projections play an important role in the discussion, and ˜xV
conveniently
denotes the projection of a random variable ˜x on a subspace V.
A. Individual Entry Decision
We solve the decision problem of a given trader h by calculating the consump-
tion-portfolio choice under entry and non-entry. Consider the security ˜mA
´R µ
ÈJ
j 1 j˜aj, which is determined by risk aversion and market prices. We
can easily show the following proposition.
Proposition 1 (Optimal Portfolio of Participant). A market participant buys
h p
0
R
1 + R
eh
0 ˜eh
¡ h p
+
ÐÒ´R¬µ
+
2
var ˜ehA
+ var
˜mA
¡
units of the bond, and h p
j cov´˜aj ˜eh
µ R j units of risky asset j. Con-
sumption is
ch p
˜eh
+ h p
0 + ˜mA
+ ˜ehA
(1)
in the second period.
We infer from ´1µ that the investor exchanges the marketable component ˜ehA
of
her income risk for the tradable portfolio ˜mA
, which provides the optimal mix of
risk and return. Because markets are incomplete, she is also constrained to bear
the undiversifiable income risk ˜ehA
.
Investment in the riskless asset is the sum of two components, which corre-
spond to intertemporal smoothing and the precautionary motive. First, the agent
9. Calvet, Gonzalez-Eiras, and Sodini 439
FIGURE 1
Geometry of the Entry Condition
Risky Asset Span
hA
e
h
e
~mA
~ ~e mhA A
−
An agent with random income ˜eh participates in risky asset markets if the distance between the tradable component of
her endowment ˜ehA and the tradable security ˜mA is larger than
Ô2 R .
Market participants can have different income risk characteristics than the entire
population. We will show in Sections III and IV that this difference is a driving
element of the model.13
While ˜e denotes the mean income in the population, we
define the average endowment of participants as ˜ep
Ê
È ˜eh
d p
´hµ, where p
is
the conditional measure ´Èµ.14
In equilibrium, the common consumption risk ˜mA
coincides with the average
tradable income risk of participants,
˜mA
˜epA
(5)
We also establish Theorem 2.
Theorem 2 (Asset Prices). In equilibrium, an asset ˜a is worth
´˜aµ ˜a cov ´˜ep
˜aµ R(6)
The interest rate satisfies
ÐÒ R ÐÒ R0 + ´Èµ +
2 È
var
˜ehA
˜epA
¡
d p
´hµ(7)
where ÐÒ R0 ÐÒ´1 ¬µ + ´ ˜e e0µ ´ 2µ
Ê
H var´˜eh
µd ´hµ.
13Heaton and Lucas (2000) show the empirical validity of this distinction.
14More specifically, the conditional measure p is ´Èµ if ´Èµ 0, and identically zero
otherwise.
10. 440 Journal of Financial and Quantitative Analysis
The participation set and asset prices are jointly determined by (4)–(7).
An asset is valuable if it provides a hedge against the consumption risk of
participants. Since entry is endogenous, financial innovation can change the mar-
ket endowment ˜ep
, and therefore the price ´˜aµ R 1
˜a cov´˜ep
˜aµ of a
risky asset relative to the bond. As noted by Oh (1996), such a channel does not
exist in a CARA-normal economy with a fixed set of traders: an increase in the
span then has no effect on cov´˜ep
˜aµ and thus on the price of a risky asset relative
to the bond. The possible effect of financial innovation on the risk premium thus
crucially relies on the endogeneity of participation in our model.
The equilibrium interest rate R is influenced by two economic effects corre-
sponding to the last two terms of (7). First, the interest rate tends to be higher
when more first period resources ´Èµ are absorbed in the entry process. The
second term of (7) corresponds to the precautionary motive. The variance of indi-
vidual consumption is var´˜epA
µ +var´˜ehA
µ if an agent participates, and var´˜ehA
µ +
var´˜ehA
µ otherwise. Entry thus reduces on average the variance of consumption
by
È
var
˜ehA
¡
d p
´hµ var
˜epA
¡
È
var
˜ehA
˜epA
¡
d p
´hµ(8)
This term is large when many agents participate or many hedging instruments are
available. The financial markets then permit agents to greatly reduce their risk
exposure, which dampens their precautionary motive, reduces the demand for the
riskless asset, and leads to an increase in the equilibrium interest rate.15
The entry condition (3) suggests that a lower fee or improved spanning tends
to encourage entry. For instance, when the cost is infinite, no agent trades risky
assets and the equilibrium interest rate equals R0. The equilibrium set of partici-
pants, however, may not increase monotonically with the financial structure. This
is because the entry condition (3) depends on the endogenous variables ˜ep
and R.
When new assets are added, a participating agent h may leave the market because
the diversification benefit var´˜ehA
epA
µ 2 has dropped or the opportunity cost
has increased. Sections III and IV will provide examples of such behaviors.
The effect of financial innovation on the interest rate is easily predicted when
the average endowment of participants remains constant.
Proposition 2. Financial innovation leads to a higher interest rate when the mean
endowment ˜ep
is unchanged.
The proof has a straightforward intuition. A lower interest rate would reinforce
the favorable effect of financial innovation on entry and lead, by (7), to a higher
interest rate—a contradiction. Thus, if the participants’ average endowment does
not vary, existing asset prices necessarily decrease with financial innovation.
Changes in ˜ep
thus play a crucial role in determining the impact of financial inno-
vation on asset prices. To better understand this mechanism, we now introduce a
factor model of risk exposure.
15This equation is thus consistent with the well-known effect that financial innovation increases the
interest rate when the participation structure is exogenous (Weil (1992), Elul (1997)).
11. Calvet, Gonzalez-Eiras, and Sodini 441
III. Economies with a Unique Risk Factor
We consider in this section an economy with a unique factor ˜ that linearly
affects all incomes. The endowment of each investor h is specified as
˜eh
˜eh
+ ³
h
˜(9)
where ³
h
is the individual risk loading. The model is tractable when the shock
and the assets are jointly normal. Without loss of generality, we assume that ˜ has
a standard distribution Æ´0 1µ and generates a non-negative average loading ¯³ in
the population.16
The cross-sectional distribution of ³ is specified by a measure
on the real line. To clarify the exposition, we assume that the measure has a
continuous density f´³µ, whose support is the non-negative interval 0 ½µ.17
When financial markets are incomplete, existing securities span only par-
tially the common shock. The projection of ˜ on the asset span, ˜A
ÈJ
i 1 cov´˜A
ajµaj, is the tradable component of the factor. The corresponding variance,
« var
˜A
¡
quantifies the insurable fraction of the risk ˜ and thus represents a useful index of
market completeness. Since ˜ has unit variance, the index « is contained between
0 and 1. The values « 0 and « 1 respectively correspond to the absence of risky
assets ´A 0 µ and the full marketability of the shock ´˜ ¾ Aµ. Intermediate
values of « arise when agents can only trade the bond and a risky asset imperfectly
correlated with the aggregate shock.
The portfolio ˜A
and the index « have direct empirical interpretations. We
obtain ˜A
by regressing the factor ˜ on the asset payoffs. The determination coef-
ficient R2
then provides an estimate of the completeness index «. This approach
is easily implemented when the factor represents GDP or an aggregate shock that
is not directly tradable on organized exchanges (Roll (1977)). The introduction of
a non-redundant asset increases the index « and helps market participants hedge
more closely the risk ˜. Since macroeconomic variables such as GDP are often
observed with measurement errors and lags, improvements in national accounting
can also lead to more precise hedging and thus a higher «.
A. Participation Structure
We infer from Section II the equilibrium of the one-factor economy. Let ³
p
denote the average loading of participants,
³
p
È
³d p
´³µ(10)
The participation set contains agents whose loading ³ is sufficiently different
from ³
p
,
È ³ ¾ Ê : ³ ³
p
£(11)
16Purely idiosyncratic shocks are ruled out in this section for expositional simplicity.
17The theorems of this section are proved in the Appendix for densities f´³µ with arbitrary un-
bounded supports.
12. 442 Journal of Financial and Quantitative Analysis
where £
Ô
2 R ´«µ.18
We note that £ is the half-width of the non-participation
region, and henceforth call it the non-participation parameter. £ increases with
the entry cost and the interest rate R, and decreases with the completeness index
« and the risk aversion . Thus financial innovation, either in the form of a lower
entry fee or an increase in spanning, tends to decrease £. The participation set is
illustrated in Figure 2. Agents ³ ³
p
+ £ are hedgers who trade assets in order
to reduce their risk exposure. Conversely, agents with loadings ³ ³
p
£ are
speculators who increase their consumption risk in order to earn a higher return.
FIGURE 2
Effect on Participation of a Decrease in £
LoadingDensity
newentry
IN OUT IN
p
ϕ −Λ p
ϕ p
ϕ Λ+
( )f ϕ
newentry
ϕ
Factor Loading
Financial innovation, either in the form of improved spanning or lower transaction costs, reduces the nonparticipation
parameter £
Ô2 R ´«µ. When the cross-sectional distributional of risk is skewed to the left, a majority of entrants
have low risk exposure. As a result, the participants’ average loading ³p and the risk premium fall.
The equilibrium calculation is simplified by the following observation: ³
p
is both the average loading and the midpoint of the participation set.19
As shown
in Appendix B, these restrictions impose that a unique midpoint ³
p
is consistent
with a given half-width £.
Property 1 (Participation Set). For any non-participation parameter £ 0, there
exists a unique loading ³
p
´£µ satisfying conditions (10) and (11). The corre-
18Agent h trades risky assets if the participation benefit is larger than the opportunity cost:
«´³h ³ pµ
2 2 R, or equivalently ³ h ³ p £. When assets have no correlation with the
risk factor ´« 0µ, the participation set is empty under costly entry ´ 0µ and indeterminate under
free entry ´ 0µ.
19The loading ³ p satisfies
Ê ³p
£
½ ´³ ³ pµf´³µd³+
Ê ½
³p+£´³ ³ pµf´³µd³ 0, which implicitly
defines ³ p as a function of £.
13. Calvet, Gonzalez-Eiras, and Sodini 443
sponding participation sets È£ ´ ½ ; ³
p
´£µ £ ³
p
´£µ + £ ; +½µ are
nested and decreasing in £ : È£¼ È£ for all £ £
¼.
When the midpoint ³
p
is exogenously fixed, it is clear that the sets ´ ½ ; ³
p
£ ³
p
+ £ ; +½µ are decreasing with the non-participation parameter £. We
show in the Appendix that the property also holds when the midpoint ³
p
´£µ varies
endogenously. Furthermore, since the sets È£ are nested, the half-width £ pro-
vides a precise ordering of the participation structure. A high £ corresponds to a
small set È£ and thus a low participation rate ´È£µ.
The midpoint ³
p
controls the pricing of risk. Participants have average in-
come ˜ep
˜ep
+ ³
p
´˜ A
+ ˜A
µ and individual random consumption,
ch
ch
+ ³
p
˜A
+ ˜ehA
We note that the marketable consumption risk ³
p
˜ A
is identical for all traders.
In equilibrium, the average loading ³
p
determines the covariance between a mar-
keted security a and individual consumption: cov´ch
aµ ³
p
cov´˜ aµ, and there-
fore the risk premium.
Financial innovation, either in the form of new assets or lower entry costs,
affects ³
p
through changes in £. The impact of innovation on the average loading
³
p
and the risk premium therefore depends on the cross-sectional distribution of
risk, as is now shown.
Property 2 (Monotonicity of Average Loading). When the loading density verifies
the skewness condition,
f´³
p
£µ f´³
p
+ £µ(12)
the average loading ³
p
locally increases with the non-participation parameter £.
Figure 2 illustrates the mechanism underlying this key result. When £ decreases,
the skewness of the loading density implies that more agents enter to the left
(speculators) than to the right (hedgers) of ³
p
, which pushes down the average
consumption loading ³
p
.
To develop intuition, we now analyze the effect of financial innovation on
the risk premium in an economy in which the interest rate is exogenously fixed.
The entry condition £
Ô
2 R ´«µ expresses the non-participation parame-
ter as a function of purely exogenous quantities. A higher completeness index
« (or a lower transaction cost ) reduces the half-width £ and thus increases
the participation set È£. The implied movement in ³
p
controls changes in risk
pricing. Consider an asset a that has positive correlation with the factor, and let
Ra a ´aµ denote the random (gross) return. By Theorem 2, the relative risk
premium satisfies
Ra R
R
³
p
cov´a ˜µ
a ³
p cov´a ˜µ
The higher « (or lower µ due to financial innovation reduces the participation
parameter £ and induces the entry of new agents. Under skewness condition
(12), a majority of the new entrants has a low exposure and reduces the covariance
14. 444 Journal of Financial and Quantitative Analysis
between the participants’ average loading and the asset. Financial innovation thus
simultaneously induces higher participation and a reduction in the risk premium.
These results illustrate the role of the loading density f´³µ for the comparative
statics of asset prices.
B. General Equilibrium
We now extend the analysis to the case of an endogenous interest rate. The
entry condition can be rewritten
R1´£µ «£
2
´2 µ(13)
The equilibrium of the bond market implies
R2´£µ R0 ÜÔ ´È£µ + «´varÈ£ ³µ 2(14)
where varÈ£´³µ
Ê
È£´³ ³
p
µ2
d p
´³µ denotes the variance of the participants’
loadings. In Figure 3, we graph these functions in the ´£ Rµ plane. An equilib-
rium corresponds to the intersection of these two curves. The quadratic function
R1´£µ is increasing, while R2´£µ monotonically decreases with £. This helps
establish Theorem 3.
Theorem 3 (Existence and Uniqueness). There exists a unique equilibrium.
Figure 3 allows us to analyze the impact of financial innovation. An increase
in « pushes up both curves in the figure, implying a higher interest rate and an
ambiguous change in the non-participation parameter £.
Proposition 3 (Impact of Financial Innovation). The riskless rate R increases with
financial innovation. As the completeness index « increases from 0 to 1, the set of
participants È has two possible behaviors. It is either monotonically increasing;
or there exists «
£ ¾ ´0 1µ such that È increases on 0 «
£ and decreases on
«
£ 1 .
The two behaviors are illustrated in Figure 4. The ambiguous effect of financial
innovation on market participation has a simple intuition. On one hand, a higher
« increases the diversification benefit «´³
h
³
p
µ2
2 of trading risky assets and
encourages entry. On the other hand, new assets reduce the precautionary motive
and increase the interest rate, thus discouraging participation. In empirical set-
tings, we expect that the favorable effect of improved diversification, which stems
from risk aversion, will tend to dominate the adverse effect of the precautionary
motive.20
20The global monotonicity results of Proposition 3 are proven in Appendix B using a single crossing
argument. Additional insights can be gained by examining the local sensitivity of R 1 and R1 to the
completeness index «. Let X « d ÐÒ X d ÐÒ « denote the elasticity of an endogenous quantity X.
We infer from (13) that £ « ´ R « 1µ 2. Financial innovation increases the set of participants
´ £ « 0µ if it has a weak impact on the interest rate ´ R « 1µ. Condition (13) also implies that
the elasticity of R2´£µ with respect to « increases with the dispersion of the participants’ loadings
varÈ£³. When traders have very heterogeneous incomes, financial innovation allows agents to greatly
reduce their average consumption risk, and thus has a strong impact on the interest rate. This explains
why participation is non-monotonic in Figure 4 for the loading density with the highest variance.
15. Calvet, Gonzalez-Eiras, and Sodini 445
FIGURE 3
Equilibrium of the One-Factor Economy
InterestRate
Non-Participation Parameter
R1(Λ) - Entry Decision
R
Λ
E´
E
Bond Market
Equilibrium
R2(Λ) -
The equilibrium E of the endogenous participation economy is determined by the intersection of the curves R1´£µ and
R2´£µ, which respectively express the entry condition and the equilibrium of the bond market. The introduction of a new
asset pushes up both curves. In the new equilibrium E, the interest rate R is higher and the shift in the nonparticipation
parameter £ is generally ambiguous.
The one-factor model may help explain a number of features that have char-
acterized financial markets in the past three decades. New financial instruments
encouraged investors to participate in financial markets, which led to a reduction
in the precautionary motive and in the covariance between stockholder consump-
tion and the aggregate shock. These two effects in turn increased the interest rate
and reduced the risk premium.21
Note that this argument is consistent with earlier
empirical findings. Mankiw and Zeldes (1991) thus show that the consumption of
stockholders tends to be more correlated with the market than the consumption of
non-stockholders. As financial innovation leads more people to enter the market,
the risk premium falls. We leave the empirical exploration of this mechanism to
further research.
In this section, financial innovation consists of providing a better hedge
against a common risk factor. In practice, however, households and firms face
multiple sources of income shocks, and innovation often permits them to hedge
classes of risk that had been previously uninsurable. For this reason, we next
examine a multifactor model of risk.
21As shown in Appendix B, a higher entry cost implies a higher risk premium under condition (12).
Like models with exogenously restricted participation (e.g., Basak and Cuoco (1998)), our framework
thus helps explain the equity premium puzzle.
16. 446 Journal of Financial and Quantitative Analysis
FIGURE 4
Effect of Financial Innovation on Market Participation
ParticipationRate
α
σ = 0.8
μ(P)
σ = 1
Index of Market Completeness
0.4
0.2
0.3
0.2
0.1
0.4 0.6 0.8 1
We consider a one-factor economy with a lognormal cross-sectional distribution or risk: ln´³µ N´0 2µ. The solid
curve corresponds to 0 8, and the dashed curve to 1. The other parameters of the economy are: 1,
1, and ¬ 1. When the completeness index « increases from 0 to 1, participation monotonically increases in one
economy ´ 0 8µ, and reaches a maximum for an intermediate value of « in the other ´ 1µ. Non-monotonicity arises
from the larger heterogeneity of individual incomes in the second economy. Financial innovation then induces a sharp
reduction in the precautionary supply of savings, which leads to a strong increase of the interest rate and the exit of some
participants.
IV. Multifactor Economies
We now investigate an economy with a finite number of risk factors ´˜1
˜Lµ, which correspond to macroeconomic or sectoral shocks affecting individual
income. For instance, ˜1 could be an aggregate risk, and ˜2 ˜L industry or
sector-specific shocks. We specify the income of each investor h as
˜eh
˜eh
+
L
1
³
h
˜(15)
and denote by ³
h
´³
h
1 ³
h
Lµ the vector of individual loadings. The model is
tractable when the risk factors and the asset payoffs are jointly normal. Without
loss of generality, we normalize the factors to have unit variances and no mutual
correlation: ´˜1 ˜Lµ × Æ´0 Iµ. The distribution of factor loadings in the
population is specified by a continuous density f´³µ on ÊL
.
The factors may not be fully tradable when financial markets are incom-
plete. As in the previous section, it is useful to consider their projections ˜A
ÈJ
j 1 cov ´˜ ˜ajµ ˜aj on the asset span. We interpret ˜A
as the marketable com-
ponent of factor , which can be estimated by regressing ˜ on asset payoffs. We
conveniently stack the projected factors in a vector ˜A
´˜ A
1 ˜ A
L µ. The covari-
17. Calvet, Gonzalez-Eiras, and Sodini 447
ance matrix ¦
A
var´˜A
µ is a generalized index of market completeness, whose
diagonal coefficients « var´˜A
µ quantify the insurable fraction of each factor.
We assume for simplicity that the projected factors are mutually uncorre-
lated: cov´˜A
˜A
k µ 0 for all distinct and k. In the next subsections, this hypoth-
esis will make it more striking that the improved marketability of factor affects
the risk premium on an uncorrelated component ˜A
k . The covariance matrix is then
diagonal,
¦
A
¾
«1
...
«L
¿
with coefficients « var´˜A
µ contained between 0 and 1. We note that ¦
A
is
equal to zero when there are no assets, and to the identity matrix when markets
are complete.
The equilibrium calculation follows directly from Section II. By (15), the
mean endowment of participants satisfies ˜ep
˜ep
+
ÈL
1 ³
p
˜ , where ³
p
rep-
resents the traders’ average exposure to factor . The equilibrium of financial
markets implies the relations ´˜aµ ˜a cov´˜ep
˜aµ R and
ÐÒ R ÐÒ R0 + ´Èµ +
2
L
i 1
«i varÈ´³iµ(16)
where ÐÒ R0 ÐÒ´1 ¬µ + ´ e e0µ ´ 2µ
ÈL
i 1 ´³
2
i µ. These equations
suggest that when the utility coefficients and 1
are large, financial innovation
generates both substantial variations in the pricing of risk and small movements
in the interest rate.
By entry condition (3), the participation set depends on the completeness
index of each factor,
È
´
³ :
2
L
1
« ´³ ³
p
µ
2
R
µ
(17)
When all the coefficients « are strictly positive, the participants are located
outside an ellipsoid centered at ³
p
´³
p
1 ³
p
Lµ.22
The half-widths £
Ô
2 R ´« µ of the ellipsoid along each axis depend on the completeness in-
dex « and the endogenous interest rate. The proof of Theorem 4 is shown in
Appendix C.
Theorem 4 (Existence and Uniqueness). There exists a unique equilibrium.
The proof begins by establishing that the vector £ ´£1 £Lµ define a unique
participation set ȣ. In contrast to the one-factor case, however, ȣ can move
in more than one direction and thus need not be decreasing (as a set) in each
component £ . The market clearing of the bond uniquely determines the interest
rate R and the half-widths £
Ô
2 R ´« µ. The proof also provides a use-
ful algorithm for the numerical computation of equilibrium. We now examine
22The participants are located outside a cylinder when some coefficients « are equal to zero.
18. 448 Journal of Financial and Quantitative Analysis
the comparative statics of participation and asset prices with respect to financial
innovation.
A. Financial Innovation and the Risk Premium
The one-factor model shows that financial innovation can reduce the risk
premium of securities correlated with the aggregate shock. In a multifactor econ-
omy, the improved marketability of a factor can also have pricing effects on un-
correlated assets. Consider for instance an economy with two factors: 1 is an
aggregate risk to which all investors are positively exposed, and 2 is purely id-
iosyncratic or distributional. Let ˜a a + ˜A
1 , ´˜aµ 0 denote an asset or stock
that is only correlated with the aggregate risk.23
By equation (6), the stock has the
relative premium,
Ra R
R
³
p
1«1
a ³
p
1«1
(18)
When participation is exogenously fixed, the consumption loading ³
p
1 is constant
and the improved marketability of the idiosyncratic shock ˜2 does not affect the
premium (18). In our model, however, innovation can affect the set of participants,
the consumption loading ³
p
1, and therefore the equity premium.
To further illustrate this mechanism, assume that the stock ˜a is the only asset
initially traded ´«2 0µ. By (17), non-participants have loadings ³1 that are close
to the market average: ³1 ³
p
1
Ô
2 R ´«1µ. When the index «2 increases,
some agents become willing to pay the entry cost because their exposure ³2 to
the idiosyncratic risk is sufficiently different from the average ³
p
2. These new
participants also trade the stock ˜a to achieve optimal diversification. The risk
premium on ˜a declines if a majority of the new entrants have low exposure to the
aggregate shock ´³1 ³
p
1µ and increase the demand for the stock. We expect this
logic to hold when the distribution of ³1 is skewed toward the origin, consistent
with the intuition developed in the one-factor case.
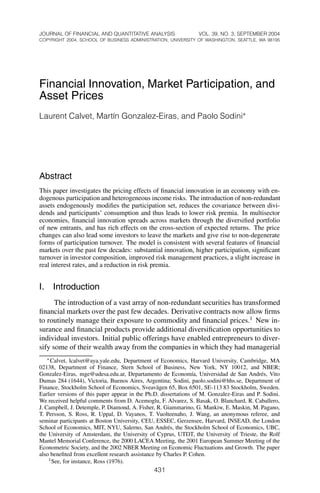
A simple simulation of the cross-sectoral effect is presented in Figure 5.
We assume for simplicity that exposures to the aggregate and idiosyncratic risks
are independent in the population. The cross-sectional loading density is then
f´³1 ³2µ f1´³1µf2´³2µ. This hypothesis makes it perhaps more surprising that
increased marketability of the idiosyncratic risk modifies the equity premium.
We specify f2´³2µ to be symmetric around zero, which implies that ³
p
2 0 in
equilibrium. We discuss the choice of parameters in Appendix C. The average
payoff of the stock is selected to obtain a risk premium Ra R equal to 7%
before the introduction of new contracts ´«2 0µ. In the absence of a futures
market, the net interest rate equals 1% and the standard deviation of the stock
var´Raµ 1 2
is 15%, implying an initial Sharpe ratio of about one-half.
In Figures 5A–5D, the solid lines illustrate equilibrium in the endogenous
participation economy as «2 increases from 0 to 1. The dashed lines illustrate
the corresponding outcomes when participation is exogenously fixed. For com-
parison purposes, the participation sets in both economies coincide when «2 0.
23While the assets are assumed to be in zero net supply, we easily reinterpret the model in terms of
equity by viewing endowment as the sum of a labor income and an exogenous endowment of stocks.
19. Calvet, Gonzalez-Eiras, and Sodini 449
FIGURE 5
Comparative Statics in a Two-Factor Economy
A. Equity Premium (%) B. Interest Rate (%)
C. Volatility of Stock Return (%) D. Participation Rate (%)
7
6
5
4
3
2
1
16
15
14
13
12
75
60
45
30
15
0.25 0.5 0.75 1
Completeness Index α2
0.25 0.5 0.75 1 0.25 0.5 0.75 1
0.25 0.5 0.75 1
Completeness Index α2
Completeness Index α2Completeness Index α2
Individual labor income is exposed to an aggregate shock ˜1 and an idiosyncratic risk ˜2. The aggregate shock is partially
insurable ´«1 0 5µ. The idiosyncratic risk is uncorrelated to existing assets when «2 0 and is fully insurable when
«2 1. The other parameters are ¬ 0 96, 10, 0 5, 0 8%, 1 4%, and 2 10%. The solid lines
illustrate equilibrium in the endogenous participation economy as the coefficient «2 varies from 0 to 1. The dashed lines
are plotted assuming a fixed set of traders. For comparison purposes, the participation sets in both economies coincide
when «2 0. The effect of innovation on the risk premium is substantially stronger under endogenous entry.
Under fixed participation, innovation only has a very modest impact on the equity
premium, the interest rate, and volatility.24
In contrast, substantial movements
are observed when entry is endogenous. The risk premium on the stock declines
from 7% to 4.5%. Providing insurance against the idiosyncratic shock thus sub-
stantially decreases the risk premium through changes in participation. Consistent
with empirical evidence, the standard deviation of the stock return is almost con-
stant at 15%.25
We observe that most of the decline in the risk premium occurs
when the hedging coefficient «2 increases from 0 to 0.5. The value «2 0 5 also
yields values for participation (60%) and the real net interest rate (2.5%) that are
reasonable for the current U.S. economy. This suggests that the cross-sectoral
24We know from equation (18) that financial innovation has no impact on the relative risk premium
´ Ra Rµ R. Figure 5 shows that the interest rate R and thus the risk premium R a R are also
approximately constant in the calibrated economy when the idiosyncratic risk becomes tradable.
25Campbell, Lettau, Malkiel, and Xu (2001) document that the volatility of stock market indices
has been stationary over the past century.
20. 450 Journal of Financial and Quantitative Analysis
effects induced by financial innovation may be quantitatively significant.26
We
leave to further research the full empirical assessment of this mechanism.
B. Differential Effects, Participation Turnover, and Interest Rate
We now explore three additional consequences of innovation in the multi-
factor model: differential changes in sectoral risk premia, simultaneous entry and
exit, and a possible reduction of the interest rate.
The previous simulations assumed that the loading density f2´³2µ is symmet-
ric around zero. Participants insure the marketable component of the idiosyncratic
shock at no cost, and an asset correlated only with 2 yields no risk premium
´³
p
2 0µ. We now examine an economy in which the loading density f2´³2µ has
a positive support and is skewed toward the origin. The risks 1 and 2 are inde-
pendent sources of aggregate uncertainty that yield positive and possibly distinct
premia. Financial innovation can differentially affect asset prices across sectors,
and thus have rich effects on the cross-section of expected returns.
The comparative statics analysis of Figure 2 easily extends to the two-factor
case. We consider a financial structure with completeness indices «1 and «2, and
assume for simplicity that interest rate R is exogenous. The ellipse delimiting the
participation set is illustrated by a solid line in Figure 6, Graph A. It is centered at
³
p
and has half-width £
Ô
2 R ´« µ along each axis. Consider an increase in
the second index from «2 to «
¼
2. Since the interest is fixed, the limiting boundary
in the new equilibrium has the same horizontal £1 but a shorter vertical half-
width £
¼
2. We represent the intermediate ellipse centered at ³
p
with parameters
£1 and £
¼
2 in dotted lines. Agents in the shaded area have smaller average loadings
than ³
p
1 and ³
p
2, and thus tend to push the new equilibrium set toward the origin.
Because these agents are more spread out vertically than horizontally, the induced
movement in ³
p
tends to be stronger along the vertical axis, i.e., in the direction of
innovation. The increased marketability of the shock 2 may thus predominantly
influence the risk premium in the second sector.
The new set of participants is delimited by the ellipse centered at ³
p
new with
half-widths £1 and £
¼
2, as illustrated in Figure 6, Graph B. Financial innovation
induces simultaneous entry and exit. Agents in the shaded area are initially out
of the market. When the new asset is introduced, these agents face lower hedging
costs and decide to participate. Agents in the dashed area, on the other hand, are
initially investing in financial assets. Lower risk premia reduce the profitability
of their investments and result in their leaving the market. The possibility of si-
multaneous entry and exit is thus an attractive feature of the multifactor model.27
26An increase in «2 reduces the idiosyncratic or background risk of all participants. When utilities
are isoelastic (or more generally exhibit decreasing absolute risk aversion), the reduction in back-
ground risk increases the demand for the stock and thus further reduces the risk premium. We an-
ticipate that this additional channel substantially amplifies the pricing effect of financial innovation
in more general setups. A similar argument is made by Heaton and Lucas ((1999), pp. 237–239).
Their framework, however, only considers a unique risk factor and asset, and therefore does not per-
mit the distinction between background risk and aggregate shock. We anticipate that their numerical
results would be strengthened by the simultaneous reduction of trader exposure to the aggregate and
idiosyncratic risks considered in this paper.
27Participation turnover also arises when the distribution of ³ 2 is symmetric, as shown in the proof
of Proposition 4.
21. Calvet, Gonzalez-Eiras, and Sodini 451
FIGURE 6
Effect on Participation of an Increase in «2
entry
Graph B. New Participation Set
ϕ1
ϕ2
jp
new
.
exit
Graph A. Intermediate Set
ϕ1
ϕ2
jp.
jp
new
.
entry
entry
Initial participants are located outside the large ellipse of Graph A. When «2 increases, the boundary shrinks vertically
(small ellipse), and new entrants move the average loadings from ³p to ³p
new. The new participation set is delimited by
the small ellipse of Graph B. The dotted area contains the new entrants, and the dashed area the agents who left the
markets.
In future work, this property may prove useful to relate the cross-sectional distri-
bution of risk with patterns of entry and exit in U.S. stock ownership (e.g., Hurst,
Luoh, and Stafford (1998), Vissing-Jørgensen (2002)).
The differential effect is illustrated in Figure 7 on a numerical example. The
marginal densities of the factor loadings are identical log-normals. The initial
economy has hedging coefficients «1 «2 «. We assume that the interest rate
is endogenous and consider two fixed assets a x + A
´ 1 2µ with a risk
22. 452 Journal of Financial and Quantitative Analysis
premium of 7%. The symmetry of the economy imposes that x1 x2. As «2 in-
creases from « to 1, both risk premia fall and the effect is stronger for the second
asset. The results of the figure are almost unchanged when the net interest rate is
exogenously set at 2%. The differential effect is an important feature of the multi-
factor economy. It distinguishes the introduction of sector-specific securities from
changes affecting all security markets, such as a reduction in taxes or transaction
costs.
FIGURE 7
Differential Effects of Financial Innovation
Completeness Index α2
Asset 2
Asset 1
Market Premium (%)
7.0
6.5
6.0
5.5
5.0
0.40.2 0.6 0.8 1
The cross-sectional loading density is the product: f´³1 ³2µ g´³1µg´³2µ, where g is the density of a lognormal
variable Z : ln Z N´ 3 5 1µ. Note that exposures to the aggregate and idiosyncratic risks are independent in the
population. The other parameters of the economy are: 10, 0 5, ¬ 0 96, and 0 8±. The initial economy
has completeness indexes «1 «2 0 2, and contains two fixed assets ˜a x + ˜A ´ 1 2µ. As «2 increases from
0.2 to 1, both risk premia fall. The effect is stronger for the second asset, which is in the sector experiencing financial
innovation.
Multifactor economies also imply novel results for the comparative statics
of the interest rate. As discussed in Section II, the introduction of new assets in-
creases risk sharing opportunities and weakens the precautionary demand for sav-
ings. In models with exogenous participation, this leads to a higher equilibrium
interest rate under many specifications, including CARA-normal (Weil (1992)
and Elul (1997)). In contrast, Appendix C establishes that when participation is
endogenous, we have Proposition 4.
Proposition 4. The interest rate locally decreases with financial innovation in
some multifactor economies.
This result has a simple geometric intuition. When new assets are introduced, the
movement of ³
p
pushes the ellipse toward a region containing a large number of
participants. In some economies, this effect is sufficiently strong to reduce overall
participation and the interest rate.
23. Calvet, Gonzalez-Eiras, and Sodini 453
V. Conclusion
This paper develops a tractable asset pricing model with incomplete markets
and endogenous participation. Agents receive heterogeneous random incomes
determined by a finite number of risk factors. They can borrow or lend freely,
but must pay a fixed entry cost to invest in risky assets. Security prices and
the participation set are jointly determined in equilibrium. The introduction of
non-redundant assets encourages investors to participate in financial markets for
hedging and diversification purposes. Under plausible conditions on the cross-
sectional distribution of risk, the new entrants reduce the covariance between div-
idends and trader consumption, which induces a reduction in the risk premium.
This logic is easily demonstrated in a simple one-factor model. Financial
innovation also has cross-sectoral effects in economies with multiple sources of
risk. When a factor becomes tradable, new agents are drawn to the market in order
to manage their risk exposure. Under complementarities in learning or increasing
returns to trading activities, the new agents also become active in preexisting mar-
kets and can modify the risk premia of securities uncorrelated to the factor. This
mechanism differentially affects distinct sectors of the economy and thus may
have a rich impact on the cross-section of expected returns. Simultaneous entry
and exit is another attractive feature of the multifactor model, which could be
useful for the analysis of participation turnover in economies with heterogeneous
income risks.
This paper suggests several directions for empirical research. Future work
could assess the contribution of financial innovation to the decline of the equity
premium in the past few decades. Participation changes may also help explain
the pricing effects of new derivatives reported in the empirical literature. From
a policy perspective, the mechanisms examined in this paper provide useful in-
sights on current debates in public and international economics. When countries
face fixed costs to financial integration, the model implies that the creation of
new markets can have profound pricing, participation, and welfare consequences.
An extension of this work could investigate the political economy of the macro
markets advocated by Shiller and others. Further research may also evaluate gov-
ernment policies affecting asset creation and participation costs, such as financial
regulation, taxes, and social security reform.
Appendix A: Existence and Constrained Efficiency
Existence
We prove existence for a convex economy with a finite state space ª
1 S . and non-negative consumption sets. The utility Uh
of every agent
is continuous, strongly monotonic, and strictly quasi-concave on ÊS+1
+ . At prices
where agents are indifferent between entry ´ h
0µ and non-entry ´ h
0µ, indi-
vidual demand consists of two distinct points. We avoid discontinuities in aggre-
gate demand by assuming that there is a finite number of types h 1 H, and
a continuum of agents in each type.
24. 454 Journal of Financial and Quantitative Analysis
Given q ´p0 0 µ, let Bh
´qµ denote the set of plans ´c0 0 µ satisfying
the budget constraints p0´c0 + 1 h 0 µ + 0 0 + ¡ p0eh
0 and ˜eh
+ 0 + ˜a ¡
0. The no-arbitrage set is the open cone Q ´p0 £ a0 £ aJµ; ´p0 £µ ¾
ÊS+1
++ . Given q ¾ Q, we can calculate the optimal excess demands Zhp
´qµ
chp
0 ´qµ + eh
0
hp
0 ´qµ hp
´qµ and Zhn
´qµ chn
0 ´qµ eh
0
hn
0 ´qµ 0 under entry
and non-entry. The excess demand correspondence Zh
´qµ is defined as Zhd
´qµ
when decision d ¾ p n is strictly optimal, and as the interval Zhp
´qµ Zhn
´qµ
when the agent is indifferent between entry and non-entry. Zh
´qµ is homogeneous
of degree 0, upper hemi-continuous and satisfies Walras’ law. Consider a vector
q 0 on the frontier of Q, and a sequence qn ½
n 1 of elements of Q converging
to q. Following Hens (1991), it is easy to show that Ò z ; z ¾ Zh
´qn
µ ½
and Ò z ; z ¾ NZh
´qn
µ ½ as n ½, where M a0 aJ and
N
1
M
Since consumption is non-negative,the set NZh
´qn
µ eh
is also bounded below.
We conclude by standard arguments that an equilibrium exists (Hens (1991)).
Constrained Efficiency of Equilibrium
We consider an equilibrium ´R ´ch
0 ˜ch h
0
h
µh¾Hµ, and assume that there
exists a feasible allocation ´dh
0 dh
µh¾H such that Uh
´dh
0 dh
µ Uh
´ch
0 ˜ch
µ for all h.
For every agent, there exists ´ h
0
h
µ such that dh
˜eh
+ h
0 + ˜a ¡ h
. Since ´dh
0 dh
µ
is strictly preferred to ´ch
0 ˜ch
µ, it must be that dh
0 + 0
h
0 + ¡ h
+ 1 h 0 eh
0.
We infer
Ê
H´dh
0 + 1 h 0 µd ´hµ e0, which contradicts feasibility.
Appendix B: One-Factor Economies
Participation Set (Proof of Properties 1 and 2)
For every fixed £ 0 the function G£´³pµ
Ê ³p £
½ ´³ ³pµd +
Ê +½
³p+£´³
³pµd is continuous and strictly decreasing on Ê. It also satisfies Рѳp ½ G£
´³pµ +½ and Рѳp +½ G£´³pµ ½. The equation G£´³pµ 0 has thus a
unique solution ³p´£µ. By the implicit function theorem, the function ³p´£µ has
derivative
d³p
d£
f´³
p
+ £µ f´³
p
£µ
f´³
p + £µ + f´³
p £µ + ´È£µ £
which is contained between 1 and 1. We conclude that ³
p
´£µ £ and ³
p
´£µ+£
are respectively decreasing and increasing in £, and thus that È£ is decreasing.
Equilibrium Properties (Proof of Theorem 3 and Proposition 3)
1. Existence and Uniqueness. Appendix A establishes the existence of equilib-
rium in an economy with finite state space and non-negative consumption. We
25. Calvet, Gonzalez-Eiras, and Sodini 455
now prove existence and uniqueness in the one-factor CARA-normal case. Con-
sider H0´£µ ´È£µ and H1´£µ ´È£µ´varÈ£ ³µ. The monotonicity of È£ im-
plies that H0´£µ is decreasing in £. Similarly, the function H1´£µ
Ê ³p
£
½ ´³
³pµ2
f´³µd³ +
Ê +½
³p+£´³ ³pµ2
f´³µd³ has derivative H¼
1´£µ £
2
H¼
0´£µ 0.
Equilibrium is determined by ´13µ ´14µ. The function R1 is strictly increasing,
and R2 is decreasing. The difference function R1´£µ R2´£µ is therefore strictly
increasing and maps 0 +½µ onto R2´0µ +½µ. We conclude that there exists a
unique equilibrium.
2. Impact of Financial Innovation. Using Cramer’s rule, we check that financial
innovation increases the interest rate: dR d« 0. On the other hand, d£ d« has
the same sign as G´«µ 2 « H1 £´«µ 2. Since G´0µ 0 the function
£´«µ is decreasing on a neighborhood of « 0. We also observe that if G´«µ 2,
then G¼´«µ 0. The equations G´«µ 2 and d£ d« 0 thus have at most one
solution on ´0 1 .
3. Impact of Entry Fee. Cramer’s rule implies that d£ d 0. A higher entry
cost thus reduces the participation set ȣ.
Appendix C: Multifactor Economies
Existence and Uniqueness of Equilibrium (Proof of Theorem 4)
The set È´³
p
£µ ³ :
ÈL
i 1´´³i ³
p
i µ £iµ2
1 is defined for any ³
p
¾
ÊL
and £ ´£1 £Lµ ¾ ÊL
++ . We observe the following.
Fact C1. For any £ ¾ ÊL
++ , the equation
Ê
È´³p;£µ´³ ³
p
µd ´³µ 0 has a unique
solution ³
p
£ ¾ ÊL
.
Proof. We rewrite the equation as a convex optimization problem. Consider
k´³ ; ³
p
£µ
ÈL
i 1´´³i ³
p
i µ £iµ2
1 1È´³p £µ´³µ, where 1È´³p £µ denotes
the indicator function of È´³
p
£µ. Since k´³ ; ³
p
£µ is convex in ³
p
and
has an unbounded support, the function K´³
p
£µ ´1
/2µ
Ê
RR L k´³ ; ³
p
£µd ´³µ is
strictly convex in ³
p
. A vector ³
p
thus minimizes K´³
p
£µ on ÊL
if and only if
K ³
p
Ê
È´³p;£µ´³ ³
p
µd ´³µ 0. Since K diverges to +½ as ³
p
+½,
there exists a unique minimizer ³
p
.
For every R 0, let £´Rµ denote the vector with components £ ´RµÔ
2 R ´« µ´1 Lµ. It is convenient to define ³
p
´Rµ ³
p
£´Rµ, the set
È´Rµ È ³
p
£´Rµ £´Rµ , and the function z´Rµ ÐÒ R0 +
Ê
È´Rµ + ´ 2µ
ÈL
i 1 «i ³i ³
p
i ´Rµ 2
d ´³µ. We check that z¼´Rµ ´1 + Rµ´d ´È´Rµµ dRµ,
which is weakly negative by Fact C2. We conclude that the equilibrium equation
z´Rµ ÐÒ R has thus a unique solution.
Fact C2. The mass of participants È´Rµ is a decreasing function of R.
Proof. We first show that the property holds under complete markets: « 1 for
all . For any R, the boundary of the participation set È´Rµ is a sphere, which
is denoted S´Rµ. Given two positive numbers R and Æ, Æ R, we seek to show
26. 456 Journal of Financial and Quantitative Analysis
that È´Rµ È´R Ƶ . The inequality is trivially satisfied when È´Rµ
È´R Ƶ. When È´Rµ È´R Ƶ, the intersection of the spheres S´Rµ and
S´R Ƶ is contained in a hyperplane H. Consider axes such that H is described by
the equation ³1 0, and the center of gravity ³
p
´Rµ ´x 0 0µ has a positive
first coordinate x. We check that ³
p
´R Ƶ has coordinates ´y 0 0µ, where
y x. When the interest rate moves from R to R Æ, agents in È+ È´R ƵÒÈ´Rµ
enter, agents in È È´RµÒÈ´R Ƶ exit, and agents in ÈC È´Rµ È´R
Ƶ participate under both interest rates (Figure 8). Since È´Rµ È ÈC and
È´R Ƶ È+ ÈC, we infer that
Ê
È ³1d ´³µ +
Ê
ÈC
³1d ´³µ x È´Rµ ,
and
Ê
È+
³1d ´³µ +
Ê
ÈC
³1d ´³µ y È´R Ƶ . Subtracting these equalities
implies
È+
³1d ´³µ
È
³1d ´³µ y È´R Ƶ x È´Rµ
The left-hand side of the equation is positive because È+ is contained in the half-
space ³1 0 and È is contained in the half-space ³1 0. Since x y, we
infer that x È´Rµ y È´R Ƶ x È´R Ƶ , and conclude that
È´Rµ È´R Ƶ holds under complete markets.
When markets are incomplete, consider the linear rescaling ³
£ ¨ ´³µ
³
Ô« and the corresponding measure £ ƨ
1
. Note that these transforma-
tions are independent of R. For every R 0, the rescaled set È£´Rµ ¨ È´Rµ
has a spherical boundary. We conclude that È´Rµ £ È£´Rµ is decreasing
in R.
Numerical Simulation
This subsection presents the microeconomic framework used in the simula-
tion of Figure 5. Individual random income is specified as eh
eh
0´1+ 1 1µ+³
h
2 2.
The individual loading ³
h
1 1eh
0 0 is therefore proportional to expected in-
come.28
The aggregate endowment in period 1 satisfies e e0´1 + 1 1µ. Without
loss of generality, mean income is normalized to unity: e0 1.
We specify the cross-sectional distribution of income to be lognormal: ÐÒ eh
0
Æ´ z
2
z µ. Since mean income is normalized to 1, z and 2
z satisfy the restric-
tion z + 2
z 2 0. We choose z 0 25, which corresponds to a reasonable
Gini coefficient of 0 4. The standard deviation of aggregate income growth 1 is
set at 0 04. Since ³
h
1 1eh
0, the loading density f1´³1µ is now fully specified.
The loading density f2´³2µ is assumed to be a centered Gaussian Æ´0 2
2µ
with standard deviation 2 0 10. The discount factor is ¬ 0 96. Since e0 1
the coefficients and 1
coincide with relative risk aversion and intertemporal
elasticity at the mean endowment point. We choose 10 and 1
2. The
fraction of mean income used in the entry process is set equal to 0 8%.
The aggregate shock is partially tradable. We choose «1 0 5, which is
roughly consistent with the correlation between the NYSE value-weighted return
and the permanent aggregate labor income shock reported in Campbell, Cocco,
Gomes, and Maenhout (2001). The stock is a traded asset of the form a x+ A
1 . We
28We assume for simplicity that there is no expected growth between the two periods.
27. Calvet, Gonzalez-Eiras, and Sodini 457
FIGURE 8
Geometry of the Participation Sets
ϕ1
ϕ p
(R)
P-
H
xy
ϕ p
(R-d )
P+
Pc
When the interest rate falls from R to R Æ, the average loading moves from ³p´Rµ to ³p´R Ƶ. Agents in È+ enter
the market, agents in È exit, and agents in Èc trade in both equilibria.
select x to obtain a risk premium Ra R equal to 7% before financial innovation
´«2 0µ.
Proof of Proposition 4
We provide an example in an economy with two uncorrelated factors ´ 1 2µ.
Letting Æ 0 01 we consider ³
A
´ 2 0µ, ³
B
´1 + Æ 0µ, ³
C
´2 0µ, ³
´0 1+Ƶ, and ³
+
´0 1 Ƶ, with respective weights mA
mB
1 5 mC
1 10
m+
m 1 4. The other parameters of the economy are 0 7, 0 3,
e0 e 1 «2 0 9.
A straightforward extension of Theorem 4 implies that a unique equilibrium
exists for any «1. When «1 0 55, we check that the participation set contains all
the agents of type A, C, +, and , and the net interest rate is approximately 7 9%.
On the other hand when «1 0 9, the participation set contains all the agents of
type A, B, and C, and the net interest rate has fallen to 5.7%.
28. 458 Journal of Financial and Quantitative Analysis
References
Abel, A. “The Effects of Investing Social Security Funds in the Stock Market when Fixed Costs
Prevent Some Households from Holding Stocks.” American Economic Review, 91 (2001), 128–
148.
Allen, F., and D. Gale. “Incomplete Markets and Incentives to Set Up an Options Exchange.” Geneva
Papers on Risk and Insurance Theory, 15 (1990), 17–46.
. Financial Innovation and Risk Sharing. Cambridge, MA: MIT Press (1994a).
. “Limited Market Participation and Volatility of Asset Prices.” American Eco-
nomic Review, 84 (1994b), 933–955.
Angeletos, G. M., and L. E. Calvet. “Incomplete Markets, Growth and the Business Cycle.” HIER
Working Paper #1910, Harvard Univ. (2000).
Barro, R., and X. Sala-i-Martin. “World Interest Rates.” In NBER Macroeconomics Annual, O. J.
Blanchard and S. Fischer, eds. 5 (1990), 15–61.
Basak, S., and D. Cuoco. “An Equilibrium Model with Restricted Stock Market Participation.” Review
of Financial Studies, 11 (1998), 309–341.
Bertaut, C., and M. Haliassos. “Why Do So Few Hold Stocks?” Economic Journal, 105 (1995),
1110–1129.
Bewley, T. “The Permanent Income Hypothesis: A Theoretical Formulation.” Journal of Economic
Theory, 16 (1977), 252–292.
Blanchard, O. J. “Movements in the Equity Premium.” Brookings Papers on Economic Activity, 2
(1993), 75–118.
Blume, M.; J. Crockett; and I. Friend. “Stock Ownership in the United States: Characteristics and
Trends.” Survey of Current Business, 54 (1974), 16–40.
Blume, M., and I. Friend. The Changing Role of the Individual Investor: A Twentieth Century Fund
Report. New York, NY: John Wiley (1978).
Blume, M., and S. Zeldes. “The Structure of Stockownership in the United States.” Working Paper,
Wharton School (1993).
Calvet, L. “Incomplete Markets and Volatility.” Journal of Economic Theory, 98 (2001), 295–338.
Campbell, J. Y.; J. Cocco; F. Gomes; and P. Maenhout. “Investing Retirement Wealth: A Life-Cycle
Model.” In Risk Aspects of Investment-Based Social Security Reform, J. Campbell and M. Feld-
stein, eds. Univ. of Chicago Press (2001), Chapter 11. (Also reproduced in Campbell and Viceira
(2002)).
Campbell, J. Y.; M. Lettau; B. Malkiel; and Y. Xu. “Have Individual Stocks Become More Volatile?
An Empirical Exploration of Idiosyncratic Risk.” Journal of Finance, 56 (2001), 1–43.
Campbell, J. Y., and R. J. Shiller. “Valuation Ratios and the Long-Run Stock Market: An Update.”
In Advances in Behavioral Finance, Volume II, N. Barberis and R. Thaler, eds. Russell Sage
Foundation (2003).
Campbell, J. Y., and L. Viceira. Strategic Asset Allocation: Portfolio Choice for Long-Term Investors.
Oxford, England: Oxford Univ. Press (2002).
Cass, D., and A. Citanna. “Pareto Improving Financial Innovation in Incomplete Markets.” Economic
Theory, 11 (1998), 467–494.
Cochrane, J. “Where is the Market Going? Uncertain Facts and Novel Theories.” Economic Per-
spectives XXI (Nov./Dec.): Federal Bank of Chicago (1997). (Also NBER Working Paper No.
6207.)
Conrad, J. “The Price Effect of Option Introduction.” Journal of Finance, 44 (1989), 487–498.
Constantinides, G. M., and D. Duffie. “Asset Pricing with Heterogeneous Consumers.” Journal of
Political Economy, 104 (1996), 219–240.
Detemple, J., and P. Jorion. “Option Listing and Stock Returns.” Journal of Banking and Finance, 14
(1990), 781–801.
Detemple, J., and L. Selden. “A General Equilibrium Analysis of Option and Stock Market Interac-
tions.” International Economic Review, 32 (1991), 279–303.
Duffie, D., and M. Jackson. “Optimal Innovation of Futures Contracts.” Review of Financial Studies,
2 (1989), 275–296.
Duffie, D., and R. Rahi. “Financial Market Innovation and Security Design: An Introduction.” Journal
of Economic Theory, 65 (1995), 1–42.
Elul, R. “Financial Innovation, Precautionary Saving and the Risk-Free Rate.” Journal of Mathemati-
cal Economics, 27 (1997), 113–131.
Fama, E., and K. French. “The Equity Premium.” Journal of Finance, 57 (2002), 637–659.
Gollier, C. The Economics of Risk and Time. Cambridge, MA: MIT Press (2001).
29. Calvet, Gonzalez-Eiras, and Sodini 459
Grossman, S. “An Analysis of the Implications for Stock and Futures Price Volatility of Program
Trading and Dynamic Hedging Strategies.” In The Informational Role of Prices, S. Grossman, ed.
Wicksell Lectures, MIT Press (1989).
Heaton, J., and D. Lucas. “Stock Prices and Fundamentals.” NBER Macroeconomics Annual, 14
(1999), 213–242.
. “Portfolio Choices and Asset Prices: The Importance of Entrepreneurial
Risk.” Journal of Finance, 55 (2000), 1163–1198.
Hens, T. “Structure of General Equilibrium Models with Incomplete Markets and a Single Consump-
tion Good.” Discussion Paper No. A-353, Bonn Univ. (1991).
Hirshleifer, D. “Residual Risk, Trading Costs, and Commodity Futures Risk Premia.” Review of
Financial Studies, 1 (1988), 173–193.
Honohan, P. “How Interest Rates Changed under Financial Liberalization: A Cross-Country Review.”
World Bank Working Paper No. 2313 (2000).
Huang, J., and J. Wang. “Market Structure, Security Prices and Informational Efficiency.” Macroeco-
nomic Dynamics, 1 (1997), 169–205.
Hurst, E.; M. C. Luoh; and F. P. Stafford. “The Wealth Dynamics of American Families, 1984–1994.”
Brookings Papers on Economic Activity, 1 (1998), 267–329.
Jochum, C., and L. Kodres. “Does the Introduction of Futures on Emerging Market Currencies Desta-
bilize the Underlying Currencies?” IMF Working Paper (1998).
Kihlstrom, R.; D. Romer; and S. Williams. “Risk Aversion with Random Initial Wealth.” Economet-
rica, 49 (1981), 911–920.
King, M., and J. Leape. “Wealth and Portfolio Composition: Theory and Evidence.” NBER Working
Paper 1468, Cambridge, MA (1984).
Levine, D., and W. Zame. “Does Market Incompleteness Matter?” Econometrica, 70 (2002), 1805–
1840.
Magill, M., and M. Quinzii. Theory of Incomplete Markets. Cambridge, MA: MIT Press (1996).
Mankiw, N. G., and S. Zeldes. “The Consumption of Stockholders and Non-Stockholders.” Journal
of Financial Economics, 29 (1991), 97–112.
Massa, M., and A. Simonov. “Do Investors Hedge? Stock Market Participation and Hedging.” Work-
ing Paper, Stockholm School of Economics (2002).
Nachman, D. “Preservation of ‘More Risk Averse’ under Expectations.” Journal of Economic Theory,
28 (1982), 361–368.
Oh, G. “Some Results in the CAPM with Nontraded Endowments.” Management Science, 42 (1996),
286–293.
Orosel, G. “Participation Costs, Trend Chasing, and Volatility of Stock Prices.” Review of Financial
Studies, 11 (1998), 521–557.
Pagano, M. “Endogenous Market Thinness and Stock Price Volatility.” Review of Economic Studies,
56 (1989), 269–288.
. “The Flotation of Companies in the Stock Market.” European Economic
Review, 37 (1993), 1101–1135.
Poterba, J., and A. Samwick. “Stock Ownership Patterns, Stock Market Fluctuations and Consump-
tion.” Brookings Papers on Economic Activity, 2 (1995), 295–357.
Roll, R. “A Critique of the Asset Pricing Theory’s Tests—Part 1: On Past and Potential Testability of
the Theory.” Journal of Financial Economics, 4 (1977), 129–176.
Ross, S. “Options and Efficiency.” Quarterly Journal of Economics, 90 (1976), 75–89.
Saito, M. “Limited Participation and Asset Pricing.” Working Paper, Univ. of British Columbia
(1995).
Shiller, R. The New Financial Order. Princeton, NJ: Princeton Univ. Press (2003).
Stein, J. “Informational Externalities and Welfare-Reducing Speculation.” Journal of Political Econ-
omy, 95 (1987), 1123–1145.
Storesletten, K.; C. Telmer; and A. Yaron. “Persistent Idiosyncratic Shocks and Incomplete Markets.”
Working Paper, Carnegie Mellon Univ. (1996).
Telmer, C. “Asset Pricing Puzzles and Incomplete Markets.” Journal of Finance, 48 (1993), 1803–
1832.
Vissing-Jørgensen, A. “Limited Stock Market Participation.” Working Paper, MIT (1997).
. “Towards an Explanation of Household Portfolio Choice Heterogeneity: Non-
Financial Income and Participation Cost Structures.” Working Paper, Univ. of Chicago (2002).
Weil, P. “Equilibrium Asset Prices in Economies with Undiversifiable Labor Income Risk.” Journal
of Economic Dynamics and Control, 16 (1992), 769–790.