A study on the spacial and temporal variation of Algerian durum wheat quality traits
•
1 like•361 views

By: N.Derbal*, A.Tahar, and A.Benbelkacem *Corresponding author: derbal.nora@mail.com
Recommended

Recommended
More Related Content
More from CIMMYT
More from CIMMYT (20)
A study on the spacial and temporal variation of Algerian durum wheat quality traits
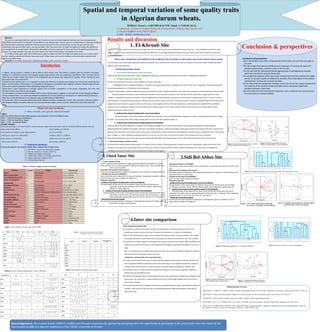
- 1. Spatial and temporal variation of some quality traits in Algerian durum wheats. DERBAL Nora(1) ; A.BENBELKACEM (2)and A TAHAR Ali (1) 1-Laboratoiry of research in plant biology & environnement, Biology dept, Annaba univ. 2- Biotech.& (2) Division INRAAlgeria E-mail : derbal_nora@yahoo.com Abstract: The present study deals with ten quality traits of twenty one durum wheat Algerian varieties over two croping seasons (2009/2010 and 2010/2011) cultivated in three different sites (littoral area, interior plains and high plateaus). Data was analyzed Results and discussion by univariate and multivariate statistical methods each season and for the combined two seasons by site and over sites. Comparisons among and within years, among and within sites have been done to study the spatial and temporal variation of 1. El-Khroub Site Conclusion & perspectives each studied trait by variety tested. Biostatistical data obtained show in general for the majority of the quality characters the The results from the comparisons within years, average values of each trait for every variety, obtained by means of the test t from STUDENT show that for every existence of a large variation over sites and over seasons for most of the varieties considered in the study. variable There are certain varieties which present significant differences to very highly significant between two years, while for the other varieties we observe no In the littoral area, grain yield, kernel black point, grain humidity and TKW were high but yellow berry score, total protein content, semolina content and brown index were poor. Yellow index, ash content semolina, ash and protein contents were significant difference. higher in the other areas. -Mean value comparaison of the different traits studied for the 21 varieties in each season and in both seasons: Anova results. Conclusion and perspectives Keywords: durum wheat, quality traits, biostatistical methods, spatial, temporal, variation. -Test t: the varieties vary from a characteristic to the other one and from one year to In all results we could notice highly significant differences between the 21 varieties and for all the traits with an exception in the brown index in 2009/2010 where the next Introduction: differences were not significant. -THE AVI showed that there are differences h.s between 21 varieties for each of 9 - Multivariate analysis results: studied characteristics, and this a year or for the set2 -The use ACP and the hierarchical analysis gave groups of homogeneous varieties In Algeria, durum wheat is planted in about 65% of total cereals area. This wheat is mainly used for semolina and pasta. 1 – Yearly and two years Manova results for all traits: which are not still the same for three sites. However it is difficult to concile technological quality requirements with the production constraints. Thus, the high rate of Table 6 show that the three tests Wilk’s, Lawley- Hotelling and Pillai’s give similar results than those of the Anova of 2009/2010 & 2O10/2011. -The comparison between three sites a year showed that very few varieties are stable yellow berry and grain black point found in the traditional durum wheat area reduces their quality. These criterias are very dependant from the environment. 2 – Principal components analysis ACP and do not present significant differences between three sites about is the studied Among the main quality traits, it is important to notice the influence of proteins particularly over these that constitutes the the ACP was executed on the matrix of the averages of the data of two years. characteristic. So they are not even varieties gluten. In this fraction of the glutens, it is possible to distinguish a qualitative notion (gluten content), linked to agro-climatic -On the other side the comparison between three sites, for all the 2 years showed that The MINITAB software supplies with figure.1 the graph of the appropriate values according to the ranks of all the main components. This graph shows well factors and another qualitative notion depending on genetic factors. the majority of the varieties remained stable and do not present significant Yellow berry is also depending on nitrogen uptake and on protein composition of the grains, meanwhile, the color and the decreasing importance of the various main components. variations between three sites intensity of spots vary with the causal agent. However, interpretation of these components requires the calculation of the correlations between each of the main components retained with each of the variables. -We notice that the more the data are important, that is obtained over several years, For this purpose, to improve durum wheat (Triticum durum Desf) quality in Algeria in one hand and to classify agro ecological the more there is a spatial stability The examination of the matrix of the correlations shows that the first axis which contains to him only 28,7 % of the information brought by all the initial zones in another hand, this study was initiated to experiment 21 local varieties or introduced in 3 selected sites (El-Khroub, Oued Smar & Sidi Bel-Abbes) in two different seasons (2003/2004 et 2004/2005). variables, is essentially constituted by variables: P.M.G, PROTKH, RDT and IJAUN because the proportion of the variance considered by the axis 1 for each of these 5 This work aims first to study the productivity of the different varieties in among and within sites and also to measure spatial initial variables is in a general superior way 40 %. Whereas the axis 2 which contains only 18,7 % of the information is formed by variables PROTKH and MITA and the and temporal stability of quality traits such as thousand kernel weight, protein content, yellow berry level and coloration proportion of each of which is superior to 35 %. As for the axis 3 which explains 13,8 % of the total information is constituted by the variables RDTS and MOUCH index. which have each a proportion superior to 43 %. Finally, the axis 4 which explains 11,3 % of the total information is only formed by the variable IBRUN with an Material and methods: explained proportion equal to 52,8 %. 1- Sites of study and genetic material tested - Sites: A - Analysis of the cloud of variable points: circle of correlations Data from 2003-2004 and 2004-2005 seasons were analyzed in three the different sites: The representation of ten initial variables in the plan formed by axes 1 and 2 and called factorial foreground is useful, considering the importance of these -Site 1 : ITGC d'El-khroub (Constantine). -Site 2 : ITGC de Oued Smar (Alger). two axes in the reconstruction of the initial variables (that is 47,3 % of the total variation) (figure. 1). 1 M OUCH 4 CEND V18 -Site 3 : ITGC : de Sidi Bel Abbes. B - Analysis of the cloud of points-varieties: graph of the individuals 0,75 3 -Genetic material: 0,5 IB RUN M PG Twenty one genotypes were tested (Table.1), and ten traits per sample were measured in each site and in the different seasons, they are: Knowing that the factorial foreground 1-2 explains only a strong percentage of 47,3 % of the total slowness, we are going to represent thus quite naturally RDT 2 V15 V6 CP2 (18,91 %) 0,25 CP2 (18,91 %) V16 V21 M ITA 1 V19 -Grain yield in Q/ha (RDT) - Grain Hulidity en % (HUM) diagrammatically the individuals (varieties) in this plan. The address and phone number(coordinates) of every point-variety are the values of the axis 1 and the axis 2 0 V12 V4 V1 V9 1 RDTSI N 0 IJA -Thousand Kernel Weight in g/dry matter (P.M.G.) - Ash in % (CEND) (figure 3). The examination of the values of the square cosine and the figure.3 shows that there are 8 individuals or varieties who are represented well in the factorial -0,25 HUM PRTKH -1 V3 V10 V1 V8 V5 V20 V14 V13 -0,5 -Total Protein content in % (PROTKH) - Semolina yield in % (RDTS) plan 1-2 (figure. 2). These individuals (varieties) which are V3, V5, V8, V10, V12, V13, V17 and V21 has values of cos2 varying from 54,4 % to 85,8 %. -0,75 -2 V17 V7 V2 -Black points in % (MOUCH) - Yellow berry rate in % (MITA) Other points-varieties are close to the origin and are consequently little taken into account by axes 1 and 2. Their values of cos2 vary from 0,5 % to 44,4 %. -1 -3 -6 -5 -4 -3 -2 -1 0 1 2 3 4 5 -1 -0,75 -0,5 -0,25 0 0,25 0,5 0,75 1 CP1 (32,81 %) CP1 (32,81 %) - Yellow Index (IJAUN) - Brown Index (IBRUN) 3 - hierarchical analysis: statistical results Figure 5. Graphical representation of the points Figure 4 – Graphical representation of the 10 variables 2- Statistical methods: The hierarchical analysis allowed the grouping of 21 varieties of durum wheat. This grouping which is made by means of a dendrogram, obtained by means of the In the correlation circle in Oued Smar site varieties in the factorial plan 1-2 site of Oued Smar During both seasons, the adopted design was a randomized complete block. method of the simple link and the square distance of Pearson for a level of minimal similarity of 80 %, widely acceptable by the study, allows to distinguish 8 2.1- STUDENT t test for the independent samples homogeneous groups of varieties of durum wheat which are given by the figure 3. 0,65 2.2- One way Analysis of variance (ANOVA) 2.3 –Multivariate Statistical methodes: . 0,7 2.3.1-Multivariate Analysis of variance (MANOVA). 2. Oued Smar Site 3.Sidi Bel-Abbes Site 0,75 Similarité 2.3.2-Main components Analysis (ACP) 0,8 2.3.3- Hierarchique Analysis 0,85 a- T test of student results 0,9 Certain varieties present significant to highly significant differences between the 2 years. A-Results of the test t of STUDENT 0,95 Table.1: Varieties, origins and site of selection Other varieties are not showing significant differences between years. These varieties vary The behavior of the varieties differs from a characteristic in the other one and from one year to the 1 V1 5 from a trait to another. V1 7 V1 2 V1 1 V1 6 V1 9 V1 0 V1 8 V2 1 V1 4 V1 3 V2 0 V1 V8 V3 V4 V6 V9 V5 V7 V2 next. Varieties Symbols Origins Selection site b-Results of the analysis of the variance B-Results of the analysis of the variance There are very highly significant differences between the 21 varieties for and period of time. Figure 6. - Dendrogramme of grouping the 21 durum wheat varieties from 2 years data of Oued Smar Bidi 17 V1 Local landrace I.T.G.C-Guelma 1936 Very highly significant differences were observed between the 21 varieties of wheat what ever the c- Résultats des tests de la MANOVA considered matrix of treated data. Bidi 17/waha /Bidi17 V2 Local cross I.T.G.C. Khroub 4 Data results have been obtained for the two years analysis. Comparison among the varieties C-Results of the tests of the MANOVA 1 Cirta (Hedba/Gd ovz 619) V3 Local cross I.T.G.C-Khroub for all traits did not show any significant differences. V13 Lead in similar results obtained by the AVI 0,75 V5 Gloire de Montgolfier D-Results of the ACP M ITA PRTKH V4 Local landrace I.T.G.C-Tiaret 1980 D-Results of the ACP 0,5 CEND 2 V17 V9 (Rahouia 80) - analysis of the cloud of variable points: circle of correlations - analysis of the cloud of variable points: circle of correlations RDTS RDT CP2 (18,65 %) The examination of the matrix of the correlations shows that the first two axes are CP2 (18,65 %) 0,25 V20 Guemgoum R’Khem V5 Local landrace I.T.G.C. Alger The examination of the matrix of the correlations shows that the first two axes are essentially HUM 0 V4 V8 essentially constituted by variables: P.M.G, PROTKH, MOUCH, MITA, RDTS, constituted by variables: P.M.G, PROTKH, MOUCH, MITA, RDTS, IBRUN and IJAUN ( figure.8) 0 V2 V1 Hedba 03 V6 Local landrace 1921 Alger V3 V18 V11 V19 V14 V7 V21 IBRUN and IJAUN ( figure 5) B) - analysis of the cloud of points-varieties: graph of the individuals V12 V16 V6 Inrat (Sabaou) V7 INRAT/Tunisie Sélection I.T.G.C. Alger B) - analysis of the cloud of points-varieties: graph of the individuals -0,25 IJA UN The examination of the values of the square cosine and the face shows that there are 8 M OUCH M PG -2 V15 Kebir V8 CIMMYT(Mexique)/ICARDA (Syrie) ITGC/Sidi Bel Abbes The examination of the values of the square cosine and the face shows that there are 8 -0,5 individuals or varieties who are represented well in the factorial plan 1-2 (figure). These individuals IB RN Mohamed Ben Bachir V9 Local landrace Population Ben Bachir (1931) individuals or varieties who are represented well in the factorial plan 1-2 (face). (varieties) which are V3, V8, V9, V10, V16, V17, V19 and V21. -0,75 V10 Mexicali (Tassili) V10 CIMMYT(Mexique) Sélection I.T.G.C. Alger These individuals (varieties) which are V3, V8, V9, V10, V16, V17, V19 and V21. E-Results the hierarchical analysis -1 -4 -6 -4 -2 0 2 4 6 -1 -0,75 -0,5 -0,25 0 0,25 0,5 0,75 1 Montpellier (Bibans) Number of varieties with no significant differences. V11 France (Montpellier) I.T.G.C. 1965 Alger E-Results the hierarchical analysis the hierarch