Recommended

Recommended
More Related Content
What's hot
What's hot (20)
Similar to Economic Feasibility of 20% Renewable Energy in Nigeria by 2030
Similar to Economic Feasibility of 20% Renewable Energy in Nigeria by 2030 (20)
Recently uploaded
Recently uploaded (20)
Economic Feasibility of 20% Renewable Energy in Nigeria by 2030
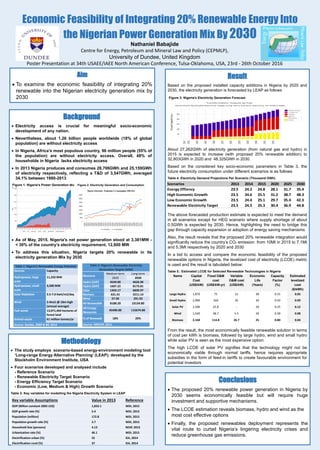
- 1. Economic Feasibility of Integrating 20% Renewable Energy Into the Nigerian Power Generation Mix By 2030 Nathaniel Babajide Centre for Energy, Petroleum and Mineral Law and Policy (CEPMLP), University of Dundee, United Kingdom Poster Presentation at 34th USAEE/IAEE North American Conference, Tulsa-Oklahoma, USA, 23rd - 26th October 2016 Aim To examine the economic feasibility of integrating 20% renewable into the Nigerian electricity generation mix by 2030 Background Electricity access is crucial for meaningful socio-economic development of any nation. Nevertheless, about 1.26 billion people worldwide (18% of global population) are without electricity access In Nigeria, Africa’s most populous country, 96 million people (55% of the population) are without electricity access. Overall, 48% of households in Nigeria lacks electricity access In 2013 Nigeria produces and consumes 28,706GWh and 25,159GWh of electricity respectively, reflecting a T&D of 3,547GWh, averaged 34.1% between 1980-2013 Figure 1: Nigeria’s Power Generation Mix Figure 2: Electricity Generation and Consumption Outlook As of May, 2015, Nigeria's net power generation stood at 3,381MW - < 30% of the country’s electricity requirement, 12,800 MW To address this situation, Nigeria targets 20% renewable in its electricity generation Mix by 2030 Methodology The study employs scenario-based energy-environment modeling tool ‘Long-range Energy Alternative Planning’ (LEAP); developed by the Stockholm Environment Institute, USA Four scenarios developed and analysed include - Reference Scenario - Renewable Electricity Target Scenario - Energy Efficiency Target Scenario - Economic (Low, Medium & High) Growth Scenario Table 3: Key variables for modelling the Nigeria Electricity System in LEAP Result Based on the proposed installed capacity additions in Nigeria by 2020 and 2030, the electricity generation is forecasted by LEAP as follows Figure 3: Nigeria’s Electricity Generation Forecast About 27,262GWh of electricity generation (from natural gas and hydro) in 2015 is expected to increase (with proposed 20% renewable addition) to 32,803GWh in 2020 and 48,325GWh in 2030. Based on the considered key socio-economic parameters in Table 3, the future electricity consumption under different scenarios is as follows Table 4: Electricity Demand Projections Per Scenario (Thousand GWh) The above forecasted production estimate is expected to meet the demand in all scenarios except for HEG scenario where supply shortage of about 0.5GWh is expected by 2030. Hence, highlighting the need to bridge this gap through capacity expansion or adoption of energy saving mechanisms Also, the result reveals that the proposed 20% renewable integration would significantly reduce the country’s CO2 emission from 10Mt in 2015 to 7.1Mt and 5.3Mt respectively by 2020 and 2030 In a bid to access and compare the economic feasibility of the proposed renewable options in Nigeria, the levelized cost of electricity (LCOE) metric is used and the result is tabulated below: Table 5.: Estimated LCOE for Selected Renewable Technologies in Nigeria From the result, the most economically feasible renewable solution in terms of cost per kWh is biomass, followed by large hydro, wind and small hydro while solar PV is seen as the most expensive option. The high LCOE of solar PV signifies that the technology might not be economically viable through normal tariffs, hence requires appropriate subsidies in the form of feed-in tariffs to create favourable environment for potential investors Conclusions The proposed 20% renewable power generation in Nigeria by 2030 seems economically feasible but will require huge investment and supportive mechanisms. The LCOE estimation reveals biomass, hydro and wind as the most cost effective options Finally, the proposed renewables deployment represents the vital route to curtail Nigeria’s lingering electricity crises and reduce greenhouse gas emissions. Key variable Assumptions Value in 2013 Reference GDP (Billion constant 2005 US$) 1,833.1 WDI, 2015 GDP growth rate (%) 5.4 WDI, 2015 Population (million) 172.8 WDI, 2015 Population growth rate (%) 2.7 WDI, 2015 Household Size (persons) 4.13 NESP, 2015 Urbanisation rate (%) 46.1 WDI, 2015 Electrification urban (%) 55 IEA, 2014 Electrification rural (%) 37 IEA, 2014 Table 2: Nigeria’s Renewable Electricity Generation Targets (MW) Resource Medium term 2020 Long term 2030 Hydro (LHP) 4549.00 4626.96 Hydro (SHP) 1607.22 8173.81 Solar 1343.17 6830.97 Biomass 631.41 3211.14 Wind 57.40 291.92 All Renewable 8188.20 23134.80 All Energy Resources 45490.00 115674.00 % of Renewab 18% 20% Source: NREEEP, 2015 Table 1: Nigeria’s Renewable Energy Potential Sources Capacity Hydropower, large scale 11,250 MW Hydropower, small scale 3,500 MW Solar Radiation 3.5-7.0 Kwh/m2/day Wind 2-4m/s @ 10m high (annual average) Fuel wood 13,071,464 hectares of forest land Animal waste 61 million tonnes/yr Source: Sambo, 2009 & BP, 2014 Scenarios 2013 2014 2015 2020 2025 2030 Energy Effiency 23.5 24.2 24.8 28.1 31.7 35.4 High Economic Growth 23.5 24.6 25.5 31.2 38.7 48.3 Low Economic Growth 23.5 24.4 25.1 29.7 35.4 42.3 Renewable Electricity Target 23.5 24.5 25.3 30.4 36.9 44.8 Name Capital Cost (US$/kW) Fixed O&M cost (US$/kW-yr) Variable O&M cost (US$/kW) Economic Life (Years) Capacity Factor (%) Estimated levelized cost ($/kWh) Large Hydro 1,870 75 15 30 0.55 0.05 Small Hydro 2,990 160 35 30 0.50 0.09 Solar PV 2,590 25.8 - 20 0.25 0.12 Wind 1,540 38.7 5.5 20 0.39 0.08 Biomass 2,160 114.8 26.7 25 0.80 0.04