SlideShare a Scribd company logo
1 of 9
Download to read offline
Journal of Economics and Sustainable Development www.iiste.org 
ISSN 2222-1700 (Paper) ISSN 2222-2855 (Online) 
Vol.5, No.15 2014 
CAFTA: China-ASEAN Free Trade Area, Implications on Trade 
and Development 
Mohammad Maruf Hasan 
School of Economics, Northeast Normal University, Changchun, Jilin, PR China 
maruf@nenu.edu.cn 
Jiang Hai Cheng 
School of Economics, Northeast Normal University, Changchun, Jilin, PR China 
jianghc975@nenu.edu.cn 
Li Xuan 
School of Economics, Northeast Normal University, Changchun, Jilin, PR China 
Corresponding author: lix199@nenu.edu.cn 
The research is financed by Asian Development Bank. No. 2006-A171(Sponsoring information) 
Abstract 
Until 2013, Association of southeast Asian nations (ASEAN) is China’s third largest trading partner globally and 
the largest trading partner among all developing countries as well as Asian countries, while China is ASEAN’s 
first trading partner. Since 1990s China and ASEAN become progressively closer in bilateral trade. With the 
exception of 2009, due to world economic crisis, bilateral trade amount has been increasing frequently, 
remarkably, after 2010, when the China-ASEAN Free Trade Area (CAFTA) established. This paper analyzed the 
effect of current regional scenario and trade relations between China-ASEAN and proposed the countermeasures 
for improving further development. 
Keywords: China, Association of Southeast Asian Nations (ASEAN), China-ASEAN Free Trade Area (CAFTA) 
1. Introduction 
The Association of Southeast Asian Nations (ASEAN) is basically economic organization of ten countries 
located in Southeast Asia, formed on 8th August 1967 primarily by Indonesia, Malaysia, Singapore, Thailand and 
Philippines, membership which expanded to include Brunei Darussalam in 1984, Vietnam in 1985, Laos and 
Myanmar in 1997 and Cambodia in 1999. The main purpose is, accelerating socio-economic growth, cultural 
evolution among its members, and also protection of peace throughout the region. ASEAN covers a land area of 
4.435 square kilometer, which is almost 3% of the total land area of the planet, and has a population of about 616 
million people, which is 9% of the total world population. The sea area of ASEAN is approximately three times 
larger than its land area. ASEAN became USD 1 trillion economy in 2006, but ASEAN passed the USD 2 
trillion benchmark in 2011. By 2015, ASEAN will almost reach USD 3 trillion point and will be closer to USD 4 
trillion in 2020. 
48 
Country 
Total land 
Area(sq km) 
Total 
population 
(thousand) 
Gross Domestic Product (GDP) 
At current prices Per capita 
(US$Mn) (PPP$Mn) (US$) (PPP$) 
Brunei 
Darussalam 
5,769 14,741 14,411 37,083 978 
2,516 
+ 
Cambodia 181,035 14,741 14,411 37,083 978 2,516 
Indonesia 1,860,360 244,776 878,223 1,216,868 3,588 4,971 
Lao PDR 236,800 6,514 9,083 18,921 1,394 2,904 
Malaysia 330,290 29,337 305,154 501,079 10,338 16,975 
Myanmar1 676,577 60,976 52,525 90,907 861 1,490 
Philippines 300,000 97,691 250,543 423,925 2,565 4,339 
Singapore 716 5,312 276,610 326,506 52,069 61,461 
Thailand 513,120 67,912 366,127 652,598 5,391 9,609 
Viet Nam 330,958 88,773 141,669 329,034 1,596 3,706 
ASEAN 4,435,624 616,614 2,311,315 3,619,072 3,748 5,869 
The historical links between Southeast Asia and China date back to centuries during which individual countries 
of Southeast Asia and China carried out trade, and cultural relations. Before the 1990s, there was no official
Journal of Economics and Sustainable Development www.iiste.org 
ISSN 2222-1700 (Paper) ISSN 2222-2855 (Online) 
Vol.5, No.15 2014 
relationship between China and ASEAN, however China had official bilateral relations with individual ASEAN 
member states. Since 1980s, China strengthens its efforts to establish diplomatic relations with all the remaining 
ASEAN member states, which leads to official relationship with the ASEAN. During the past decades, the 
economic relationship between China and ASEAN becoming increasingly close and bilateral trade continues to 
boost up. In 2010, China-ASEAN Free Trade Area was established marking the development of China-ASEAN 
bilateral trade had seized a beneficial mark. Since January of 2010, China has reduced tariffs on more than 93 
percent of the traded products to almost zero for ASEAN nations and promoted the China-ASEAN trade 
developed. At the tenth anniversary of the establishment of China-ASEAN strategic partnership in 2013, there 
still exist some barriers to overcome and deficiencies to point out in trade between China and ASEAN. Trade 
between China and ASEAN has proved resilient despite the ambivalent world economic recovery and growing 
protectionism. Trade rose 10.9 percent to 444 billion USD last year, exceeding the 7.6 percent increase in 
China's total foreign trade. 
2. China-ASEAN trade statistics 
2.1. Total Trade between China and major trade partners 
In 2013, total value of imports and exports between China and ASEAN closed at USD 4160.308 billion which 
ranked first of China’s value of imports and exports with major trade partners. In 2013, China’s total value of 
imports and exports to ASEAN was USD 443.611 billion, which results in close trade relationship between 
China and ASEAN. Until 2013, ASEAN is China’s third largest trading partner globally and the largest trading 
partner among all developing countries as well as Asian countries, while China is ASEAN’s first trading partner. 
However, in contrast with EU and United States, China’s trade relations with ASEAN are not as close as with 
EU and United Stated. 
Table 2. China’s Imports and Exports with Major Trade Partners, 2012-2013. (USD billion) 
49 
Country 
(Region) 
2012 
Country 
(Region) 
2013 
Total Value 
of 
Imports and 
Exports 
Growth 
Rate 
(%) 
Share 
(%) 
Total Value 
of 
Imports and 
Exports 
Growth 
Rate 
(%) 
Share 
(%) 
China 38,66.760 6.2 100.0 China 41,60.308 7.6 100 
EU 5,46.043 -3.7 14.1 EU 5,59.040 2.1 13.4 
United 
States 
4,84.683 8.5 12.5 United States 5,21.020 7.4 12.5 
ASEAN 4,00.093 10.3 10.3 ASEAN 4,43.611 10.9 10.7 
Hong Kong, 
Japan 3,41.487 20.5 8.8 
China 
4,01.007 17.4 9.6 
Hong Kong, 
China 
3,29.451 -3.9 8.5 Japan 3,12.553 -5.1 7.5 
Korea Rep. 2,56.329 4.4 6.7 Korea Rep. 2,74.248 7.0 6.6 
Source: Department of Asian Affairs of Ministry of Commerce of the People’s Republic of China 
For import and export, from 2000 to 2008 China’s trade value to ASEAN increased year by year, upped from 
USD 22.181 to 116.974 for import and USD 17.341 billion to USD 114.142 billion for export. From 2002, the 
trade value increased rapidly, up 28.3% than the previous year. In 2009, global financial crisis reduce the total 
import and exports to -8.8% and -6.9% simultaneously. In 2010, by the establishment of ASEAN-China Free 
Trade Area (ACFTA) China’s trade volume to ASEAN boost to USD 154.569 and 138.207 billion for import 
and export with an increase of 44.8 and 30.1 percent. This trend increase sharply from 2010 to 2013, total trade 
increased to USD 199.541 for import and USD 204.272 billion for export, however, in 2013, the growth rate was 
crept down annually, especially in import it reduces a lot. It seems that ASEAN is increasingly becoming an 
important exporter of China. Especially in 2003, value of imports attained a record high with USD 47.327 billion. 
In 2004, the growth rate declined, however from 2005 to 2007, the growth rate accelerated annually. Since 
January 2010, zero tariffs applied on more than 93 percent of products traded between China and ASEAN. 
However starting from 2011, the import growth rate reduces gradually, remarkably in 2013, representing growth 
rate of only 1.9 %.
Journal of Economics and Sustainable Development www.iiste.org 
ISSN 2222-1700 (Paper) ISSN 2222-2855 (Online) 
Vol.5, No.15 2014 
Table 3. Commodities Trade between China and ASEAN, 2000-2013. (USD billion) 
50 
Country 
Exports 
value 
Share of 
China’s 
Exports value 
(%) 
Export growth 
Rate (%) 
Imports 
value 
Share of 
China’s 
Imports value 
(%) 
Import growth 
Rate (%) 
2000 17.341 7.0 --- 22.181 9.9 --- 
2001 18.385 6.9 6.0 23.229 10.3 4.7 
2002 23.569 7.2 28.30 31.198 10.6 34.40 
2003 30.925 7.1 31.2 47.327 11.5 51.7 
2004 42.902 7.2 38.7 62.978 11.2 33.1 
2005 55.371 7.3 29.1 74.999 11.4 19.1 
2006 71.314 7.4 28.79 89.526 11.3 19.37 
2007 94.139 7.7 32.0 108.369 11.3 21.0 
2008 114.142 8.0 20.9 116.974 10.3 7.9 
2009 106.297 8.8 -6.9 106.714 10.6 -8.8 
2010 138.207 8.8 30.1 154.569 11.1 44.8 
2011 170.083 9.0 23.1 192.771 11.1 24.7 
2012 204.272 10.0 20.1 195.821 10.8 1.6 
2013 244.070 11.0 19.48 199.541 10.2 1.9 
Source: Department of Asian Affairs of Ministry of Commerce of the People’s Republic of China 
2.2. Commodities Trade between China-ASEAN 
As the export volume for China-ASEAN, in 2013, China’s total exports to the six ASEAN members, Singapore, 
Malaysia, Indonesia, Vietnam, Thailand and Philippines amounted to USD 193.701 billion, accounting for 
94.82 % of total export volume. There was a big increase compared with 2011, especially China’s exports to 
Malaysia, upped 31 % over the previous year. In contrast, China’s total exports to Myanmar, Cambodia, Brunei 
and Laos was less, therein China’s exports to Brunei and Laos, accounting respectively for less than 1 %. 
But compared with 2011, the exports to Brunei and Laos upped 68.2% and 96.8% over the previous year, 
showing significant growth. Although the volume of exports is low, the economic cooperation is becoming 
increasingly close between Brunei, Laos and other agriculture-based nations. China’s export trade to ASEAN is 
not only limited to old member states, Vietnam is the country joined ASEAN later, but in 2012, the total exports 
to Vietnam was USD 34.21 billion, upped 17.6% over the previous year, accounting for 16.75% of the total 
exports China to ASEAN, exceeding Thailand and Philippines ranked in fourth place. In 2012 the growth rate of 
China’s export to Laos ranked in first among the ten countries, due to Laos holding the ninth Asia Europe 
Meeting, China CAMC Engineering Corp., LTD., China State Construction Engineering Corp. LTD. and other 
Chinese companies specifically provided a lot of projects contracts to guarantee the smooth conduct of the 
summit, these were the main reason for the rapid growth of the trade between China and Laos. For the 2012 
China’s imports from ASEAN was lower than exports. Import trade with Malaysia, Thailand, Myanmar, Laos 
and Brunei showed negative growth. Trade between China and Singapore, Malaysia, Indonesia, Vietnam, 
Thailand and Philippines accounted for 71.65% of China’s total imports from ASEAN. By contrast, imports 
from Myanmar, Laos, Brunei, Cambodia, and Shikoku were lower than other six countries, accounting for 1.35%. 
Table 4. Commodities Trade between China and ASEAN by Country, 2013. (USD billion) 
Export 
Ranking 
Country 
Exports 
value 
Share 
(%) 
Growth 
Rate 
(% 
Import 
Ranking 
Country 
Imports 
value 
Share 
(%) 
Growth 
Rate 
(%) 
1 Singapore 40.752 19.94 14.6 1 Malaysia 58.295 29.77 -6.2 
2 Malaysia 36.518 17.88 31.0 2 Thailand 38.545 19.68 -1.3 
3 Indonesia 34.289 16.79 17.4 3 Indonesia 31.930 16.31 1.9 
4 Vietnam 34.210 16.75 17.6 4 Singapore 28.524 14.57 1.4 
5 Thailand 31.200 15.27 21.4 5 Philippines 19.638 10.03 9.2 
6 Philippines 16.732 8.19 17.4 6 Vietnam 16.229 8.29 46.0 
7 Myanmar 5.673 2.78 17.7 7 Myanmar 1.298 0.66 -22.7 
8 Cambodia 2.708 1.33 17.0 8 Laos 0.791 0.40 -4.1 
9 Brunei 1.252 0.61 68.2 9 Brunei 0.355 0.18 -37.3 
10 Laos 0.937 0.46 96.8 10 Cambodia 0.215 0.11 16.8 
Source: Department of Asian Affairs of Ministry of Commerce of the People’s Republic of China 
China’s imports and exports to ASEAN mainly concentrate on the six countries of Singapore, Malaysia,
Journal of Economics and Sustainable Development www.iiste.org 
ISSN 2222-1700 (Paper) ISSN 2222-2855 (Online) 
Vol.5, No.15 2014 
Indonesia, Thailand, Philippines and Vietnam, therefore China should strengthen the economic cooperation with 
the six countries to ensure the trade development between China and ASEAN. 
2.3. Total Trade by Product 
In 2012, Malaysia, Thailand, Singapore and Indonesia are top four trading countries to China among ten ASEAN 
countries. From Table 5 to Table 8 show the composition of the top ten commodities that the four countries of 
Malaysia, Thailand, Singapore and Indonesia imported and exported to China in 2012. On the export side, 
among the commodities that the four countries exported to China, of which the similar are mechanical and 
electrical products, plastic and rubber, minerals, chemical products, base metals and products, and they were 
mainly agricultural products and materials products. Especially mechanical and electrical products, accounted 
for a large proportion of the commodities that four countries exported to China, ranked first among the 
commodities Malaysia and Singapore exported to China, and the second place of Thailand and the seventh place 
of Indonesia. China’s great demand for minerals indicated that with rapid economic development the demand for 
resource products is increasing. For import, the four countries have the very similar commodity structure of 
imports from China, the top ten commodities are mainly mechanical and electrical products, chemical products, 
transport equipment, plastic and rubber, textiles and raw materials, furniture, toys and miscellaneous 
manufactured articles. In addition, the mechanical and electrical products, plastic and rubber, chemical products 
also occupied a very important position. By mechanical and electrical products as representatives of high-tech 
products, high-tech products accounted for a large proportion of these commodities that the four countries 
exported to China. However the labor-intensive products also accounted for a certain proportion. Malaysia, 
Thailand, Singapore imported optical, watches and medical devices from China, indicating there is an increasing 
demand for these emerging trade products, and the emerging trade products have very potential market prospects. 
Although Singapore is a developed country, still has the similar import and export commodity structure with 
other three countries. China and ASEAN should continue to strengthen the development of hi-tech products and 
constantly improve the export structure to get mutual benefits. Manufactured products trade accounted for a 
larger share of trade between China and ASEAN countries, mainly in the food and beverages and tobacco 
industry, textile industry, machinery and transport equipment and chemical industry. Due to the lower level of 
economy development of the six countries, their imports and exports to China mainly focus on agricultural 
products. Agricultural products trade between ASEAN and China has developed rapidly. These countries are in 
great demand for industrial products. Their import products from China are mainly electronics, refined oil, steel, 
textiles, etc. 
Table 5. Merchandise Trade between China and Malaysia by Product, 2013. (USD million) 
51 
Rank Items 
Exports 
Value 
(2012) 
Exports 
Value 
(2013) 
Growth 
rate 
Share 
(%) 
Items 
Imports 
Value 
(2012) 
Imports 
Value 
(2013) 
Growth 
rate 
Share 
(%) 
Total Value 30,711 32,840 100.0 Total Value 29,762 33,740 13.4 100.0 
1 
Mechanical and 
Electrical Products 
13,744 16,713 -19.8 43.6 
Mechanical and 
Electrical Products 
16,994 18,846 10.9 55.9 
2 Minerals 3,121 3,853 23.5 12.6 
Base Metals and 
Product 
3,134 
4,543 45.0 13.5 
3 Plastics, Rubber 4,324 3,737 -13.6 12.2 Chemical Products 
2,142 
2,224 3.8 6.6 
4 
Animal and 
vegetable fats 
3,561 3,021 -15.2 9.8 Plastics, Rubber 1,016 1,117 9.9 3.3 
5 
Base metals and 
products 
1,023 2,339 
128.6 
7.6 
Optical, watches, 
medical equipment 
906 1,094 20.8 3.2 
6 Chemical Products 2,393 2,056 16.4 7.8 
Transportation 
Equipment 
1,314 897 -31.8 2.7 
7 
Optical, watches, 
medical equipment 
686 
498 
-27.4 1.6 
Textiles and raw 
materials 
821 887 8.0 2.6 
8 
Food and 
Beverages and 
Tobacco 
329 414 25.8 1.4 Minerals 294 766 160.6 2.3 
9 Wood and products 214 250 
17.2 
0.8 Plant products 642 733 14.3 2.2 
10 
Textiles and raw 
materials 
276 224 -18.8 0.7 
Furniture, toys, 
miscellaneous 
manufactured 
articles 
539 601 11.6 1.8 
11 
Transportation 
Equipment 
140 137 -2.2 0.5 
Food, beverages, 
tobacco 
423 424 0.2 1.3 
12 
Furniture, toys, 
miscellaneous 
manufactured 
articles 
72 105 47.1 0.3 Ceramics; glass 371 407 9.8 1.2 
13 Ceramics; glass 86 101 17.6 0.3 
Cellulose pulp; 
paper 
317 346 8.9 1.0 
14 Cultural products 76 74 -3.1 0.2 
Live animals; 
animal products 
343 306 -10.8 0.9 
15 Plant products 49 61 23.4 0.2 Cultural products 171 171 0.4 0.5 
114 
12.5 
16 Other 
106 -7.0 0.3 Other 335 377 
1.1
Journal of Economics and Sustainable Development www.iiste.org 
ISSN 2222-1700 (Paper) ISSN 2222-2855 (Online) 
Vol.5, No.15 2014 
Table 6. Merchandise Trade between China and Thailand by Product, 2013. (USD million) 
52 
Rank Items 
Exports 
Value 
(2012) 
Exports 
Value 
(2013) 
Growth 
rate 
Share 
(%) 
Items 
Imports 
Value 
(2012) 
Imports 
Value 
(2013) 
Growth 
rate 
Share 
(%) 
Total Value 26,730 26,826 100.0 Total Value 37,366 37,613 100.0 
1 Plastics, Rubber 8,552 9,073 6.1 33.8 
Mechanical and 
Electrical Products 
19,620 18,956 -3.4 50.4 
2 
Mechanical and 
Electrical Products 
7,468 5,717 -23.5 21.3 
Base Metals and 
Products 
5,048 
4,921 
-2.5 13.1 
3 Chemical Products 3,142 3,413 8.6 12.7 Chemical Products 2,979 2,932 1.6 7.9 
4 Plant Products 1,895 2,559 35.0 9.5 Plant Products 1,259 2,026 60.9 5.4 
5 Minerals 1,846 2,380 28.9 8.9 Plastics, Rubber 1,648 1,692 2.7 4.5 
Wood and Wood 
6 
Products 
948 1,087 14.7 4.1 
Textiles and raw 
materials 
1,683 1,657 -1.5 4.4 
7 
Textiles and raw 
materials 
388 500 29.0 1.9 
Optical, Watches 
and Medical 
Devices 
983 954 -3.0 2.5 
8 
Optical, watches, 
medical equipment 
414 431 4.3 1.6 Plant Products 711 757 6.5 2.0 
9 
Base metals and 
products 
493 401 -18.6 1.5 
Furniture and Toys 
and 
Miscellaneous 
Products 
668 757 13.4 2.0 
10 
Food, beverages, 
tobacco 
688 390 -43.4 1.5 Ceramics and Glass 596 685 15.0 1.8 
11 
Transportation 
Equipment 
287 207 -28.0 0.8 
Food, beverages, 
tobacco 
410 387 -5.5 1.0 
12 
Live animals; animal 
products 
135 152 12.3 0.6 
Precious metals and 
products 
450 
365 -18.8 1.0 
13 
Cellulose pulp; 
paper 
100 127 27.0 0.5 
Cellulose pulp; 
paper 
322 346 7.5 0.9 
14 
Leather products; 
bags 
111 118 6.1 0.4 
Leather products; 
bags 
256 256 0.1 0.7 
15 
Furniture and Toys 
and 
Miscellaneous 
Products 
66 74 12.5 0.3 
animals; animal 
products 
206 247 19.6 0.7 
16 Other 197 197 -0.1 0.7 Other 575 628 9.1 1.7 
Table 7. Commodities Trade between China and Singapore by Product, 2013. (USD million) 
R 
an 
k 
Items 
Exports 
Value 
(2012) 
Exports 
Value 
(2013) 
Growth rate 
Share 
(% 
) 
Items 
Impor 
ts 
Value 
(2012) 
Imports 
Value 
(2013) 
Gr 
owt 
h 
rat 
e 
Sh 
are 
( 
% 
) 
Total Value 43,974 48,365 10.0 100.0 Total Value 39,211 43,692 
11. 
4 
10 
0.0 
1 
Mechanical and Electrical 
Products 
23,502 26,682 13.5 55.2 
Mechanical and 
Electrical Products 
24,160 26,725 
10. 
6 
61. 
2 
2 Minerals 6,754 5,605 -17.0 11.6 Minerals 2,607 4,229 
62. 
2 
9.7 
3 Plastics, Rubber 4,150 4,732 14.0 9.8 
Base metals and 
products 
3,280 3,689 
12. 
5 
8.4 
4 Chemical Products 4,214 4,674 10.9 9.7 Chemical Products 1,471 1,552 5.4 3.6 
Optical, watches, medical 
5 
equipment 
1,518 2,190 44.3 4.5 
Optical, watches, 
medical equipment 
1,012 1,067 5.4 2.4 
6 Base metals and products 1,085 1,019 -6.1 2.1 
Textiles and Raw 
Materials 
1,062 1,057 -0.5 2.4 
7 Transportation Equipment 810 894 10.3 1.9 
Furniture, toys, 
miscellaneous 
manufactured 
articles 
921 904 -1.9 2.1 
8 
Food and Beverages and 
Tobacco 
796 793 -0.3 1.6 
Transportation 
Equipment 
Products 
1,178 763 
- 
352 
1.8 
9 
Precious metals and 
products 
68 186 173.7 0.4 Plastics, Rubber 749 748 -0.2 1.7 
Food, beverages, 
10 Cellulose pulp; paper 156 132 
-15.0 0.3 
tobacco 
484 517 6.7 1.2 
11 Textiles and raw materials 62 79 28.8 0.2 Ceramics; glass 368 385 4.5 0.9 
12 animals; animal products 22 57 164.2 0.1 
Precious metals 
and products 
260 371 
42. 
4 
0.9 
13 Ceramics; glass 19 46 137.7 0.1 Plant products 323 355 9.7 0.8 
14 
Furniture, toys, 
miscellaneous manufactured 
articles 
36 43 19.7 0.1 
Leather products; 
bags 
302 301 -0.2 0.7 
15 Leather products; bags 6 18 181.5 0.0 
Footwear, 
umbrellas and 
other light 
industrial products 
264 280 6.0 0.6 
16 Other 777 1212 56.0 2.5 Other 768 752 -2.1 1.7
Journal of Economics and Sustainable Development www.iiste.org 
ISSN 2222-1700 (Paper) ISSN 2222-2855 (Online) 
Vol.5, No.15 2014 
Table 7. Merchandise Trade between China and Indonesia by Product, 2013. (USD million) 
53 
Rank Items 
Exports 
Value 
(2012) 
Exports 
Value 
(2013) 
Growth 
rate 
Share 
(%) 
Items 
Imports 
Value 
(2012) 
Imports 
Value 
(2013) 
Growth 
rate 
Share 
(%) 
Total Value 21,660 22,601 4.4 100.0 Total Value 29,387 29,849 1.6 100.0 
1 Minerals 10,562 11,930 13.0 48.8 Mechanical and Electrical Products 13,647 13,966 2.3 46.4 
2 
Animals and Vegetable 
Oils and Fats and 
Waxes- 
3,602 2,483 -31.1 16.6 Base metals and products 3,451 3,496 1.3 11.7 
3 Plastics, Rubber 2,048 1,915 -6.5 9.5 Chemical Products 3,159 3,136 -0.7 10.5 
4 Chemical Products 1,521 1,681 10.5 7.1 Textiles and raw materials 2,398 2,541 6.0 8.5 
5 Cellulose pulp; paper 993 1,201 21.0 4.6 Plastics, Rubber 1,072 1,242 15.8 4.2 
Wood and Wood 
6 
Products 
554 711 28.5 2.6 Transportation Equipment 1,104 1,063 -3.7 3.6 
7 
Textiles and raw 
materials 
448 573 27.9 2.5 Plant products 833 858 3.0 2.9 
8 
Mechanical and 
Electrical Products 
539 519 -3.7 2.1 
Furniture, toys, miscellaneous 
manufactured articles 
650 692 6.5 2.3 
9 
Base metals and 
products 
442 463 4.8 2.0 Food, beverages, tobacco 612 609 -0.6 2.0 
10 
Live Animals and 
Animal Products 
196 283 44.5 0.9 Ceramics; glass 572 463 -19.1 1.6 
11 Plant products 183 228 24.5 0.9 Minerals 601 438 -27.2 1.5 
Food, beverages, 
12 
tobacco 
193 222 15.4 0.9 Optical, watches, medical equipment 432 428 -0.9 1.4 
13 
Footwear, umbrellas 
and other light 
industrial products 
128 146 14.7 0.6 
Footwear, umbrellas and other light 
industrial products 
236 258 9.7 0.9 
14 
Optical, watches, 
medical equipment 
60 78 29.7 0.4 Cellulose pulp; paper 213 245 14.9 0.8 
15 
Transportation 
Equipment 
82 53 -35.7 0.2 Leather products; bags 172 176 2.1 0.6 
16 Other 111 116 4.5 0.5 Other 233 237 1.7 0.8 
2.4. Foreign Direct Investment 
China and ASEAN In 2010 China's utilization of FDI amounted to USD 105.73235 billion of which foreign 
direct investment from ASEAN countries amounted to USD 6.32368 billion, accounting for about 6.0%. For the 
total direct investment from ASEAN into China of which Singapore ranked in first with USD 5.4282 billion, 
accounting for 86%, and Brunei came in second place. In 2011 China's utilization of FDI amounted to USD 
116.00985 billion of which FDI from ASEAN amounted to USD 6.64650 billion, accounting for about 5.7%, 
decreased compared with 2010. Singapore still ranked first with amount of USD 6.09681 billion, FDI from 
Brunei into China declined and ranked in third place. However, Malaysian’s FDI increased. Except for Brunei, 
FDI of Philippines, Indonesia, Laos and Vietnam’s to China all had the decline trend. In contrast, both of FDI 
from Thailand and Myanmar into China increased. In 2010, China's outward FDI flows into ASEAN countries 
was USD 4.405 billion, accounting for 9.8% of outward FDI flows into Asia, and outward FDI stock was USD 
14.35 billion, accounting for 6.3% of outward FDI stock into Asian region. In 2011, China's investment flows 
into ASEAN countries amounted to USD 5.905 billion with an increase of 34.1%, accounting for 13% of 
investment flows in Asia, and outward FDI stock was USD 21.462 billion, accounting for 7.1% of total outward 
FDI stock in Asia, Until the end of 2011, China has established more than 2,400 FDI enterprises in ASEAN, 
hired 117500 local employees. Compared with 2010, China's FDI into ASEAN had an upward trend in 2011. 
Table 8. ASEAN’ FDI in China, 2010-2012. (USD 10,000) 
Country 
(Region) 
2010 2011 2012 
Actually 
used FDI 
Share (%) 
Actually 
used FDI 
Share (%) 
Actually 
used FDI 
Share (%) 
Singapore 542,820 85.84 609,681 91.73 630,508 89.14 
Brunei 30,956 4.90 25,582 3.85 15,109 2.14 
Malaysia 29,433 4.65 35,828 5.39 31,751 4.49 
Philippines 13,806 2.18 11,185 1.68 13,221 1.87 
Indonesia 7,684 1.22 4,607 0.69 6,378 0.90 
Thailand 5,134 0.81 10,120 1.52 7,772 1.10 
Cambodia 1,035 0.16 1,737 0.26 1,660 0.23 
Laos 945 0.15 588 0.09 200 0.03 
Myanmar 352 0.06 1,021 0.15 384 0.05 
Vietnam 203 0.03 129 0.02 316 0.04 
Total 632,368 100.00 664,650 100.00 707299 100.00
Journal of Economics and Sustainable Development www.iiste.org 
ISSN 2222-1700 (Paper) ISSN 2222-2855 (Online) 
Vol.5, No.15 2014 
From the perspective of direct investment flows, China's direct investment into Singapore ranked first among 
other ASEAN countries, and Brunei came in last place. Compared with 2010, China’s outward foreign direct 
investment flows into Myanmar, Thailand, Vietnam and Malaysia declined in 2011. As for FDI stock, at the end 
of 2011, Singapore was in first place ASEAN countries, followed by Myanmar and Cambodia, and Brunei was 
at the bottom in the list. It can be seen the bilateral foreign direct investment was evolving constantly; Chinese 
enterprises invested in these countries mainly concentrate in manufacturing, power development, wholesale and 
retail trade, mining, construction industry and other industries. China should strengthen investment in high-tech 
industries, while China also needs to maintain development of investing to developing countries, so that to get 
complementary advantages, optimize their domestic industrial structure and improve the industrial technology 
and also promote the progress of the host country. 
3. Proposition for Development and Escalating Trade 
3.1. Development of Zero Tariff Policy 
It is obvious that with the cooperation of China, ASEAN economy can be stabilized. By the establishment of 
CAFTA, in 2010, China-ASEAN trade increase extensively. Recently China’s economy external dependence is 
growing, strengthening trade with ASEAN and escalating development of China-ASEAN Free Trade Area can 
help China become accustomed to economic globalization, enhancing the ability to endure economic risks and 
expand China’s economic cooperation with Southeast Asian Nations. Since 2005, China-ASEAN implementing 
tariff reduction policy for almost 7000 commodities. From January 1st, 2010, more than 93 percent of products 
that China traded with ASEAN enjoy zero tariffs. These policies has lead to a lot of positive effects in China- 
ASEAN trade area, eventually, it makes the strengthening of bilateral trade between China and ASEAN. 
Furthermore, China and ASEAN should reinforce the implementation of zero tariff policy to all countries of 
ASEAN. 
3.2. International Trade of China and Implications 
China should adopt a new trade strategy of "winning by quality" by raising the export competitiveness of its 
products and improving the quality and efficiency of its trade. China should be put special focus on 
optimizing China's foreign trade structure, to have more high-quality, hi-tech products, high value-added 
products and home-developed products manufactured and exported to ASEAN. Optimizing the industrial 
structure will be helpful to China-ASEAN trade. China should develop technology-intensive and capital-intensive 
industries rather than labor-intensive industries. China should steadily phase out backward industries 
that compete with ASEAN and should enhance the cooperation with the different countries and regions with 
consensus to their economic and development structure and manufacturing level. China can make full use of 
technological expertise in intensifying cooperation of the expansion of the exploration mineral and biological 
resources, and other major areas to upgrade China's industrial structure. Mechanical and electrical products are 
the major commodities traded between China and ASEAN, which specify high-tech products account for a large 
fraction of China-ASEAN trade. Furthermore, both sides should continue to enhance the proportion of high 
value-added and hi-tech products in trade, it improve the technological content of exporting more high-quality, 
hi-tech products, high value-added products and home-developed products. 
3.3. Improving the Investment Environment 
With the recent developments in the Southeast Asian region, there is no doubt that Asia has already started to 
dominate in this century and China has been the catalyst for progress and prosperity in the region. In order to 
continue the region's growth momentum, China’s focus is now on improving connectivity, a measure of strategic 
importance that will promote intra-regional economic integration and competitiveness. This will be a key factor 
determining the expansion of bilateral trade volumes for the coming years. Recently, China had enhanced its 
investment environment to attract foreign investors. Improving investment environment comprises the setup of 
efficient and transparent administrative system, the improvement of legal system to develop the foreign 
companies. At the same time, China and ASEAN countries should enhance infrastructure to endow with 
favorable conditions for foreign investment. Cultural exchanges are beneficial to attractive friendship and mutual 
understanding between the people of both sides and establishing harmony among relations. Therefore China and 
ASEAN countries should promote the friendly exchanges majorly in the fields of culture and education. 
Particularly in education and technology, the cultural exchange programmes between china and ASEAN could 
facilitate young people to contribute their part in the regional collaboration. 
4. Conclusion 
This paper analyses the development of trade between ASEAN and China on import and export flows focusing 
on the trade of major products. We used data for sixteen categories of goods including manufactured products, 
agricultural products, chemical products, machinery and transport equipment traded between China-ASEAN in 
2013 with comparison to past years. 
China is the largest trading partner of ASEAN and ASEAN has emerged as China's third largest partner, a major 
54
Journal of Economics and Sustainable Development www.iiste.org 
ISSN 2222-1700 (Paper) ISSN 2222-2855 (Online) 
Vol.5, No.15 2014 
investment destination and an important tourist destination. China and ASEAN are working on a free trade area, 
the biggest among developing countries, and plan raise trade volume to one trillion USD by 2020. Previous trade 
statistics shows that the most important factor in China-ASEAN relations is the peace and stability and the most 
important experience is to resolving differences through dialogue. The chaos in Vietnam has cost the country a 
lot, shattering investor confidence and causing unemployment. 
From 2000 to 2013, China's trade with ASEAN had sustained gradual increase except in 2009 due to 
the impact of financial crisis. The total volume of trade amounted to USD 443.611 billion in 2013, of which 
exports reached to USD 244.070 billion, imports amounted to USD 199.541 billion. There are economic 
discrepancies within ASEAN, China-ASEAN trade is mainly concentrated in the five old ASEAN member 
countries and Vietnam. To China the old ASEAN member countries have the similar imports and exports 
commodity structure, for import, mechanical and electrical products and other hi-tech products occupy the main 
part. The new four ASEAN countries relatively are economically backward, exports to China are mainly 
agricultural and animal products, imports are mainly mechanical and electronic products. Recently, chaos in 
Vietnam has cost the country a lot, shattering investor confidence and causing unemployment with the expected 
reduction of trade values. 
In 2012 ASEAN foreign direct investment into China amounted to USD 630.508 billion. In 2012, 
China's outward FDI flows into ASEAN countries were 6.211 billion USD, and Singapore stands in first place. 
In 2013, for the tenth anniversary of China-ASEAN develop strategic partnership, China should take full 
advantage of this opportunity to further comprehensively strengthen mutually beneficial cooperation with 
ASEAN, besides China needs to deepen and expand cooperation with neighboring countries. Practice will 
continue to prove that China's sustainable development and prosperity will bring the important opportunities to 
the neighboring countries including the ASEAN and even to the courtiers all over the world. 
Acknowledgments 
This paper is supported by the Humanities and Social Science Youth Fund Project of the Ministry of education 
of china. (中国教育部人文社会科学青年基金项目 )“The Quality Assessment of Chinese OFDI to ASEAN" 
(《中国对东盟直接投资的质量评价及优化对策研究》)Project Number: 13YJC 790083. 
References 
Qiu H., Yang J., Huang J., & Chen R. (2007). Impact of China–ASEAN Free Trade Area on China’s Inter 
national Agricultural Trade and Its Regional Development. China & World Economy, 15, 77-90 
Park D., Innwon P., Esther B. G., & Estrada (2009). Prospects for ASEAN-China Free Trade Area: A Qualitative 
and Quantitative Analysis. China & World Economy, 17, 104-120 
Wong J, & Chan S., (2003). CHINA-ASEAN FREE TRADE AGEREEMENTChina-Asean Free Trade 
Agreement: Shaping Future Economic Relations.University of California Press.Asian Survey, 43, 507-526 
Tongzon J. L. (2005). ASEAN-China Free Trade Area: A Bane or Boon for ASEAN Countries?.Biackwell 
Publishing Ltd 
55
The IISTE is a pioneer in the Open-Access hosting service and academic event 
management. The aim of the firm is Accelerating Global Knowledge Sharing. 
More information about the firm can be found on the homepage: 
http://www.iiste.org 
CALL FOR JOURNAL PAPERS 
There are more than 30 peer-reviewed academic journals hosted under the hosting 
platform. 
Prospective authors of journals can find the submission instruction on the 
following page: http://www.iiste.org/journals/ All the journals articles are available 
online to the readers all over the world without financial, legal, or technical barriers 
other than those inseparable from gaining access to the internet itself. Paper version 
of the journals is also available upon request of readers and authors. 
MORE RESOURCES 
Book publication information: http://www.iiste.org/book/ 
IISTE Knowledge Sharing Partners 
EBSCO, Index Copernicus, Ulrich's Periodicals Directory, JournalTOCS, PKP Open 
Archives Harvester, Bielefeld Academic Search Engine, Elektronische 
Zeitschriftenbibliothek EZB, Open J-Gate, OCLC WorldCat, Universe Digtial 
Library , NewJour, Google Scholar

More Related Content

What's hot

Trends in international trade WTO report 2017-18 | International Trade | Ba...
Trends in international trade   WTO report 2017-18 | International Trade | Ba...Trends in international trade   WTO report 2017-18 | International Trade | Ba...
Trends in international trade WTO report 2017-18 | International Trade | Ba...Sachin Paurush
 
01.2012, REPORT, Managing Mongolia's Resource Boom, Asel Isakova, Alexander P...
01.2012, REPORT, Managing Mongolia's Resource Boom, Asel Isakova, Alexander P...01.2012, REPORT, Managing Mongolia's Resource Boom, Asel Isakova, Alexander P...
01.2012, REPORT, Managing Mongolia's Resource Boom, Asel Isakova, Alexander P...The Business Council of Mongolia
 
Resource curse, Mining boom, Mongolia
Resource curse, Mining boom, MongoliaResource curse, Mining boom, Mongolia
Resource curse, Mining boom, MongoliaSharkhuu Munkhbat
 
Main directions of improvement of the process of investment attraction
Main directions of improvement of the process of investment attractionMain directions of improvement of the process of investment attraction
Main directions of improvement of the process of investment attractionSubmissionResearchpa
 
09.10.2011 What opportunities exist for private equity investors within Mongo...
09.10.2011 What opportunities exist for private equity investors within Mongo...09.10.2011 What opportunities exist for private equity investors within Mongo...
09.10.2011 What opportunities exist for private equity investors within Mongo...The Business Council of Mongolia
 
CHINA GONE GLOBAL (Part 1)
CHINA GONE GLOBAL (Part 1)CHINA GONE GLOBAL (Part 1)
CHINA GONE GLOBAL (Part 1)Jack Garrity
 
Nuraliyev Aidar_The economic relations between Russia and China
Nuraliyev Aidar_The economic relations between Russia and ChinaNuraliyev Aidar_The economic relations between Russia and China
Nuraliyev Aidar_The economic relations between Russia and ChinaAidar Nuraliyev
 
Russia tourism report, 2013
Russia tourism report, 2013Russia tourism report, 2013
Russia tourism report, 2013Stark Tourism
 
China By The Numbers
China By The NumbersChina By The Numbers
China By The NumbersEcon Matters
 
Economic consequences of brexit OECD April 2016
Economic consequences of brexit OECD April 2016Economic consequences of brexit OECD April 2016
Economic consequences of brexit OECD April 2016OECD, Economics Department
 
Irfan mumbaPerformance of Global Stock Market Intgration: Empirical Evidencce...
Irfan mumbaPerformance of Global Stock Market Intgration: Empirical Evidencce...Irfan mumbaPerformance of Global Stock Market Intgration: Empirical Evidencce...
Irfan mumbaPerformance of Global Stock Market Intgration: Empirical Evidencce...Mohammad Irfan
 
The China Compass - Figures, Forecast and Analysis - January 2014
The China Compass - Figures, Forecast and Analysis - January 2014The China Compass - Figures, Forecast and Analysis - January 2014
The China Compass - Figures, Forecast and Analysis - January 2014Daniel Galvez
 
The China Compass - Figures, Forecast and Analysis - January 2014
The China Compass - Figures, Forecast and Analysis - January 2014The China Compass - Figures, Forecast and Analysis - January 2014
The China Compass - Figures, Forecast and Analysis - January 2014William Dey-Chao
 
An Analysis of Constraints to Economic and Trade Cooperation between the Chin...
An Analysis of Constraints to Economic and Trade Cooperation between the Chin...An Analysis of Constraints to Economic and Trade Cooperation between the Chin...
An Analysis of Constraints to Economic and Trade Cooperation between the Chin...Dr. Amarjeet Singh
 

What's hot (20)

Trends in international trade WTO report 2017-18 | International Trade | Ba...
Trends in international trade   WTO report 2017-18 | International Trade | Ba...Trends in international trade   WTO report 2017-18 | International Trade | Ba...
Trends in international trade WTO report 2017-18 | International Trade | Ba...
 
01.2012, REPORT, Managing Mongolia's Resource Boom, Asel Isakova, Alexander P...
01.2012, REPORT, Managing Mongolia's Resource Boom, Asel Isakova, Alexander P...01.2012, REPORT, Managing Mongolia's Resource Boom, Asel Isakova, Alexander P...
01.2012, REPORT, Managing Mongolia's Resource Boom, Asel Isakova, Alexander P...
 
Resource curse, Mining boom, Mongolia
Resource curse, Mining boom, MongoliaResource curse, Mining boom, Mongolia
Resource curse, Mining boom, Mongolia
 
Main directions of improvement of the process of investment attraction
Main directions of improvement of the process of investment attractionMain directions of improvement of the process of investment attraction
Main directions of improvement of the process of investment attraction
 
China Japan relations and the East Asia region
China Japan relations and the East Asia regionChina Japan relations and the East Asia region
China Japan relations and the East Asia region
 
09.10.2011 What opportunities exist for private equity investors within Mongo...
09.10.2011 What opportunities exist for private equity investors within Mongo...09.10.2011 What opportunities exist for private equity investors within Mongo...
09.10.2011 What opportunities exist for private equity investors within Mongo...
 
CHINA GONE GLOBAL (Part 1)
CHINA GONE GLOBAL (Part 1)CHINA GONE GLOBAL (Part 1)
CHINA GONE GLOBAL (Part 1)
 
Nuraliyev Aidar_The economic relations between Russia and China
Nuraliyev Aidar_The economic relations between Russia and ChinaNuraliyev Aidar_The economic relations between Russia and China
Nuraliyev Aidar_The economic relations between Russia and China
 
Vol25_Russia_rebalances_its_economic_focus
Vol25_Russia_rebalances_its_economic_focusVol25_Russia_rebalances_its_economic_focus
Vol25_Russia_rebalances_its_economic_focus
 
CASE Network Studies and Analyses 205 - Moldova in 1995 - 1999: Macroeconomic...
CASE Network Studies and Analyses 205 - Moldova in 1995 - 1999: Macroeconomic...CASE Network Studies and Analyses 205 - Moldova in 1995 - 1999: Macroeconomic...
CASE Network Studies and Analyses 205 - Moldova in 1995 - 1999: Macroeconomic...
 
Dp5151
Dp5151Dp5151
Dp5151
 
USIS Review March 2016
USIS Review March 2016USIS Review March 2016
USIS Review March 2016
 
Russia tourism report, 2013
Russia tourism report, 2013Russia tourism report, 2013
Russia tourism report, 2013
 
79 i chronicle
79 i chronicle79 i chronicle
79 i chronicle
 
China By The Numbers
China By The NumbersChina By The Numbers
China By The Numbers
 
Economic consequences of brexit OECD April 2016
Economic consequences of brexit OECD April 2016Economic consequences of brexit OECD April 2016
Economic consequences of brexit OECD April 2016
 
Irfan mumbaPerformance of Global Stock Market Intgration: Empirical Evidencce...
Irfan mumbaPerformance of Global Stock Market Intgration: Empirical Evidencce...Irfan mumbaPerformance of Global Stock Market Intgration: Empirical Evidencce...
Irfan mumbaPerformance of Global Stock Market Intgration: Empirical Evidencce...
 
The China Compass - Figures, Forecast and Analysis - January 2014
The China Compass - Figures, Forecast and Analysis - January 2014The China Compass - Figures, Forecast and Analysis - January 2014
The China Compass - Figures, Forecast and Analysis - January 2014
 
The China Compass - Figures, Forecast and Analysis - January 2014
The China Compass - Figures, Forecast and Analysis - January 2014The China Compass - Figures, Forecast and Analysis - January 2014
The China Compass - Figures, Forecast and Analysis - January 2014
 
An Analysis of Constraints to Economic and Trade Cooperation between the Chin...
An Analysis of Constraints to Economic and Trade Cooperation between the Chin...An Analysis of Constraints to Economic and Trade Cooperation between the Chin...
An Analysis of Constraints to Economic and Trade Cooperation between the Chin...
 

Similar to Cafta china-asean free trade area, implications on trade and development

Economy of South Korea and Economy of China assignment from International Dev...
Economy of South Korea and Economy of China assignment from International Dev...Economy of South Korea and Economy of China assignment from International Dev...
Economy of South Korea and Economy of China assignment from International Dev...Md. Moazzem Hossain
 
Consumer Trends and Expansion of Retail Markets in Growing ASEAN Economies No...
Consumer Trends and Expansion of Retail Markets in Growing ASEAN Economies No...Consumer Trends and Expansion of Retail Markets in Growing ASEAN Economies No...
Consumer Trends and Expansion of Retail Markets in Growing ASEAN Economies No...Utai Sukviwatsirikul
 
China's Economic ties with ASEAN Countries
China's Economic ties with ASEAN CountriesChina's Economic ties with ASEAN Countries
China's Economic ties with ASEAN CountriesDr Dev Kambhampati
 
Asian monetary cooperation£ºtheory and possibility
Asian monetary cooperation£ºtheory and possibilityAsian monetary cooperation£ºtheory and possibility
Asian monetary cooperation£ºtheory and possibilityR_24
 
Iftekhar's papers on an evalution of the trade relations of bangladesh with a...
Iftekhar's papers on an evalution of the trade relations of bangladesh with a...Iftekhar's papers on an evalution of the trade relations of bangladesh with a...
Iftekhar's papers on an evalution of the trade relations of bangladesh with a...iftekharchy
 
An evaluation of the trade relations of bangladesh with asean
An evaluation of the trade relations of bangladesh with aseanAn evaluation of the trade relations of bangladesh with asean
An evaluation of the trade relations of bangladesh with aseanAlexander Decker
 
India’s Foreign Trade – An Overview
India’s Foreign Trade – An OverviewIndia’s Foreign Trade – An Overview
India’s Foreign Trade – An OverviewDr. Amarjeet Singh
 
Doing business in_vietnam_2013
Doing business in_vietnam_2013Doing business in_vietnam_2013
Doing business in_vietnam_2013Sang Pham
 
India and Asian Economy & Trade with Special Reference to Connect Central Asi...
India and Asian Economy & Trade with Special Reference to Connect Central Asi...India and Asian Economy & Trade with Special Reference to Connect Central Asi...
India and Asian Economy & Trade with Special Reference to Connect Central Asi...paperpublications3
 
Pwc vietnam-future-of-asean-vietnam-perspective
Pwc vietnam-future-of-asean-vietnam-perspectivePwc vietnam-future-of-asean-vietnam-perspective
Pwc vietnam-future-of-asean-vietnam-perspectiveTrnHoQuang1
 
Thailand country report 2013 q4
Thailand country report 2013 q4Thailand country report 2013 q4
Thailand country report 2013 q4Uli Kaiser
 
Export & Import in India report
Export & Import in India reportExport & Import in India report
Export & Import in India reportjpdas54
 

Similar to Cafta china-asean free trade area, implications on trade and development (20)

Economy of South Korea and Economy of China assignment from International Dev...
Economy of South Korea and Economy of China assignment from International Dev...Economy of South Korea and Economy of China assignment from International Dev...
Economy of South Korea and Economy of China assignment from International Dev...
 
Np2013182
Np2013182Np2013182
Np2013182
 
Consumer Trends and Expansion of Retail Markets in Growing ASEAN Economies No...
Consumer Trends and Expansion of Retail Markets in Growing ASEAN Economies No...Consumer Trends and Expansion of Retail Markets in Growing ASEAN Economies No...
Consumer Trends and Expansion of Retail Markets in Growing ASEAN Economies No...
 
Surin Pitsuwan. ASEAN.Interview
Surin Pitsuwan. ASEAN.InterviewSurin Pitsuwan. ASEAN.Interview
Surin Pitsuwan. ASEAN.Interview
 
China's Economic ties with ASEAN Countries
China's Economic ties with ASEAN CountriesChina's Economic ties with ASEAN Countries
China's Economic ties with ASEAN Countries
 
Promotion of Intra-Trade and Investment for a Cohesive and Responsive ASEAN C...
Promotion of Intra-Trade and Investment for a Cohesive and Responsive ASEAN C...Promotion of Intra-Trade and Investment for a Cohesive and Responsive ASEAN C...
Promotion of Intra-Trade and Investment for a Cohesive and Responsive ASEAN C...
 
Asian monetary cooperation£ºtheory and possibility
Asian monetary cooperation£ºtheory and possibilityAsian monetary cooperation£ºtheory and possibility
Asian monetary cooperation£ºtheory and possibility
 
Iftekhar's papers on an evalution of the trade relations of bangladesh with a...
Iftekhar's papers on an evalution of the trade relations of bangladesh with a...Iftekhar's papers on an evalution of the trade relations of bangladesh with a...
Iftekhar's papers on an evalution of the trade relations of bangladesh with a...
 
An evaluation of the trade relations of bangladesh with asean
An evaluation of the trade relations of bangladesh with aseanAn evaluation of the trade relations of bangladesh with asean
An evaluation of the trade relations of bangladesh with asean
 
India’s Foreign Trade – An Overview
India’s Foreign Trade – An OverviewIndia’s Foreign Trade – An Overview
India’s Foreign Trade – An Overview
 
Doing business in_vietnam_2013
Doing business in_vietnam_2013Doing business in_vietnam_2013
Doing business in_vietnam_2013
 
Telisa ui
Telisa uiTelisa ui
Telisa ui
 
Vietnam Packaged Food Overview
Vietnam Packaged Food Overview  Vietnam Packaged Food Overview
Vietnam Packaged Food Overview
 
Terms of trade
Terms of trade Terms of trade
Terms of trade
 
India and Asian Economy & Trade with Special Reference to Connect Central Asi...
India and Asian Economy & Trade with Special Reference to Connect Central Asi...India and Asian Economy & Trade with Special Reference to Connect Central Asi...
India and Asian Economy & Trade with Special Reference to Connect Central Asi...
 
Pwc vietnam-future-of-asean-vietnam-perspective
Pwc vietnam-future-of-asean-vietnam-perspectivePwc vietnam-future-of-asean-vietnam-perspective
Pwc vietnam-future-of-asean-vietnam-perspective
 
Economist
EconomistEconomist
Economist
 
Thailand country report 2013 q4
Thailand country report 2013 q4Thailand country report 2013 q4
Thailand country report 2013 q4
 
IB.docx
IB.docxIB.docx
IB.docx
 
Export & Import in India report
Export & Import in India reportExport & Import in India report
Export & Import in India report
 

More from Alexander Decker

Abnormalities of hormones and inflammatory cytokines in women affected with p...
Abnormalities of hormones and inflammatory cytokines in women affected with p...Abnormalities of hormones and inflammatory cytokines in women affected with p...
Abnormalities of hormones and inflammatory cytokines in women affected with p...Alexander Decker
 
A validation of the adverse childhood experiences scale in
A validation of the adverse childhood experiences scale inA validation of the adverse childhood experiences scale in
A validation of the adverse childhood experiences scale inAlexander Decker
 
A usability evaluation framework for b2 c e commerce websites
A usability evaluation framework for b2 c e commerce websitesA usability evaluation framework for b2 c e commerce websites
A usability evaluation framework for b2 c e commerce websitesAlexander Decker
 
A universal model for managing the marketing executives in nigerian banks
A universal model for managing the marketing executives in nigerian banksA universal model for managing the marketing executives in nigerian banks
A universal model for managing the marketing executives in nigerian banksAlexander Decker
 
A unique common fixed point theorems in generalized d
A unique common fixed point theorems in generalized dA unique common fixed point theorems in generalized d
A unique common fixed point theorems in generalized dAlexander Decker
 
A trends of salmonella and antibiotic resistance
A trends of salmonella and antibiotic resistanceA trends of salmonella and antibiotic resistance
A trends of salmonella and antibiotic resistanceAlexander Decker
 
A transformational generative approach towards understanding al-istifham
A transformational  generative approach towards understanding al-istifhamA transformational  generative approach towards understanding al-istifham
A transformational generative approach towards understanding al-istifhamAlexander Decker
 
A time series analysis of the determinants of savings in namibia
A time series analysis of the determinants of savings in namibiaA time series analysis of the determinants of savings in namibia
A time series analysis of the determinants of savings in namibiaAlexander Decker
 
A therapy for physical and mental fitness of school children
A therapy for physical and mental fitness of school childrenA therapy for physical and mental fitness of school children
A therapy for physical and mental fitness of school childrenAlexander Decker
 
A theory of efficiency for managing the marketing executives in nigerian banks
A theory of efficiency for managing the marketing executives in nigerian banksA theory of efficiency for managing the marketing executives in nigerian banks
A theory of efficiency for managing the marketing executives in nigerian banksAlexander Decker
 
A systematic evaluation of link budget for
A systematic evaluation of link budget forA systematic evaluation of link budget for
A systematic evaluation of link budget forAlexander Decker
 
A synthetic review of contraceptive supplies in punjab
A synthetic review of contraceptive supplies in punjabA synthetic review of contraceptive supplies in punjab
A synthetic review of contraceptive supplies in punjabAlexander Decker
 
A synthesis of taylor’s and fayol’s management approaches for managing market...
A synthesis of taylor’s and fayol’s management approaches for managing market...A synthesis of taylor’s and fayol’s management approaches for managing market...
A synthesis of taylor’s and fayol’s management approaches for managing market...Alexander Decker
 
A survey paper on sequence pattern mining with incremental
A survey paper on sequence pattern mining with incrementalA survey paper on sequence pattern mining with incremental
A survey paper on sequence pattern mining with incrementalAlexander Decker
 
A survey on live virtual machine migrations and its techniques
A survey on live virtual machine migrations and its techniquesA survey on live virtual machine migrations and its techniques
A survey on live virtual machine migrations and its techniquesAlexander Decker
 
A survey on data mining and analysis in hadoop and mongo db
A survey on data mining and analysis in hadoop and mongo dbA survey on data mining and analysis in hadoop and mongo db
A survey on data mining and analysis in hadoop and mongo dbAlexander Decker
 
A survey on challenges to the media cloud
A survey on challenges to the media cloudA survey on challenges to the media cloud
A survey on challenges to the media cloudAlexander Decker
 
A survey of provenance leveraged
A survey of provenance leveragedA survey of provenance leveraged
A survey of provenance leveragedAlexander Decker
 
A survey of private equity investments in kenya
A survey of private equity investments in kenyaA survey of private equity investments in kenya
A survey of private equity investments in kenyaAlexander Decker
 
A study to measures the financial health of
A study to measures the financial health ofA study to measures the financial health of
A study to measures the financial health ofAlexander Decker
 

More from Alexander Decker (20)

Abnormalities of hormones and inflammatory cytokines in women affected with p...
Abnormalities of hormones and inflammatory cytokines in women affected with p...Abnormalities of hormones and inflammatory cytokines in women affected with p...
Abnormalities of hormones and inflammatory cytokines in women affected with p...
 
A validation of the adverse childhood experiences scale in
A validation of the adverse childhood experiences scale inA validation of the adverse childhood experiences scale in
A validation of the adverse childhood experiences scale in
 
A usability evaluation framework for b2 c e commerce websites
A usability evaluation framework for b2 c e commerce websitesA usability evaluation framework for b2 c e commerce websites
A usability evaluation framework for b2 c e commerce websites
 
A universal model for managing the marketing executives in nigerian banks
A universal model for managing the marketing executives in nigerian banksA universal model for managing the marketing executives in nigerian banks
A universal model for managing the marketing executives in nigerian banks
 
A unique common fixed point theorems in generalized d
A unique common fixed point theorems in generalized dA unique common fixed point theorems in generalized d
A unique common fixed point theorems in generalized d
 
A trends of salmonella and antibiotic resistance
A trends of salmonella and antibiotic resistanceA trends of salmonella and antibiotic resistance
A trends of salmonella and antibiotic resistance
 
A transformational generative approach towards understanding al-istifham
A transformational  generative approach towards understanding al-istifhamA transformational  generative approach towards understanding al-istifham
A transformational generative approach towards understanding al-istifham
 
A time series analysis of the determinants of savings in namibia
A time series analysis of the determinants of savings in namibiaA time series analysis of the determinants of savings in namibia
A time series analysis of the determinants of savings in namibia
 
A therapy for physical and mental fitness of school children
A therapy for physical and mental fitness of school childrenA therapy for physical and mental fitness of school children
A therapy for physical and mental fitness of school children
 
A theory of efficiency for managing the marketing executives in nigerian banks
A theory of efficiency for managing the marketing executives in nigerian banksA theory of efficiency for managing the marketing executives in nigerian banks
A theory of efficiency for managing the marketing executives in nigerian banks
 
A systematic evaluation of link budget for
A systematic evaluation of link budget forA systematic evaluation of link budget for
A systematic evaluation of link budget for
 
A synthetic review of contraceptive supplies in punjab
A synthetic review of contraceptive supplies in punjabA synthetic review of contraceptive supplies in punjab
A synthetic review of contraceptive supplies in punjab
 
A synthesis of taylor’s and fayol’s management approaches for managing market...
A synthesis of taylor’s and fayol’s management approaches for managing market...A synthesis of taylor’s and fayol’s management approaches for managing market...
A synthesis of taylor’s and fayol’s management approaches for managing market...
 
A survey paper on sequence pattern mining with incremental
A survey paper on sequence pattern mining with incrementalA survey paper on sequence pattern mining with incremental
A survey paper on sequence pattern mining with incremental
 
A survey on live virtual machine migrations and its techniques
A survey on live virtual machine migrations and its techniquesA survey on live virtual machine migrations and its techniques
A survey on live virtual machine migrations and its techniques
 
A survey on data mining and analysis in hadoop and mongo db
A survey on data mining and analysis in hadoop and mongo dbA survey on data mining and analysis in hadoop and mongo db
A survey on data mining and analysis in hadoop and mongo db
 
A survey on challenges to the media cloud
A survey on challenges to the media cloudA survey on challenges to the media cloud
A survey on challenges to the media cloud
 
A survey of provenance leveraged
A survey of provenance leveragedA survey of provenance leveraged
A survey of provenance leveraged
 
A survey of private equity investments in kenya
A survey of private equity investments in kenyaA survey of private equity investments in kenya
A survey of private equity investments in kenya
 
A study to measures the financial health of
A study to measures the financial health ofA study to measures the financial health of
A study to measures the financial health of
 

Recently uploaded

907MTAMount Coventry University Bachelor's Diploma in Engineering
907MTAMount Coventry University Bachelor's Diploma in Engineering907MTAMount Coventry University Bachelor's Diploma in Engineering
907MTAMount Coventry University Bachelor's Diploma in EngineeringFi sss
 
(办理学位证)(Rice毕业证)莱斯大学毕业证成绩单修改留信学历认证原版一模一样
(办理学位证)(Rice毕业证)莱斯大学毕业证成绩单修改留信学历认证原版一模一样(办理学位证)(Rice毕业证)莱斯大学毕业证成绩单修改留信学历认证原版一模一样
(办理学位证)(Rice毕业证)莱斯大学毕业证成绩单修改留信学历认证原版一模一样gfghbihg
 
原版1:1定制中央昆士兰大学毕业证(CQU毕业证)#文凭成绩单#真实留信学历认证永久存档
原版1:1定制中央昆士兰大学毕业证(CQU毕业证)#文凭成绩单#真实留信学历认证永久存档原版1:1定制中央昆士兰大学毕业证(CQU毕业证)#文凭成绩单#真实留信学历认证永久存档
原版1:1定制中央昆士兰大学毕业证(CQU毕业证)#文凭成绩单#真实留信学历认证永久存档208367051
 
办理克莱姆森大学毕业证成绩单|购买美国文凭证书
办理克莱姆森大学毕业证成绩单|购买美国文凭证书办理克莱姆森大学毕业证成绩单|购买美国文凭证书
办理克莱姆森大学毕业证成绩单|购买美国文凭证书zdzoqco
 
Building a Future Where Everyone Can Ride and Drive Electric by Bridget Gilmore
Building a Future Where Everyone Can Ride and Drive Electric by Bridget GilmoreBuilding a Future Where Everyone Can Ride and Drive Electric by Bridget Gilmore
Building a Future Where Everyone Can Ride and Drive Electric by Bridget GilmoreForth
 
Pros and cons of buying used fleet vehicles.pptx
Pros and cons of buying used fleet vehicles.pptxPros and cons of buying used fleet vehicles.pptx
Pros and cons of buying used fleet vehicles.pptxjennifermiller8137
 
-The-Present-Simple-Tense.pdf english hh
-The-Present-Simple-Tense.pdf english hh-The-Present-Simple-Tense.pdf english hh
-The-Present-Simple-Tense.pdf english hhmhamadhawlery16
 
Mastering Mercedes Engine Care Top Tips for Rowlett, TX Residents
Mastering Mercedes Engine Care Top Tips for Rowlett, TX ResidentsMastering Mercedes Engine Care Top Tips for Rowlett, TX Residents
Mastering Mercedes Engine Care Top Tips for Rowlett, TX ResidentsRowlett Motorwerks
 
Dubai Call Girls Services Call 09900000000
Dubai Call Girls Services Call 09900000000Dubai Call Girls Services Call 09900000000
Dubai Call Girls Services Call 09900000000Komal Khan
 
call girls in Jama Masjid (DELHI) 🔝 >༒9953330565🔝 genuine Escort Service 🔝✔️✔️
call girls in Jama Masjid (DELHI) 🔝 >༒9953330565🔝 genuine Escort Service 🔝✔️✔️call girls in Jama Masjid (DELHI) 🔝 >༒9953330565🔝 genuine Escort Service 🔝✔️✔️
call girls in Jama Masjid (DELHI) 🔝 >༒9953330565🔝 genuine Escort Service 🔝✔️✔️9953056974 Low Rate Call Girls In Saket, Delhi NCR
 
办理科廷科技大学毕业证Curtin毕业证留信学历认证
办理科廷科技大学毕业证Curtin毕业证留信学历认证办理科廷科技大学毕业证Curtin毕业证留信学历认证
办理科廷科技大学毕业证Curtin毕业证留信学历认证jdkhjh
 
( Best ) Genuine Call Girls In Mandi House =DELHI-| 8377087607
( Best ) Genuine Call Girls In Mandi House =DELHI-| 8377087607( Best ) Genuine Call Girls In Mandi House =DELHI-| 8377087607
( Best ) Genuine Call Girls In Mandi House =DELHI-| 8377087607dollysharma2066
 
办理(PITT毕业证书)美国匹兹堡大学毕业证成绩单原版一比一
办理(PITT毕业证书)美国匹兹堡大学毕业证成绩单原版一比一办理(PITT毕业证书)美国匹兹堡大学毕业证成绩单原版一比一
办理(PITT毕业证书)美国匹兹堡大学毕业证成绩单原版一比一F La
 
(办理学位证)(Toledo毕业证)托莱多大学毕业证成绩单修改留信学历认证原版一模一样
(办理学位证)(Toledo毕业证)托莱多大学毕业证成绩单修改留信学历认证原版一模一样(办理学位证)(Toledo毕业证)托莱多大学毕业证成绩单修改留信学历认证原版一模一样
(办理学位证)(Toledo毕业证)托莱多大学毕业证成绩单修改留信学历认证原版一模一样gfghbihg
 
(USQ毕业证)南昆士兰大学毕业证学位证成绩单修改留信学历认证原版一比一
(USQ毕业证)南昆士兰大学毕业证学位证成绩单修改留信学历认证原版一比一(USQ毕业证)南昆士兰大学毕业证学位证成绩单修改留信学历认证原版一比一
(USQ毕业证)南昆士兰大学毕业证学位证成绩单修改留信学历认证原版一比一gfghbihg
 
Call Girls Vastrapur 7397865700 Ridhima Hire Me Full Night
Call Girls Vastrapur 7397865700 Ridhima Hire Me Full NightCall Girls Vastrapur 7397865700 Ridhima Hire Me Full Night
Call Girls Vastrapur 7397865700 Ridhima Hire Me Full Nightssuser7cb4ff
 
办理昆士兰科技大学毕业证QUT毕业证留信学历认证
办理昆士兰科技大学毕业证QUT毕业证留信学历认证办理昆士兰科技大学毕业证QUT毕业证留信学历认证
办理昆士兰科技大学毕业证QUT毕业证留信学历认证jdkhjh
 
Equity & Freight Electrification by Jose Miguel Acosta Cordova
Equity & Freight Electrification by Jose Miguel Acosta CordovaEquity & Freight Electrification by Jose Miguel Acosta Cordova
Equity & Freight Electrification by Jose Miguel Acosta CordovaForth
 
What Causes The key not detected Message In Mercedes Cars
What Causes The key not detected Message In Mercedes CarsWhat Causes The key not detected Message In Mercedes Cars
What Causes The key not detected Message In Mercedes CarsGermany's Best Inc
 
办理阿德莱德大学毕业证Adelaide毕业证留信学历认证
办理阿德莱德大学毕业证Adelaide毕业证留信学历认证办理阿德莱德大学毕业证Adelaide毕业证留信学历认证
办理阿德莱德大学毕业证Adelaide毕业证留信学历认证jdkhjh
 

Recently uploaded (20)

907MTAMount Coventry University Bachelor's Diploma in Engineering
907MTAMount Coventry University Bachelor's Diploma in Engineering907MTAMount Coventry University Bachelor's Diploma in Engineering
907MTAMount Coventry University Bachelor's Diploma in Engineering
 
(办理学位证)(Rice毕业证)莱斯大学毕业证成绩单修改留信学历认证原版一模一样
(办理学位证)(Rice毕业证)莱斯大学毕业证成绩单修改留信学历认证原版一模一样(办理学位证)(Rice毕业证)莱斯大学毕业证成绩单修改留信学历认证原版一模一样
(办理学位证)(Rice毕业证)莱斯大学毕业证成绩单修改留信学历认证原版一模一样
 
原版1:1定制中央昆士兰大学毕业证(CQU毕业证)#文凭成绩单#真实留信学历认证永久存档
原版1:1定制中央昆士兰大学毕业证(CQU毕业证)#文凭成绩单#真实留信学历认证永久存档原版1:1定制中央昆士兰大学毕业证(CQU毕业证)#文凭成绩单#真实留信学历认证永久存档
原版1:1定制中央昆士兰大学毕业证(CQU毕业证)#文凭成绩单#真实留信学历认证永久存档
 
办理克莱姆森大学毕业证成绩单|购买美国文凭证书
办理克莱姆森大学毕业证成绩单|购买美国文凭证书办理克莱姆森大学毕业证成绩单|购买美国文凭证书
办理克莱姆森大学毕业证成绩单|购买美国文凭证书
 
Building a Future Where Everyone Can Ride and Drive Electric by Bridget Gilmore
Building a Future Where Everyone Can Ride and Drive Electric by Bridget GilmoreBuilding a Future Where Everyone Can Ride and Drive Electric by Bridget Gilmore
Building a Future Where Everyone Can Ride and Drive Electric by Bridget Gilmore
 
Pros and cons of buying used fleet vehicles.pptx
Pros and cons of buying used fleet vehicles.pptxPros and cons of buying used fleet vehicles.pptx
Pros and cons of buying used fleet vehicles.pptx
 
-The-Present-Simple-Tense.pdf english hh
-The-Present-Simple-Tense.pdf english hh-The-Present-Simple-Tense.pdf english hh
-The-Present-Simple-Tense.pdf english hh
 
Mastering Mercedes Engine Care Top Tips for Rowlett, TX Residents
Mastering Mercedes Engine Care Top Tips for Rowlett, TX ResidentsMastering Mercedes Engine Care Top Tips for Rowlett, TX Residents
Mastering Mercedes Engine Care Top Tips for Rowlett, TX Residents
 
Dubai Call Girls Services Call 09900000000
Dubai Call Girls Services Call 09900000000Dubai Call Girls Services Call 09900000000
Dubai Call Girls Services Call 09900000000
 
call girls in Jama Masjid (DELHI) 🔝 >༒9953330565🔝 genuine Escort Service 🔝✔️✔️
call girls in Jama Masjid (DELHI) 🔝 >༒9953330565🔝 genuine Escort Service 🔝✔️✔️call girls in Jama Masjid (DELHI) 🔝 >༒9953330565🔝 genuine Escort Service 🔝✔️✔️
call girls in Jama Masjid (DELHI) 🔝 >༒9953330565🔝 genuine Escort Service 🔝✔️✔️
 
办理科廷科技大学毕业证Curtin毕业证留信学历认证
办理科廷科技大学毕业证Curtin毕业证留信学历认证办理科廷科技大学毕业证Curtin毕业证留信学历认证
办理科廷科技大学毕业证Curtin毕业证留信学历认证
 
( Best ) Genuine Call Girls In Mandi House =DELHI-| 8377087607
( Best ) Genuine Call Girls In Mandi House =DELHI-| 8377087607( Best ) Genuine Call Girls In Mandi House =DELHI-| 8377087607
( Best ) Genuine Call Girls In Mandi House =DELHI-| 8377087607
 
办理(PITT毕业证书)美国匹兹堡大学毕业证成绩单原版一比一
办理(PITT毕业证书)美国匹兹堡大学毕业证成绩单原版一比一办理(PITT毕业证书)美国匹兹堡大学毕业证成绩单原版一比一
办理(PITT毕业证书)美国匹兹堡大学毕业证成绩单原版一比一
 
(办理学位证)(Toledo毕业证)托莱多大学毕业证成绩单修改留信学历认证原版一模一样
(办理学位证)(Toledo毕业证)托莱多大学毕业证成绩单修改留信学历认证原版一模一样(办理学位证)(Toledo毕业证)托莱多大学毕业证成绩单修改留信学历认证原版一模一样
(办理学位证)(Toledo毕业证)托莱多大学毕业证成绩单修改留信学历认证原版一模一样
 
(USQ毕业证)南昆士兰大学毕业证学位证成绩单修改留信学历认证原版一比一
(USQ毕业证)南昆士兰大学毕业证学位证成绩单修改留信学历认证原版一比一(USQ毕业证)南昆士兰大学毕业证学位证成绩单修改留信学历认证原版一比一
(USQ毕业证)南昆士兰大学毕业证学位证成绩单修改留信学历认证原版一比一
 
Call Girls Vastrapur 7397865700 Ridhima Hire Me Full Night
Call Girls Vastrapur 7397865700 Ridhima Hire Me Full NightCall Girls Vastrapur 7397865700 Ridhima Hire Me Full Night
Call Girls Vastrapur 7397865700 Ridhima Hire Me Full Night
 
办理昆士兰科技大学毕业证QUT毕业证留信学历认证
办理昆士兰科技大学毕业证QUT毕业证留信学历认证办理昆士兰科技大学毕业证QUT毕业证留信学历认证
办理昆士兰科技大学毕业证QUT毕业证留信学历认证
 
Equity & Freight Electrification by Jose Miguel Acosta Cordova
Equity & Freight Electrification by Jose Miguel Acosta CordovaEquity & Freight Electrification by Jose Miguel Acosta Cordova
Equity & Freight Electrification by Jose Miguel Acosta Cordova
 
What Causes The key not detected Message In Mercedes Cars
What Causes The key not detected Message In Mercedes CarsWhat Causes The key not detected Message In Mercedes Cars
What Causes The key not detected Message In Mercedes Cars
 
办理阿德莱德大学毕业证Adelaide毕业证留信学历认证
办理阿德莱德大学毕业证Adelaide毕业证留信学历认证办理阿德莱德大学毕业证Adelaide毕业证留信学历认证
办理阿德莱德大学毕业证Adelaide毕业证留信学历认证
 

Cafta china-asean free trade area, implications on trade and development

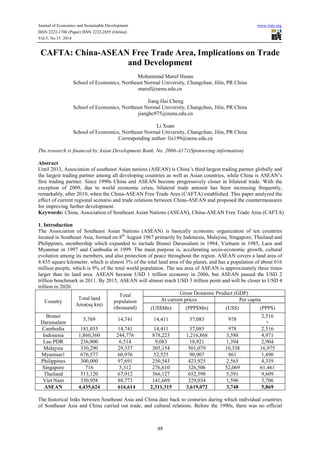
  • 1. Journal of Economics and Sustainable Development www.iiste.org ISSN 2222-1700 (Paper) ISSN 2222-2855 (Online) Vol.5, No.15 2014 CAFTA: China-ASEAN Free Trade Area, Implications on Trade and Development Mohammad Maruf Hasan School of Economics, Northeast Normal University, Changchun, Jilin, PR China maruf@nenu.edu.cn Jiang Hai Cheng School of Economics, Northeast Normal University, Changchun, Jilin, PR China jianghc975@nenu.edu.cn Li Xuan School of Economics, Northeast Normal University, Changchun, Jilin, PR China Corresponding author: lix199@nenu.edu.cn The research is financed by Asian Development Bank. No. 2006-A171(Sponsoring information) Abstract Until 2013, Association of southeast Asian nations (ASEAN) is China’s third largest trading partner globally and the largest trading partner among all developing countries as well as Asian countries, while China is ASEAN’s first trading partner. Since 1990s China and ASEAN become progressively closer in bilateral trade. With the exception of 2009, due to world economic crisis, bilateral trade amount has been increasing frequently, remarkably, after 2010, when the China-ASEAN Free Trade Area (CAFTA) established. This paper analyzed the effect of current regional scenario and trade relations between China-ASEAN and proposed the countermeasures for improving further development. Keywords: China, Association of Southeast Asian Nations (ASEAN), China-ASEAN Free Trade Area (CAFTA) 1. Introduction The Association of Southeast Asian Nations (ASEAN) is basically economic organization of ten countries located in Southeast Asia, formed on 8th August 1967 primarily by Indonesia, Malaysia, Singapore, Thailand and Philippines, membership which expanded to include Brunei Darussalam in 1984, Vietnam in 1985, Laos and Myanmar in 1997 and Cambodia in 1999. The main purpose is, accelerating socio-economic growth, cultural evolution among its members, and also protection of peace throughout the region. ASEAN covers a land area of 4.435 square kilometer, which is almost 3% of the total land area of the planet, and has a population of about 616 million people, which is 9% of the total world population. The sea area of ASEAN is approximately three times larger than its land area. ASEAN became USD 1 trillion economy in 2006, but ASEAN passed the USD 2 trillion benchmark in 2011. By 2015, ASEAN will almost reach USD 3 trillion point and will be closer to USD 4 trillion in 2020. 48 Country Total land Area(sq km) Total population (thousand) Gross Domestic Product (GDP) At current prices Per capita (US$Mn) (PPP$Mn) (US$) (PPP$) Brunei Darussalam 5,769 14,741 14,411 37,083 978 2,516 + Cambodia 181,035 14,741 14,411 37,083 978 2,516 Indonesia 1,860,360 244,776 878,223 1,216,868 3,588 4,971 Lao PDR 236,800 6,514 9,083 18,921 1,394 2,904 Malaysia 330,290 29,337 305,154 501,079 10,338 16,975 Myanmar1 676,577 60,976 52,525 90,907 861 1,490 Philippines 300,000 97,691 250,543 423,925 2,565 4,339 Singapore 716 5,312 276,610 326,506 52,069 61,461 Thailand 513,120 67,912 366,127 652,598 5,391 9,609 Viet Nam 330,958 88,773 141,669 329,034 1,596 3,706 ASEAN 4,435,624 616,614 2,311,315 3,619,072 3,748 5,869 The historical links between Southeast Asia and China date back to centuries during which individual countries of Southeast Asia and China carried out trade, and cultural relations. Before the 1990s, there was no official
  • 2. Journal of Economics and Sustainable Development www.iiste.org ISSN 2222-1700 (Paper) ISSN 2222-2855 (Online) Vol.5, No.15 2014 relationship between China and ASEAN, however China had official bilateral relations with individual ASEAN member states. Since 1980s, China strengthens its efforts to establish diplomatic relations with all the remaining ASEAN member states, which leads to official relationship with the ASEAN. During the past decades, the economic relationship between China and ASEAN becoming increasingly close and bilateral trade continues to boost up. In 2010, China-ASEAN Free Trade Area was established marking the development of China-ASEAN bilateral trade had seized a beneficial mark. Since January of 2010, China has reduced tariffs on more than 93 percent of the traded products to almost zero for ASEAN nations and promoted the China-ASEAN trade developed. At the tenth anniversary of the establishment of China-ASEAN strategic partnership in 2013, there still exist some barriers to overcome and deficiencies to point out in trade between China and ASEAN. Trade between China and ASEAN has proved resilient despite the ambivalent world economic recovery and growing protectionism. Trade rose 10.9 percent to 444 billion USD last year, exceeding the 7.6 percent increase in China's total foreign trade. 2. China-ASEAN trade statistics 2.1. Total Trade between China and major trade partners In 2013, total value of imports and exports between China and ASEAN closed at USD 4160.308 billion which ranked first of China’s value of imports and exports with major trade partners. In 2013, China’s total value of imports and exports to ASEAN was USD 443.611 billion, which results in close trade relationship between China and ASEAN. Until 2013, ASEAN is China’s third largest trading partner globally and the largest trading partner among all developing countries as well as Asian countries, while China is ASEAN’s first trading partner. However, in contrast with EU and United States, China’s trade relations with ASEAN are not as close as with EU and United Stated. Table 2. China’s Imports and Exports with Major Trade Partners, 2012-2013. (USD billion) 49 Country (Region) 2012 Country (Region) 2013 Total Value of Imports and Exports Growth Rate (%) Share (%) Total Value of Imports and Exports Growth Rate (%) Share (%) China 38,66.760 6.2 100.0 China 41,60.308 7.6 100 EU 5,46.043 -3.7 14.1 EU 5,59.040 2.1 13.4 United States 4,84.683 8.5 12.5 United States 5,21.020 7.4 12.5 ASEAN 4,00.093 10.3 10.3 ASEAN 4,43.611 10.9 10.7 Hong Kong, Japan 3,41.487 20.5 8.8 China 4,01.007 17.4 9.6 Hong Kong, China 3,29.451 -3.9 8.5 Japan 3,12.553 -5.1 7.5 Korea Rep. 2,56.329 4.4 6.7 Korea Rep. 2,74.248 7.0 6.6 Source: Department of Asian Affairs of Ministry of Commerce of the People’s Republic of China For import and export, from 2000 to 2008 China’s trade value to ASEAN increased year by year, upped from USD 22.181 to 116.974 for import and USD 17.341 billion to USD 114.142 billion for export. From 2002, the trade value increased rapidly, up 28.3% than the previous year. In 2009, global financial crisis reduce the total import and exports to -8.8% and -6.9% simultaneously. In 2010, by the establishment of ASEAN-China Free Trade Area (ACFTA) China’s trade volume to ASEAN boost to USD 154.569 and 138.207 billion for import and export with an increase of 44.8 and 30.1 percent. This trend increase sharply from 2010 to 2013, total trade increased to USD 199.541 for import and USD 204.272 billion for export, however, in 2013, the growth rate was crept down annually, especially in import it reduces a lot. It seems that ASEAN is increasingly becoming an important exporter of China. Especially in 2003, value of imports attained a record high with USD 47.327 billion. In 2004, the growth rate declined, however from 2005 to 2007, the growth rate accelerated annually. Since January 2010, zero tariffs applied on more than 93 percent of products traded between China and ASEAN. However starting from 2011, the import growth rate reduces gradually, remarkably in 2013, representing growth rate of only 1.9 %.
  • 3. Journal of Economics and Sustainable Development www.iiste.org ISSN 2222-1700 (Paper) ISSN 2222-2855 (Online) Vol.5, No.15 2014 Table 3. Commodities Trade between China and ASEAN, 2000-2013. (USD billion) 50 Country Exports value Share of China’s Exports value (%) Export growth Rate (%) Imports value Share of China’s Imports value (%) Import growth Rate (%) 2000 17.341 7.0 --- 22.181 9.9 --- 2001 18.385 6.9 6.0 23.229 10.3 4.7 2002 23.569 7.2 28.30 31.198 10.6 34.40 2003 30.925 7.1 31.2 47.327 11.5 51.7 2004 42.902 7.2 38.7 62.978 11.2 33.1 2005 55.371 7.3 29.1 74.999 11.4 19.1 2006 71.314 7.4 28.79 89.526 11.3 19.37 2007 94.139 7.7 32.0 108.369 11.3 21.0 2008 114.142 8.0 20.9 116.974 10.3 7.9 2009 106.297 8.8 -6.9 106.714 10.6 -8.8 2010 138.207 8.8 30.1 154.569 11.1 44.8 2011 170.083 9.0 23.1 192.771 11.1 24.7 2012 204.272 10.0 20.1 195.821 10.8 1.6 2013 244.070 11.0 19.48 199.541 10.2 1.9 Source: Department of Asian Affairs of Ministry of Commerce of the People’s Republic of China 2.2. Commodities Trade between China-ASEAN As the export volume for China-ASEAN, in 2013, China’s total exports to the six ASEAN members, Singapore, Malaysia, Indonesia, Vietnam, Thailand and Philippines amounted to USD 193.701 billion, accounting for 94.82 % of total export volume. There was a big increase compared with 2011, especially China’s exports to Malaysia, upped 31 % over the previous year. In contrast, China’s total exports to Myanmar, Cambodia, Brunei and Laos was less, therein China’s exports to Brunei and Laos, accounting respectively for less than 1 %. But compared with 2011, the exports to Brunei and Laos upped 68.2% and 96.8% over the previous year, showing significant growth. Although the volume of exports is low, the economic cooperation is becoming increasingly close between Brunei, Laos and other agriculture-based nations. China’s export trade to ASEAN is not only limited to old member states, Vietnam is the country joined ASEAN later, but in 2012, the total exports to Vietnam was USD 34.21 billion, upped 17.6% over the previous year, accounting for 16.75% of the total exports China to ASEAN, exceeding Thailand and Philippines ranked in fourth place. In 2012 the growth rate of China’s export to Laos ranked in first among the ten countries, due to Laos holding the ninth Asia Europe Meeting, China CAMC Engineering Corp., LTD., China State Construction Engineering Corp. LTD. and other Chinese companies specifically provided a lot of projects contracts to guarantee the smooth conduct of the summit, these were the main reason for the rapid growth of the trade between China and Laos. For the 2012 China’s imports from ASEAN was lower than exports. Import trade with Malaysia, Thailand, Myanmar, Laos and Brunei showed negative growth. Trade between China and Singapore, Malaysia, Indonesia, Vietnam, Thailand and Philippines accounted for 71.65% of China’s total imports from ASEAN. By contrast, imports from Myanmar, Laos, Brunei, Cambodia, and Shikoku were lower than other six countries, accounting for 1.35%. Table 4. Commodities Trade between China and ASEAN by Country, 2013. (USD billion) Export Ranking Country Exports value Share (%) Growth Rate (% Import Ranking Country Imports value Share (%) Growth Rate (%) 1 Singapore 40.752 19.94 14.6 1 Malaysia 58.295 29.77 -6.2 2 Malaysia 36.518 17.88 31.0 2 Thailand 38.545 19.68 -1.3 3 Indonesia 34.289 16.79 17.4 3 Indonesia 31.930 16.31 1.9 4 Vietnam 34.210 16.75 17.6 4 Singapore 28.524 14.57 1.4 5 Thailand 31.200 15.27 21.4 5 Philippines 19.638 10.03 9.2 6 Philippines 16.732 8.19 17.4 6 Vietnam 16.229 8.29 46.0 7 Myanmar 5.673 2.78 17.7 7 Myanmar 1.298 0.66 -22.7 8 Cambodia 2.708 1.33 17.0 8 Laos 0.791 0.40 -4.1 9 Brunei 1.252 0.61 68.2 9 Brunei 0.355 0.18 -37.3 10 Laos 0.937 0.46 96.8 10 Cambodia 0.215 0.11 16.8 Source: Department of Asian Affairs of Ministry of Commerce of the People’s Republic of China China’s imports and exports to ASEAN mainly concentrate on the six countries of Singapore, Malaysia,
  • 4. Journal of Economics and Sustainable Development www.iiste.org ISSN 2222-1700 (Paper) ISSN 2222-2855 (Online) Vol.5, No.15 2014 Indonesia, Thailand, Philippines and Vietnam, therefore China should strengthen the economic cooperation with the six countries to ensure the trade development between China and ASEAN. 2.3. Total Trade by Product In 2012, Malaysia, Thailand, Singapore and Indonesia are top four trading countries to China among ten ASEAN countries. From Table 5 to Table 8 show the composition of the top ten commodities that the four countries of Malaysia, Thailand, Singapore and Indonesia imported and exported to China in 2012. On the export side, among the commodities that the four countries exported to China, of which the similar are mechanical and electrical products, plastic and rubber, minerals, chemical products, base metals and products, and they were mainly agricultural products and materials products. Especially mechanical and electrical products, accounted for a large proportion of the commodities that four countries exported to China, ranked first among the commodities Malaysia and Singapore exported to China, and the second place of Thailand and the seventh place of Indonesia. China’s great demand for minerals indicated that with rapid economic development the demand for resource products is increasing. For import, the four countries have the very similar commodity structure of imports from China, the top ten commodities are mainly mechanical and electrical products, chemical products, transport equipment, plastic and rubber, textiles and raw materials, furniture, toys and miscellaneous manufactured articles. In addition, the mechanical and electrical products, plastic and rubber, chemical products also occupied a very important position. By mechanical and electrical products as representatives of high-tech products, high-tech products accounted for a large proportion of these commodities that the four countries exported to China. However the labor-intensive products also accounted for a certain proportion. Malaysia, Thailand, Singapore imported optical, watches and medical devices from China, indicating there is an increasing demand for these emerging trade products, and the emerging trade products have very potential market prospects. Although Singapore is a developed country, still has the similar import and export commodity structure with other three countries. China and ASEAN should continue to strengthen the development of hi-tech products and constantly improve the export structure to get mutual benefits. Manufactured products trade accounted for a larger share of trade between China and ASEAN countries, mainly in the food and beverages and tobacco industry, textile industry, machinery and transport equipment and chemical industry. Due to the lower level of economy development of the six countries, their imports and exports to China mainly focus on agricultural products. Agricultural products trade between ASEAN and China has developed rapidly. These countries are in great demand for industrial products. Their import products from China are mainly electronics, refined oil, steel, textiles, etc. Table 5. Merchandise Trade between China and Malaysia by Product, 2013. (USD million) 51 Rank Items Exports Value (2012) Exports Value (2013) Growth rate Share (%) Items Imports Value (2012) Imports Value (2013) Growth rate Share (%) Total Value 30,711 32,840 100.0 Total Value 29,762 33,740 13.4 100.0 1 Mechanical and Electrical Products 13,744 16,713 -19.8 43.6 Mechanical and Electrical Products 16,994 18,846 10.9 55.9 2 Minerals 3,121 3,853 23.5 12.6 Base Metals and Product 3,134 4,543 45.0 13.5 3 Plastics, Rubber 4,324 3,737 -13.6 12.2 Chemical Products 2,142 2,224 3.8 6.6 4 Animal and vegetable fats 3,561 3,021 -15.2 9.8 Plastics, Rubber 1,016 1,117 9.9 3.3 5 Base metals and products 1,023 2,339 128.6 7.6 Optical, watches, medical equipment 906 1,094 20.8 3.2 6 Chemical Products 2,393 2,056 16.4 7.8 Transportation Equipment 1,314 897 -31.8 2.7 7 Optical, watches, medical equipment 686 498 -27.4 1.6 Textiles and raw materials 821 887 8.0 2.6 8 Food and Beverages and Tobacco 329 414 25.8 1.4 Minerals 294 766 160.6 2.3 9 Wood and products 214 250 17.2 0.8 Plant products 642 733 14.3 2.2 10 Textiles and raw materials 276 224 -18.8 0.7 Furniture, toys, miscellaneous manufactured articles 539 601 11.6 1.8 11 Transportation Equipment 140 137 -2.2 0.5 Food, beverages, tobacco 423 424 0.2 1.3 12 Furniture, toys, miscellaneous manufactured articles 72 105 47.1 0.3 Ceramics; glass 371 407 9.8 1.2 13 Ceramics; glass 86 101 17.6 0.3 Cellulose pulp; paper 317 346 8.9 1.0 14 Cultural products 76 74 -3.1 0.2 Live animals; animal products 343 306 -10.8 0.9 15 Plant products 49 61 23.4 0.2 Cultural products 171 171 0.4 0.5 114 12.5 16 Other 106 -7.0 0.3 Other 335 377 1.1
  • 5. Journal of Economics and Sustainable Development www.iiste.org ISSN 2222-1700 (Paper) ISSN 2222-2855 (Online) Vol.5, No.15 2014 Table 6. Merchandise Trade between China and Thailand by Product, 2013. (USD million) 52 Rank Items Exports Value (2012) Exports Value (2013) Growth rate Share (%) Items Imports Value (2012) Imports Value (2013) Growth rate Share (%) Total Value 26,730 26,826 100.0 Total Value 37,366 37,613 100.0 1 Plastics, Rubber 8,552 9,073 6.1 33.8 Mechanical and Electrical Products 19,620 18,956 -3.4 50.4 2 Mechanical and Electrical Products 7,468 5,717 -23.5 21.3 Base Metals and Products 5,048 4,921 -2.5 13.1 3 Chemical Products 3,142 3,413 8.6 12.7 Chemical Products 2,979 2,932 1.6 7.9 4 Plant Products 1,895 2,559 35.0 9.5 Plant Products 1,259 2,026 60.9 5.4 5 Minerals 1,846 2,380 28.9 8.9 Plastics, Rubber 1,648 1,692 2.7 4.5 Wood and Wood 6 Products 948 1,087 14.7 4.1 Textiles and raw materials 1,683 1,657 -1.5 4.4 7 Textiles and raw materials 388 500 29.0 1.9 Optical, Watches and Medical Devices 983 954 -3.0 2.5 8 Optical, watches, medical equipment 414 431 4.3 1.6 Plant Products 711 757 6.5 2.0 9 Base metals and products 493 401 -18.6 1.5 Furniture and Toys and Miscellaneous Products 668 757 13.4 2.0 10 Food, beverages, tobacco 688 390 -43.4 1.5 Ceramics and Glass 596 685 15.0 1.8 11 Transportation Equipment 287 207 -28.0 0.8 Food, beverages, tobacco 410 387 -5.5 1.0 12 Live animals; animal products 135 152 12.3 0.6 Precious metals and products 450 365 -18.8 1.0 13 Cellulose pulp; paper 100 127 27.0 0.5 Cellulose pulp; paper 322 346 7.5 0.9 14 Leather products; bags 111 118 6.1 0.4 Leather products; bags 256 256 0.1 0.7 15 Furniture and Toys and Miscellaneous Products 66 74 12.5 0.3 animals; animal products 206 247 19.6 0.7 16 Other 197 197 -0.1 0.7 Other 575 628 9.1 1.7 Table 7. Commodities Trade between China and Singapore by Product, 2013. (USD million) R an k Items Exports Value (2012) Exports Value (2013) Growth rate Share (% ) Items Impor ts Value (2012) Imports Value (2013) Gr owt h rat e Sh are ( % ) Total Value 43,974 48,365 10.0 100.0 Total Value 39,211 43,692 11. 4 10 0.0 1 Mechanical and Electrical Products 23,502 26,682 13.5 55.2 Mechanical and Electrical Products 24,160 26,725 10. 6 61. 2 2 Minerals 6,754 5,605 -17.0 11.6 Minerals 2,607 4,229 62. 2 9.7 3 Plastics, Rubber 4,150 4,732 14.0 9.8 Base metals and products 3,280 3,689 12. 5 8.4 4 Chemical Products 4,214 4,674 10.9 9.7 Chemical Products 1,471 1,552 5.4 3.6 Optical, watches, medical 5 equipment 1,518 2,190 44.3 4.5 Optical, watches, medical equipment 1,012 1,067 5.4 2.4 6 Base metals and products 1,085 1,019 -6.1 2.1 Textiles and Raw Materials 1,062 1,057 -0.5 2.4 7 Transportation Equipment 810 894 10.3 1.9 Furniture, toys, miscellaneous manufactured articles 921 904 -1.9 2.1 8 Food and Beverages and Tobacco 796 793 -0.3 1.6 Transportation Equipment Products 1,178 763 - 352 1.8 9 Precious metals and products 68 186 173.7 0.4 Plastics, Rubber 749 748 -0.2 1.7 Food, beverages, 10 Cellulose pulp; paper 156 132 -15.0 0.3 tobacco 484 517 6.7 1.2 11 Textiles and raw materials 62 79 28.8 0.2 Ceramics; glass 368 385 4.5 0.9 12 animals; animal products 22 57 164.2 0.1 Precious metals and products 260 371 42. 4 0.9 13 Ceramics; glass 19 46 137.7 0.1 Plant products 323 355 9.7 0.8 14 Furniture, toys, miscellaneous manufactured articles 36 43 19.7 0.1 Leather products; bags 302 301 -0.2 0.7 15 Leather products; bags 6 18 181.5 0.0 Footwear, umbrellas and other light industrial products 264 280 6.0 0.6 16 Other 777 1212 56.0 2.5 Other 768 752 -2.1 1.7
  • 6. Journal of Economics and Sustainable Development www.iiste.org ISSN 2222-1700 (Paper) ISSN 2222-2855 (Online) Vol.5, No.15 2014 Table 7. Merchandise Trade between China and Indonesia by Product, 2013. (USD million) 53 Rank Items Exports Value (2012) Exports Value (2013) Growth rate Share (%) Items Imports Value (2012) Imports Value (2013) Growth rate Share (%) Total Value 21,660 22,601 4.4 100.0 Total Value 29,387 29,849 1.6 100.0 1 Minerals 10,562 11,930 13.0 48.8 Mechanical and Electrical Products 13,647 13,966 2.3 46.4 2 Animals and Vegetable Oils and Fats and Waxes- 3,602 2,483 -31.1 16.6 Base metals and products 3,451 3,496 1.3 11.7 3 Plastics, Rubber 2,048 1,915 -6.5 9.5 Chemical Products 3,159 3,136 -0.7 10.5 4 Chemical Products 1,521 1,681 10.5 7.1 Textiles and raw materials 2,398 2,541 6.0 8.5 5 Cellulose pulp; paper 993 1,201 21.0 4.6 Plastics, Rubber 1,072 1,242 15.8 4.2 Wood and Wood 6 Products 554 711 28.5 2.6 Transportation Equipment 1,104 1,063 -3.7 3.6 7 Textiles and raw materials 448 573 27.9 2.5 Plant products 833 858 3.0 2.9 8 Mechanical and Electrical Products 539 519 -3.7 2.1 Furniture, toys, miscellaneous manufactured articles 650 692 6.5 2.3 9 Base metals and products 442 463 4.8 2.0 Food, beverages, tobacco 612 609 -0.6 2.0 10 Live Animals and Animal Products 196 283 44.5 0.9 Ceramics; glass 572 463 -19.1 1.6 11 Plant products 183 228 24.5 0.9 Minerals 601 438 -27.2 1.5 Food, beverages, 12 tobacco 193 222 15.4 0.9 Optical, watches, medical equipment 432 428 -0.9 1.4 13 Footwear, umbrellas and other light industrial products 128 146 14.7 0.6 Footwear, umbrellas and other light industrial products 236 258 9.7 0.9 14 Optical, watches, medical equipment 60 78 29.7 0.4 Cellulose pulp; paper 213 245 14.9 0.8 15 Transportation Equipment 82 53 -35.7 0.2 Leather products; bags 172 176 2.1 0.6 16 Other 111 116 4.5 0.5 Other 233 237 1.7 0.8 2.4. Foreign Direct Investment China and ASEAN In 2010 China's utilization of FDI amounted to USD 105.73235 billion of which foreign direct investment from ASEAN countries amounted to USD 6.32368 billion, accounting for about 6.0%. For the total direct investment from ASEAN into China of which Singapore ranked in first with USD 5.4282 billion, accounting for 86%, and Brunei came in second place. In 2011 China's utilization of FDI amounted to USD 116.00985 billion of which FDI from ASEAN amounted to USD 6.64650 billion, accounting for about 5.7%, decreased compared with 2010. Singapore still ranked first with amount of USD 6.09681 billion, FDI from Brunei into China declined and ranked in third place. However, Malaysian’s FDI increased. Except for Brunei, FDI of Philippines, Indonesia, Laos and Vietnam’s to China all had the decline trend. In contrast, both of FDI from Thailand and Myanmar into China increased. In 2010, China's outward FDI flows into ASEAN countries was USD 4.405 billion, accounting for 9.8% of outward FDI flows into Asia, and outward FDI stock was USD 14.35 billion, accounting for 6.3% of outward FDI stock into Asian region. In 2011, China's investment flows into ASEAN countries amounted to USD 5.905 billion with an increase of 34.1%, accounting for 13% of investment flows in Asia, and outward FDI stock was USD 21.462 billion, accounting for 7.1% of total outward FDI stock in Asia, Until the end of 2011, China has established more than 2,400 FDI enterprises in ASEAN, hired 117500 local employees. Compared with 2010, China's FDI into ASEAN had an upward trend in 2011. Table 8. ASEAN’ FDI in China, 2010-2012. (USD 10,000) Country (Region) 2010 2011 2012 Actually used FDI Share (%) Actually used FDI Share (%) Actually used FDI Share (%) Singapore 542,820 85.84 609,681 91.73 630,508 89.14 Brunei 30,956 4.90 25,582 3.85 15,109 2.14 Malaysia 29,433 4.65 35,828 5.39 31,751 4.49 Philippines 13,806 2.18 11,185 1.68 13,221 1.87 Indonesia 7,684 1.22 4,607 0.69 6,378 0.90 Thailand 5,134 0.81 10,120 1.52 7,772 1.10 Cambodia 1,035 0.16 1,737 0.26 1,660 0.23 Laos 945 0.15 588 0.09 200 0.03 Myanmar 352 0.06 1,021 0.15 384 0.05 Vietnam 203 0.03 129 0.02 316 0.04 Total 632,368 100.00 664,650 100.00 707299 100.00
  • 7. Journal of Economics and Sustainable Development www.iiste.org ISSN 2222-1700 (Paper) ISSN 2222-2855 (Online) Vol.5, No.15 2014 From the perspective of direct investment flows, China's direct investment into Singapore ranked first among other ASEAN countries, and Brunei came in last place. Compared with 2010, China’s outward foreign direct investment flows into Myanmar, Thailand, Vietnam and Malaysia declined in 2011. As for FDI stock, at the end of 2011, Singapore was in first place ASEAN countries, followed by Myanmar and Cambodia, and Brunei was at the bottom in the list. It can be seen the bilateral foreign direct investment was evolving constantly; Chinese enterprises invested in these countries mainly concentrate in manufacturing, power development, wholesale and retail trade, mining, construction industry and other industries. China should strengthen investment in high-tech industries, while China also needs to maintain development of investing to developing countries, so that to get complementary advantages, optimize their domestic industrial structure and improve the industrial technology and also promote the progress of the host country. 3. Proposition for Development and Escalating Trade 3.1. Development of Zero Tariff Policy It is obvious that with the cooperation of China, ASEAN economy can be stabilized. By the establishment of CAFTA, in 2010, China-ASEAN trade increase extensively. Recently China’s economy external dependence is growing, strengthening trade with ASEAN and escalating development of China-ASEAN Free Trade Area can help China become accustomed to economic globalization, enhancing the ability to endure economic risks and expand China’s economic cooperation with Southeast Asian Nations. Since 2005, China-ASEAN implementing tariff reduction policy for almost 7000 commodities. From January 1st, 2010, more than 93 percent of products that China traded with ASEAN enjoy zero tariffs. These policies has lead to a lot of positive effects in China- ASEAN trade area, eventually, it makes the strengthening of bilateral trade between China and ASEAN. Furthermore, China and ASEAN should reinforce the implementation of zero tariff policy to all countries of ASEAN. 3.2. International Trade of China and Implications China should adopt a new trade strategy of "winning by quality" by raising the export competitiveness of its products and improving the quality and efficiency of its trade. China should be put special focus on optimizing China's foreign trade structure, to have more high-quality, hi-tech products, high value-added products and home-developed products manufactured and exported to ASEAN. Optimizing the industrial structure will be helpful to China-ASEAN trade. China should develop technology-intensive and capital-intensive industries rather than labor-intensive industries. China should steadily phase out backward industries that compete with ASEAN and should enhance the cooperation with the different countries and regions with consensus to their economic and development structure and manufacturing level. China can make full use of technological expertise in intensifying cooperation of the expansion of the exploration mineral and biological resources, and other major areas to upgrade China's industrial structure. Mechanical and electrical products are the major commodities traded between China and ASEAN, which specify high-tech products account for a large fraction of China-ASEAN trade. Furthermore, both sides should continue to enhance the proportion of high value-added and hi-tech products in trade, it improve the technological content of exporting more high-quality, hi-tech products, high value-added products and home-developed products. 3.3. Improving the Investment Environment With the recent developments in the Southeast Asian region, there is no doubt that Asia has already started to dominate in this century and China has been the catalyst for progress and prosperity in the region. In order to continue the region's growth momentum, China’s focus is now on improving connectivity, a measure of strategic importance that will promote intra-regional economic integration and competitiveness. This will be a key factor determining the expansion of bilateral trade volumes for the coming years. Recently, China had enhanced its investment environment to attract foreign investors. Improving investment environment comprises the setup of efficient and transparent administrative system, the improvement of legal system to develop the foreign companies. At the same time, China and ASEAN countries should enhance infrastructure to endow with favorable conditions for foreign investment. Cultural exchanges are beneficial to attractive friendship and mutual understanding between the people of both sides and establishing harmony among relations. Therefore China and ASEAN countries should promote the friendly exchanges majorly in the fields of culture and education. Particularly in education and technology, the cultural exchange programmes between china and ASEAN could facilitate young people to contribute their part in the regional collaboration. 4. Conclusion This paper analyses the development of trade between ASEAN and China on import and export flows focusing on the trade of major products. We used data for sixteen categories of goods including manufactured products, agricultural products, chemical products, machinery and transport equipment traded between China-ASEAN in 2013 with comparison to past years. China is the largest trading partner of ASEAN and ASEAN has emerged as China's third largest partner, a major 54
  • 8. Journal of Economics and Sustainable Development www.iiste.org ISSN 2222-1700 (Paper) ISSN 2222-2855 (Online) Vol.5, No.15 2014 investment destination and an important tourist destination. China and ASEAN are working on a free trade area, the biggest among developing countries, and plan raise trade volume to one trillion USD by 2020. Previous trade statistics shows that the most important factor in China-ASEAN relations is the peace and stability and the most important experience is to resolving differences through dialogue. The chaos in Vietnam has cost the country a lot, shattering investor confidence and causing unemployment. From 2000 to 2013, China's trade with ASEAN had sustained gradual increase except in 2009 due to the impact of financial crisis. The total volume of trade amounted to USD 443.611 billion in 2013, of which exports reached to USD 244.070 billion, imports amounted to USD 199.541 billion. There are economic discrepancies within ASEAN, China-ASEAN trade is mainly concentrated in the five old ASEAN member countries and Vietnam. To China the old ASEAN member countries have the similar imports and exports commodity structure, for import, mechanical and electrical products and other hi-tech products occupy the main part. The new four ASEAN countries relatively are economically backward, exports to China are mainly agricultural and animal products, imports are mainly mechanical and electronic products. Recently, chaos in Vietnam has cost the country a lot, shattering investor confidence and causing unemployment with the expected reduction of trade values. In 2012 ASEAN foreign direct investment into China amounted to USD 630.508 billion. In 2012, China's outward FDI flows into ASEAN countries were 6.211 billion USD, and Singapore stands in first place. In 2013, for the tenth anniversary of China-ASEAN develop strategic partnership, China should take full advantage of this opportunity to further comprehensively strengthen mutually beneficial cooperation with ASEAN, besides China needs to deepen and expand cooperation with neighboring countries. Practice will continue to prove that China's sustainable development and prosperity will bring the important opportunities to the neighboring countries including the ASEAN and even to the courtiers all over the world. Acknowledgments This paper is supported by the Humanities and Social Science Youth Fund Project of the Ministry of education of china. (中国教育部人文社会科学青年基金项目 )“The Quality Assessment of Chinese OFDI to ASEAN" (《中国对东盟直接投资的质量评价及优化对策研究》)Project Number: 13YJC 790083. References Qiu H., Yang J., Huang J., & Chen R. (2007). Impact of China–ASEAN Free Trade Area on China’s Inter national Agricultural Trade and Its Regional Development. China & World Economy, 15, 77-90 Park D., Innwon P., Esther B. G., & Estrada (2009). Prospects for ASEAN-China Free Trade Area: A Qualitative and Quantitative Analysis. China & World Economy, 17, 104-120 Wong J, & Chan S., (2003). CHINA-ASEAN FREE TRADE AGEREEMENTChina-Asean Free Trade Agreement: Shaping Future Economic Relations.University of California Press.Asian Survey, 43, 507-526 Tongzon J. L. (2005). ASEAN-China Free Trade Area: A Bane or Boon for ASEAN Countries?.Biackwell Publishing Ltd 55
  • 9. The IISTE is a pioneer in the Open-Access hosting service and academic event management. The aim of the firm is Accelerating Global Knowledge Sharing. More information about the firm can be found on the homepage: http://www.iiste.org CALL FOR JOURNAL PAPERS There are more than 30 peer-reviewed academic journals hosted under the hosting platform. Prospective authors of journals can find the submission instruction on the following page: http://www.iiste.org/journals/ All the journals articles are available online to the readers all over the world without financial, legal, or technical barriers other than those inseparable from gaining access to the internet itself. Paper version of the journals is also available upon request of readers and authors. MORE RESOURCES Book publication information: http://www.iiste.org/book/ IISTE Knowledge Sharing Partners EBSCO, Index Copernicus, Ulrich's Periodicals Directory, JournalTOCS, PKP Open Archives Harvester, Bielefeld Academic Search Engine, Elektronische Zeitschriftenbibliothek EZB, Open J-Gate, OCLC WorldCat, Universe Digtial Library , NewJour, Google Scholar