Weekly Projects Update - w/e 9th September
•
1 like•465 views

AcuComm's weekly projects update - w/e 9th September. For more information on our latest projects, visit our website: acucomm.net

Recommended
Recommended
More Related Content
More from AcuComm
More from AcuComm (20)
Recently uploaded
Recently uploaded (20)
Weekly Projects Update - w/e 9th September
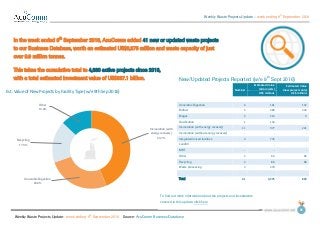
- 1. Weekly Waste Projects Update – week ending 9 th September 2016 Weekly Waste Projects Update: week ending 9 th September 2016 Source: AcuComm Business Database 01 2nd September 2016 New/Updated Projects Reported (w/e 9th Sept 2016) Number Estimated Value (all projects) Estimated Value (new projects only) US$ millionsUS$ millions Anaerobic Digestion 6 161 132 Biofuel 5 489 322 Biogas 5 214 0 Gasification 1 134 - Incineration (with energy recovery) 11 977 221 Incineration (without energy recovery) - - - Integrated/mixed facilities 4 776 - Landfill - - - MBT - - - Other 2 66 66 Recycling 4 88 88 Waste processing 3 470 - Total 41 3,375 829 In the week ended 9th September 2016, AcuComm added 41 new or updated waste projects to our Business Database, worth an estimated US$3,375 million and waste capacity of just over 9.9 million tonnes. This takes the cumulative total to 4,380 active projects since 2013, with a total estimated investment value of US$337.1 billion. To find out more information about the projects and investments covered in this update, click here Incineration (with energy recovery) 43.7% Anaerobic Digestion 26.0% Recycling 17.3% Other 13.0% Est. Value of New Projects by Facility Type (w/e 9th Sep 2016)
- 2. Weekly Waste Projects Update – week ending 9 th September 2016 Weekly Waste Projects Update: week ending 9 th September 2016 Source: AcuComm Business Database 02 New/Updated Projects Reported (w/e 9th Sept 2016) Number Capacity (tonnes) MW Anaerobic Digestion 6 963,341 9 Biofuel 5 825,839 24 Biogas 5 306,843 11 Gasification 1 1,095 29 Incineration (with energy recovery) 11 5,146,462 712 Incineration (without energy recovery) - - - Integrated/mixed facilities 4 752,613 199 Landfill - - - MBT - - - Other 2 923,133 0 Recycling 4 401,507 - Waste processing 3 621,373 - Total 41 9,942,206 984 The total estimated waste capacity of projects reported on in the past week is just over 9.9 million tonnes. WtE incineration was the largest category, accounting for just over 5.1 million tonnes. The total estimated power generation from these projects was 984 MW. WtE incineration was the largest category, accounting for 712 MW. Incineration (with energy recovery) 51.8% Anaerobic Digestion 9.7% Other 9.3% Others 29.3% Reported Capacity of Projects by Facility Type (w/e 9th Sep 2016) To find out more information about the projects and investments covered in this update, click here
- 3. Weekly Waste Projects Update – week ending 9 th September 2016 Weekly Waste Projects Update: week ending 9 th September 2016 Source: AcuComm Business Database 03 New Projects Reported by Waste Types (w/e 9th Sept 2016) Number Capacity (tonnes) MW Animal 6 1,197,284 6 Clinical - - - Construction/Demolition - - - e-Waste - - - Food 1 53,890 3 Gas 1 - 0 Glass - - - Hazardous - - - Heat 1 134,517 - Industrial - - - Metals - - - MSW 9 2,336,615 101 Oil - - - Organic (general/unspecified) 6 1,847,265 422 Other - - - Paper 1 49,202 - Plant biomass (non-waste) - - - Plant biomass (waste) 3 598,293 62 Plastics 1 65,000 - Radioactive 1 267 - Rubber - - - Sewage/wastewater 1 117,239 3 Wood 10 3,542,635 387 Total 41 9,942,206 984 Wood was the leading feedstock type reported on in the past week, accounting for an estimated 3.5 million tonnes, or 35.6% of the total. This was followed by MSW with 2.3 million tonnes or 23.5%. Wood 35.6% MSW 23.5% Organic (general/unspecified) 18.6% Others 22.3% Reported Capacity of Projects by Waste Type (w/e 9th Sep 2016) To find out more information about the projects and investments covered in this update, click here
- 4. Weekly Waste Projects Update – week ending 9 th September 2016 Weekly Waste Projects Update: week ending 9 th September 2016 Source: AcuComm Business Database 04 New/Updated Projects, Country Coverage, (w/e 9th Sept 2016) Projects USA 11 UK 9 Canada 3 China 3 Australia 3 Others 12 Total 41 The leading country in the past week was the USA with 11 projects, followed by the UK with nine. 11 9 3 3 3 0 0 0 0 0 0 12 0 2 4 6 8 10 12 14 USA UK Canada China Australia Others Reported Projects by Country (w/e 9th Sep 2016) To find out more information about the projects and investments covered in this update, click here
- 5. Weekly Waste Projects Update – week ending 9 th September 2016 Weekly Waste Projects Update: week ending 9 th September 2016 Source: AcuComm Business Database 05 Average Project Values by Facility Type US$ millions Anaerobic Digestion 24 Biofuel 122 Biogas 27 Gasification 140 Incineration (with energy recovery) 110 Incineration (without energy recovery) 58 Integrated/mixed facilities 211 Landfill 21 MBT 74 Other 122 Recycling 30 Waste processing 64 All Projects 77 Average Project Values by Feedstock Type US$ millions Animal 17 Clinical 30 Construction/Demolition 7 e-Waste 24 Food 19 Gas 59 Glass 13 Hazardous 71 Heat 42 Industrial 121 Metals 49 MSW 91 Oil 42 Organic (general/unspecified) 88 Other 61 Paper 70 Plant biomass (non-waste) 113 Plant biomass (waste) 83 Plastics 21 Radioactive 564 Rubber 33 Sewage/wastewater 48 Wood 86 All Projects 77 The average active waste project is worth US$77 million. There are naturally wide variations in average project value, due to the size, duration and complexity of different types of project. The figures on this page represent our latest estimates, based on data from 2013 to the current week. To find out more information about the projects and investments covered in this update, click here
- 6. Weekly Waste Projects Update – week ending 9 th September 2016 Weekly Waste Projects Update: week ending 9 th September 2016 Source: AcuComm Business Database 06 Top Five Projects, week ending 9th September 2016, by Estimated Value (US$ millions) Click the flag for more information on each project 1 Bulgaria 444 Construction of a national nuclear waste repository. 2 Sweden 433 Development of a biomass, anaerobic digestion and WWTP complex. 3 China 226 Construction of the world's largest bioethanol plant. 4 UK 222 Development of 95,000 tpa waste treatment facility. 5 UK 160 Conversion of power station to biomass. Top Five Projects, week ending 9th September 2016, by Reported Waste Capacity (tonnes) 1 UK 1,400,000 Conversion of power station to biomass. 2 Denmark 1,200,000 Conversion of CHP plant to biomass feedstock. 3 Kuwait 1,095,000 Construction of a >3,000 tpd MSW treatment complex. 4 Australia 400,000 Construction of a 400,000 tpa waste transfer facility. 5 USA 392,049 Proposed construction of a 35 MW biomass facility. Top Five Projects, week ending 9th September 2016, by Reported Power Generation (MW) 1 UK 390 Conversion of power station to biomass. 2 Sweden 160 Development of a biomass, anaerobic digestion and WWTP complex. 3 Denmark 150 Conversion of CHP plant to biomass feedstock. 4 USA 35 Proposed construction of a 35 MW biomass facility. 5 China 30 Construction of a 30 MW biomass plant.
- 7. Weekly Waste Projects Update – week ending 9 th September 2016 Weekly Waste Projects Update: week ending 9 th September 2016 Source: AcuComm Business Database 07