Integrated hydro-geological risk for Mallero basin (Alpine Italy) – part 1: g...
Fluvial response to climate change
1. Faculteit Geowetenschappen
Aardwetenschappen
Time
Yield(%ofinput)
100 %
0 %
instantaneous base-level drop
Quantification
Results
Elevation
Distance
Elevation
Distance
T 1
T 6
T 5
T 4
T 3
T 2
Begin et al. (1981)
Our flume
Modeling flux
Qw / Qs
Yield at the delta apex
125 %
100 %
0 5 10 15 20 25 30
Discharge/sealevel
sea level
scenario 1
scenario 2
Time (h)
scenario 1 scenario 2constant supply
0%
50%
100%
150%
200%
0 5 10 15 20 25 30
Yield(%ofinput)
Time (h)
Time
discharge
yield at fluvial valley outlet
Yield(%ofinput)
100 %
0 %
Flume
horizontal position
elevation
Numerical model
∙=
x
h
k
xt
h
∂
∂
∂
∂
∂
∂
∙
( )
horizontal position
elevation
T 1
T 4
T 3
T 2
river shelf
No discharge pulse
5 h
10 h
15 h
30 h
25 h
20 h
erosion surface
Discharge pulse (scenario 1)
river shelf
additional deposition
additional erosion
additional erosion
additional deposition
additional erosion
river
shelf
basin
river shelf
Discharge pulse (scenario 2)
highstand
early regression
late regression
early lowstand
late lowstand
early transgression
late transgression
Fluvial response to climate change
Aart-Peter van den Berg van Saparoea, George Postma, Paul Meijer & Joris Eggenhuisen
Utrecht University, Department of Earth Sciences, Budapestlaan 4, 3584 CD Utrecht, The Netherlands
phone: +31 (0)30 253 5119, fax: +31 (0)30 253 5030, e-mail: apvdbvs@geo.uu.nl
Base-level drop
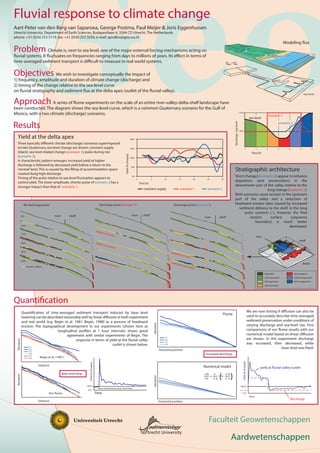
Objectives We wish to investigate conceptually the impact of
1) frequency, amplitude and duration of climate change (discharge) and
2) timing of the change relative to the sea-level curve
on fluvial stratigraphy and sediment flux at the delta apex (outlet of the fluvial valley).
Stratigraphic architecture
Short changes (scenario 2) appear to enhance
deposition (and preservation) in the
downstream part of the valley relative to the
long change (scenario 1).
Both scenarios cause erosion in the upstream
part of the valley and a reduction of
headward erosion rates caused by increased
sediment delivery to the shelf. In the long
pulse scenerio (2), however, the final
erosion surface (sequence
boundary) is much better
developed.
Three basically different climate (discharge) scenarios superimposed
on late Quaternary sea-level change are shown: constant supply
(black); sea level related change (scenario 1); pulse during rise
(scenario 2).
A characteristic pattern emerges: increased yield at higher
discharge is followed by decreased yield before a return to the
‘normal’level. This is caused by the filling of accommodation space
created durig high discharge.
Timing of the pulse relative to sea-level fluctuation appears to
control yield. The lower amplitude, shorter pulse of scenario 2 has a
stronger impact than that of scenario 1.
We are now testing if diffusion can also be
used to accurately describe time-averaged
sediment preservation under conditions of
varying discharge and sea-level rise. First
comparisons of our flume results with our
numerical model based on linear diffusion
are shown. In this experiment discharge
was increased, then decreased, while
base-level was fixed.
Quantification of time-averaged sediment transport induced by base level
lowering can be described reasonably well by linear diffusion in both experiment
and real world (e.g. Begin et al. 1981; Begin, 1988) as a process of headward
erosion. The topographical development in our experiments (shown here as
longitudinal profiles at 1 hour intervals) shows good
agreement with similar experiments of Begin. The
response in terms of yield at the fluvial valley
outlet is shown below.
Problem Climate is, next to sea level, one of the major external forcing mechanisms acting on
fluvial systems. It fluctuates on frequencies ranging from days to millions of years. Its effect in terms of
time-averaged sediment transport is difficult to measure in real world systems.
Approach A series of flume experiments on the scale of an entire river-valley-delta-shelf landscape have
been conducted. The diagram shows the sea-level curve, which is a common Quaternary scenario for the Gulf of
Mexico, with a two climate (discharge) scenarios.
Increased discharge