Comparing social tagsto microblogs
Victoria Lai, Christopher Rajashekar, William Rand
Modeling Social Media 2011
October 9, 2011
2.
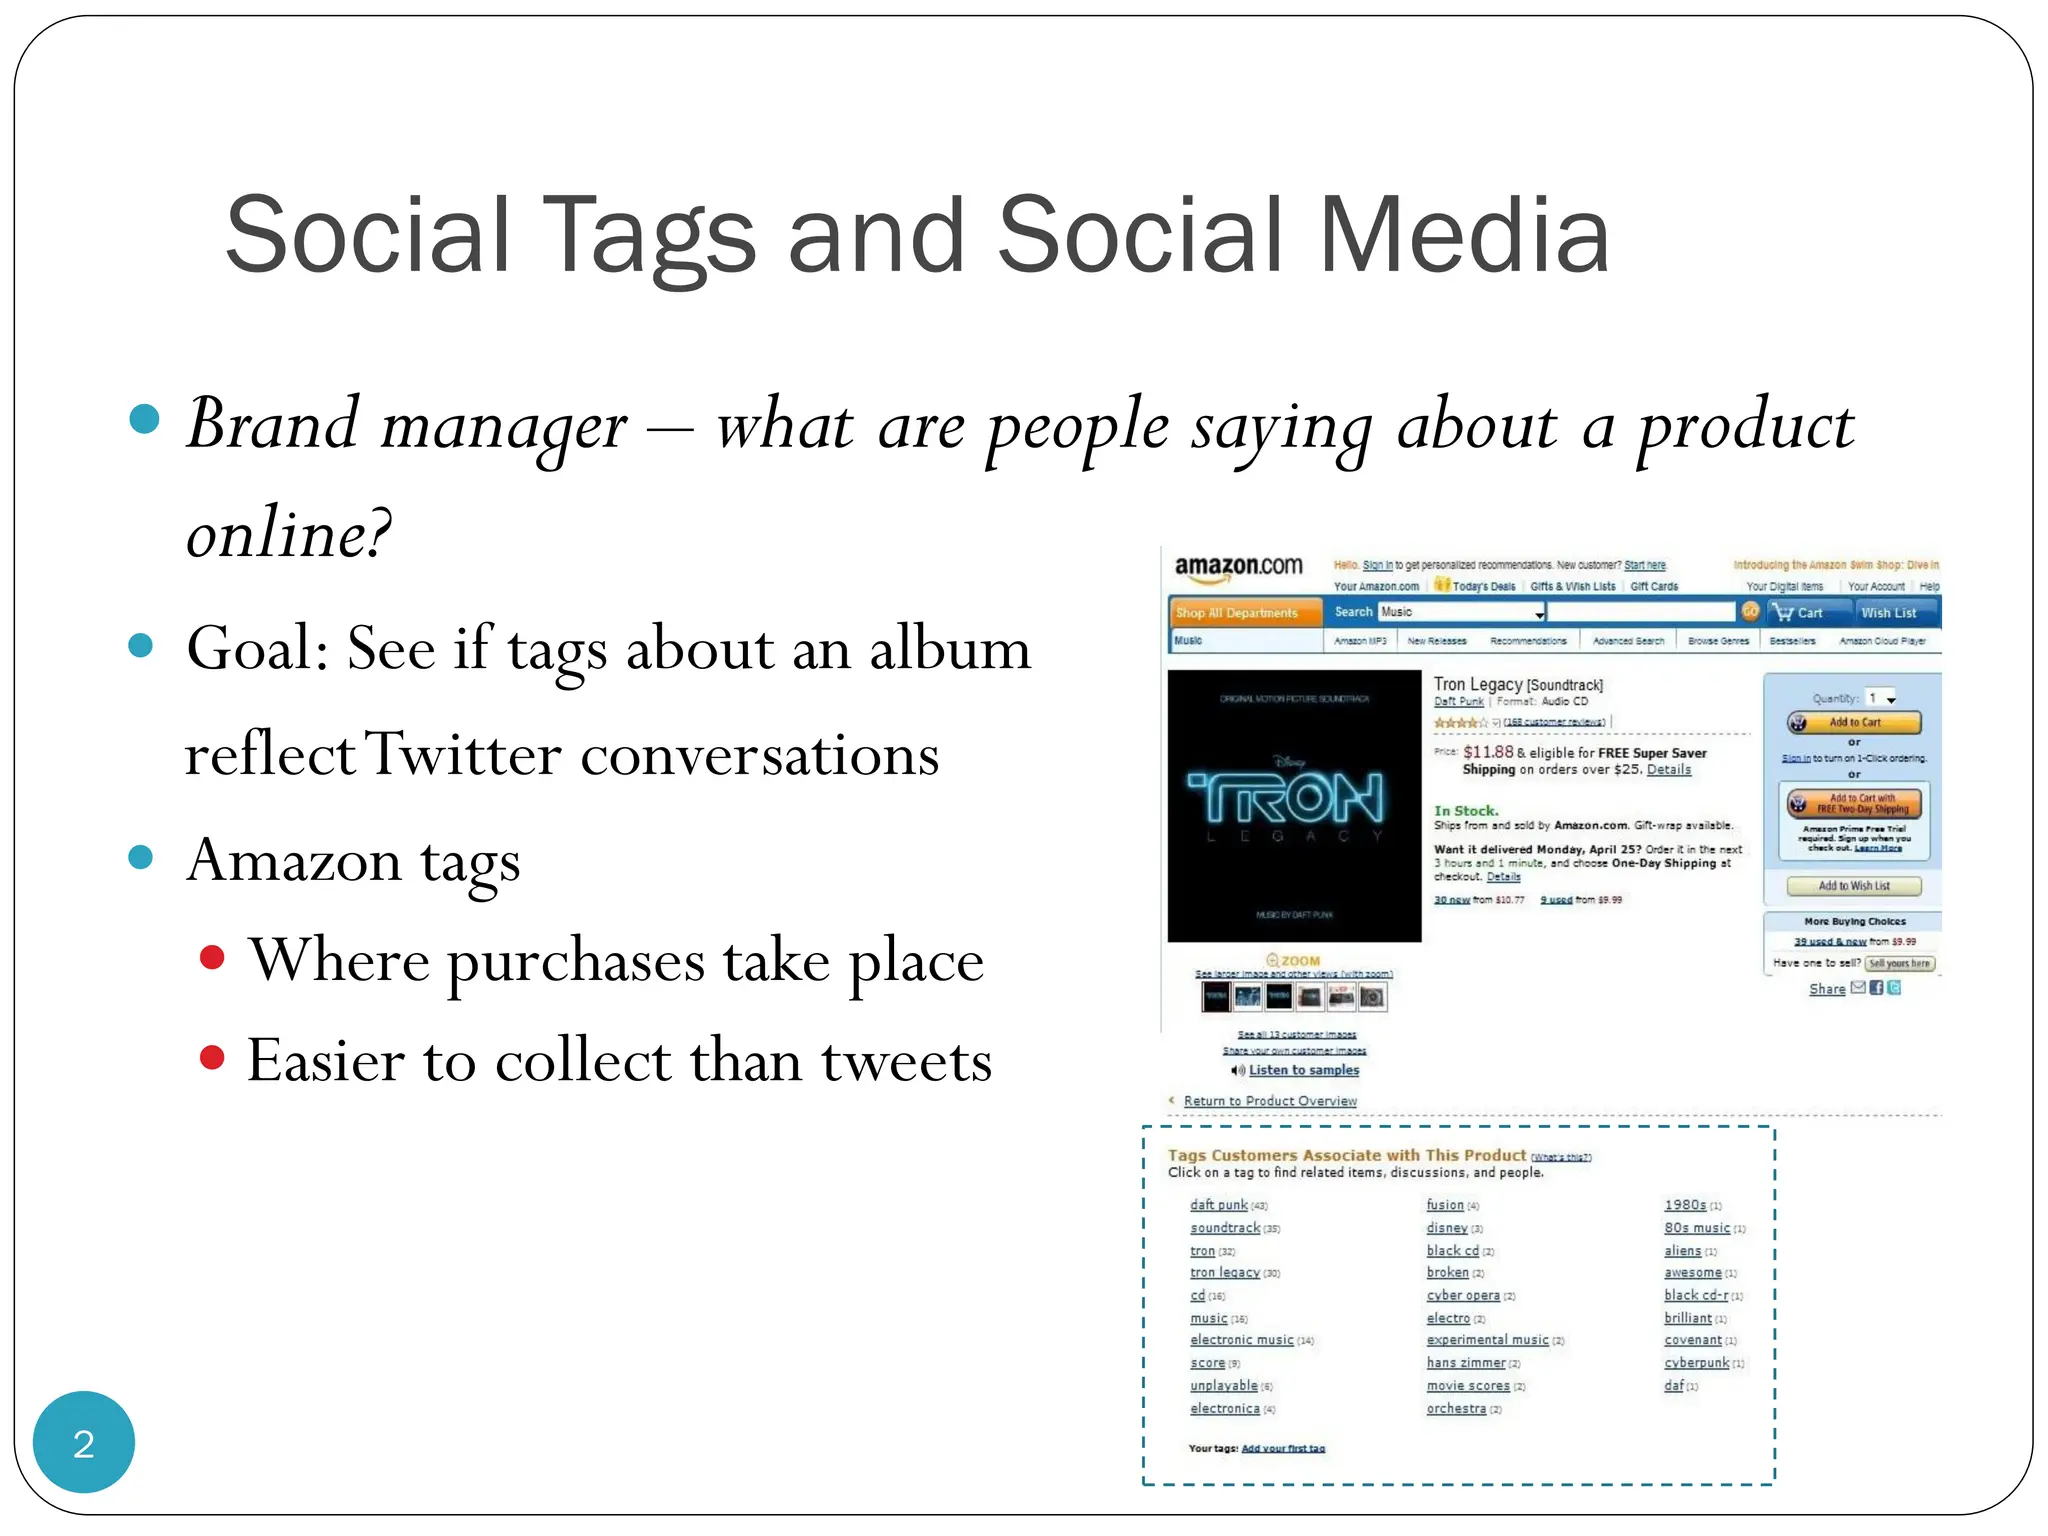
Social Tags andSocial Media
Brand manager – what are people saying about a product
online?
Goal: See if tags about an album
reflect Twitter conversations
Amazon tags
Where purchases take place
Easier to collect than tweets
2
3.
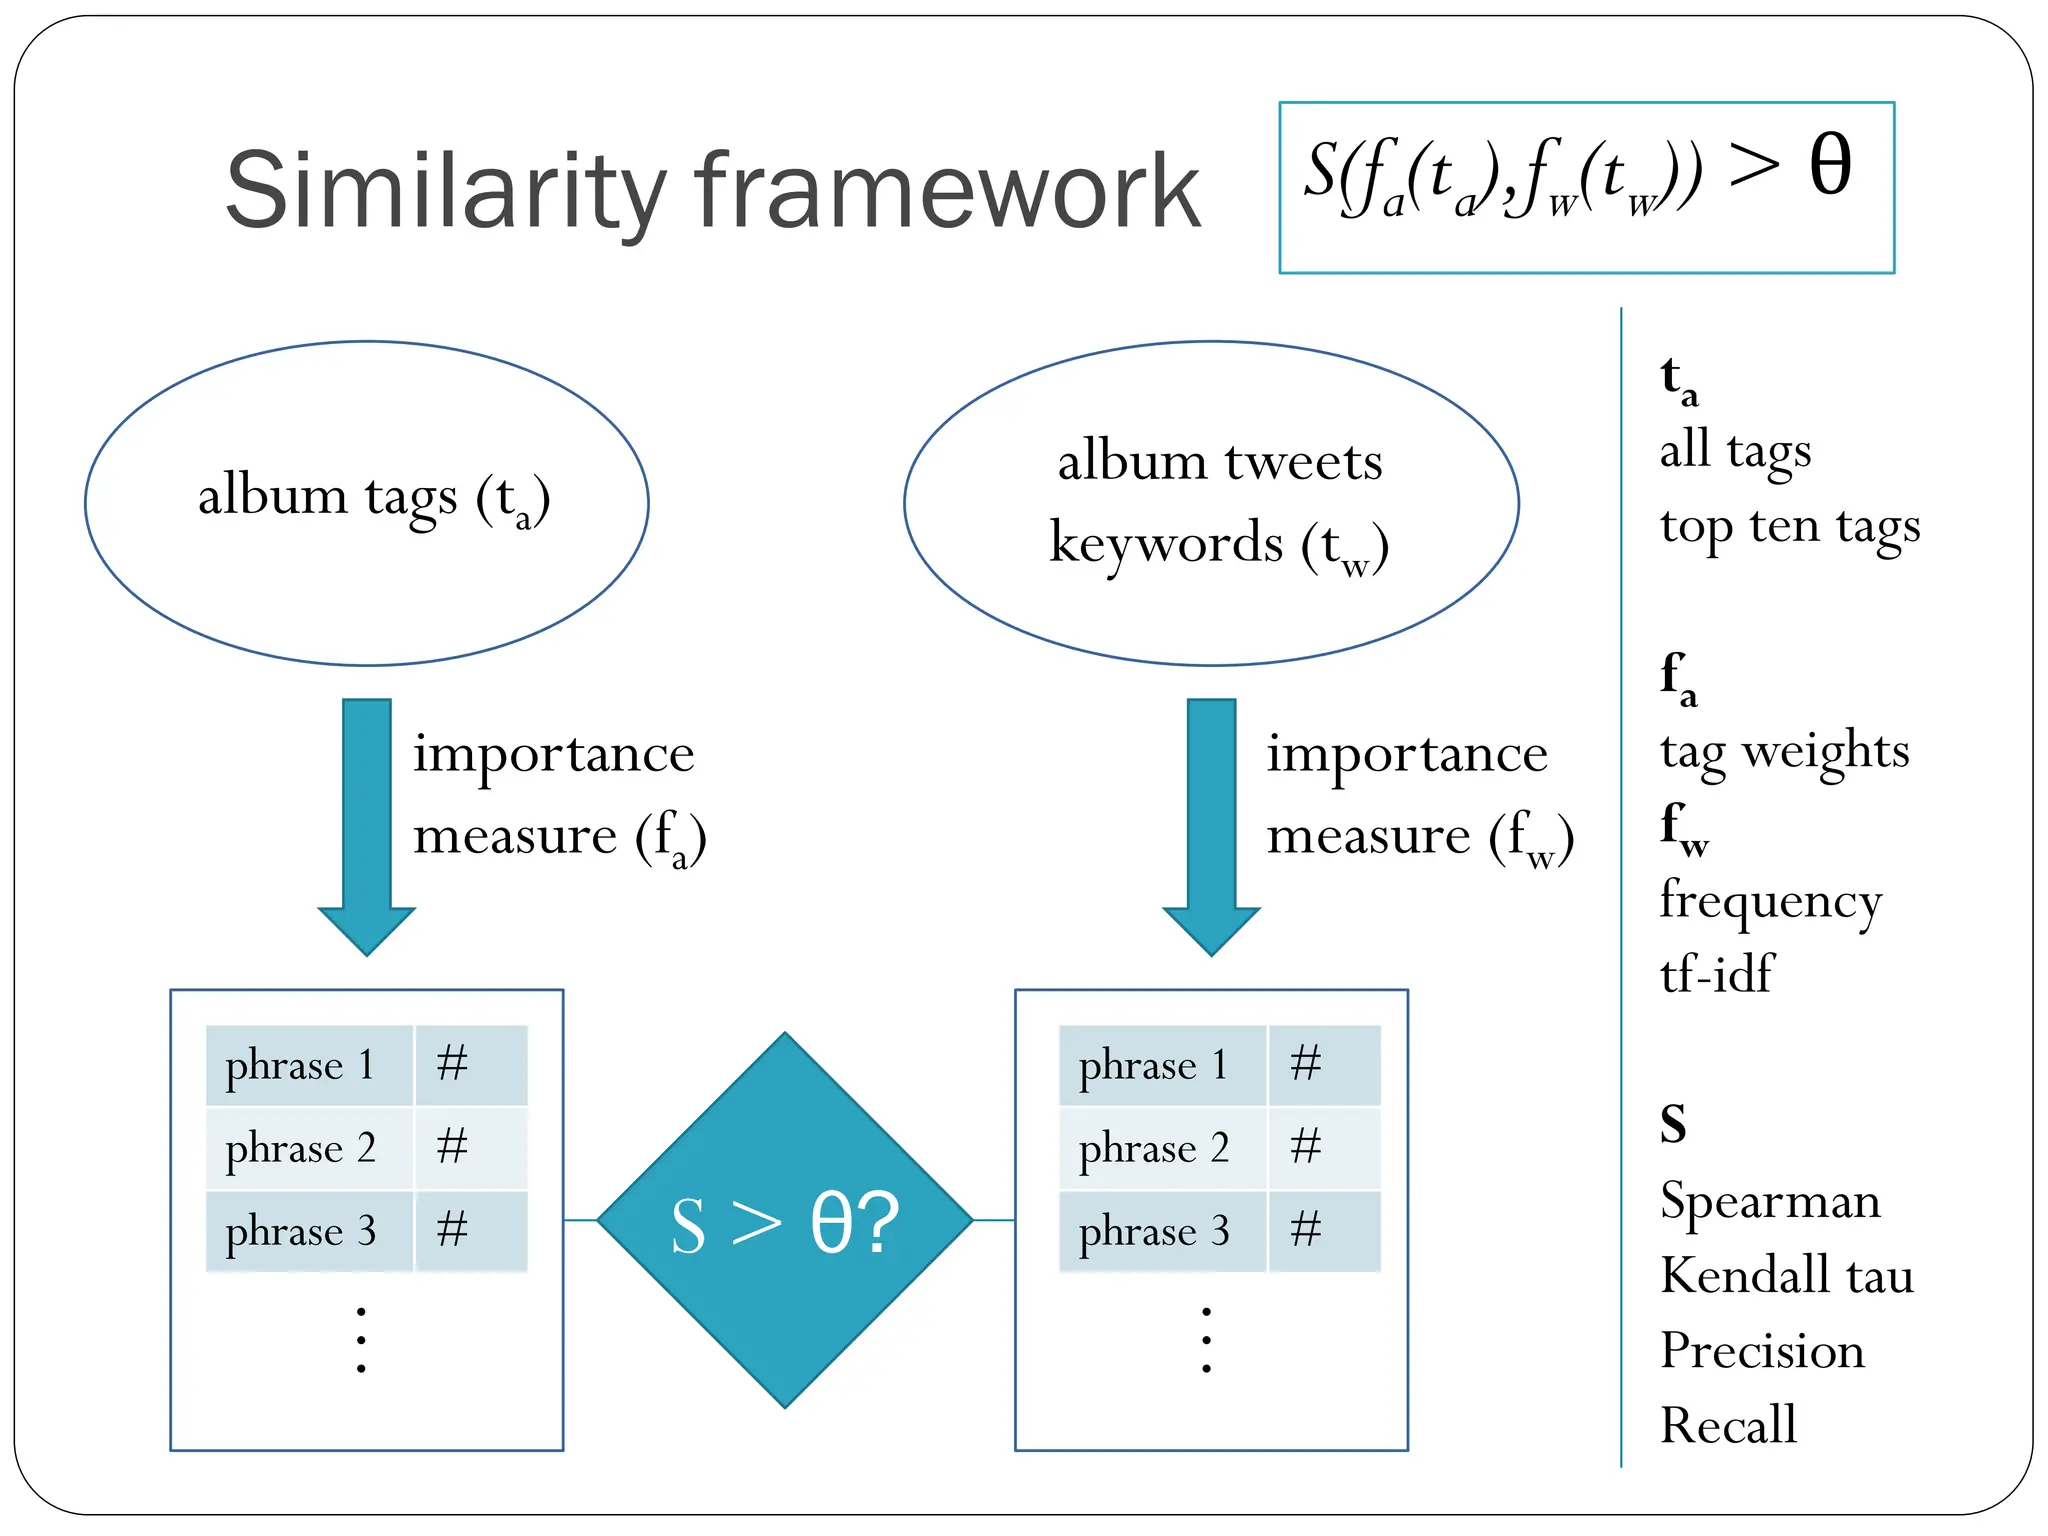
Similarity framework S(fa(ta),fw(tw))> θ
ta
album tweets all tags
album tags (ta) top ten tags
keywords (tw)
fa
importance importance tag weights
measure (fa) measure (fw) fw
frequency
tf-idf
phrase 1 # phrase 1 #
phrase 2 # phrase 2 # S
Spearman
phrase 3 # S > θ? phrase 3 #
Kendall tau
…
…
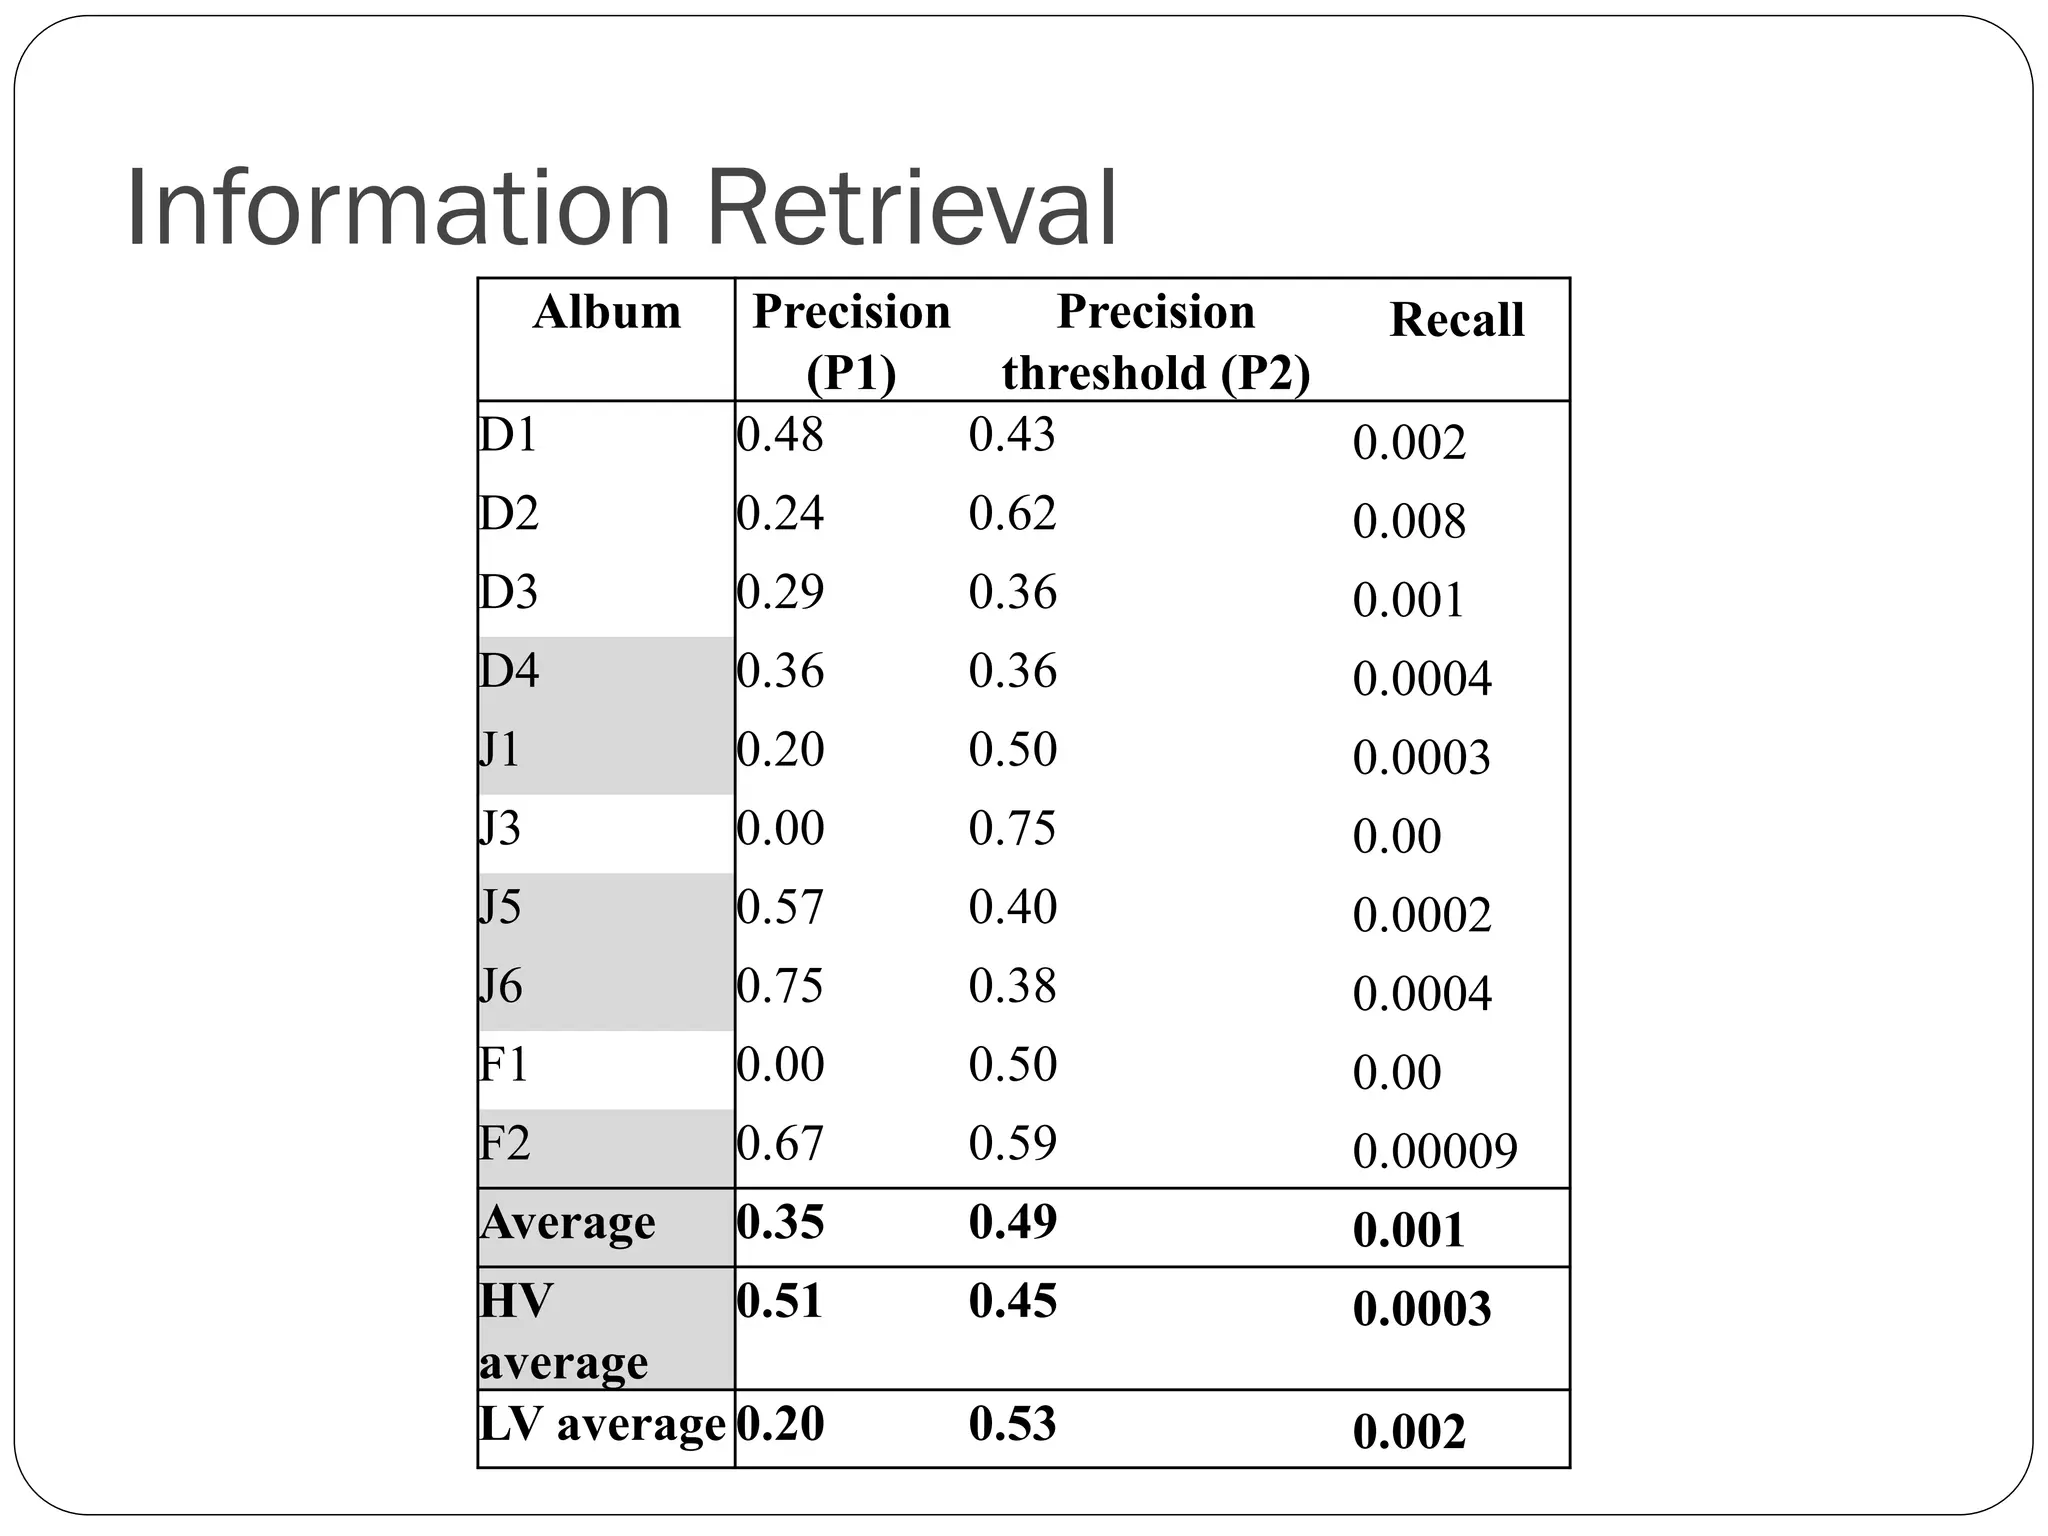
Precision
Recall
4.
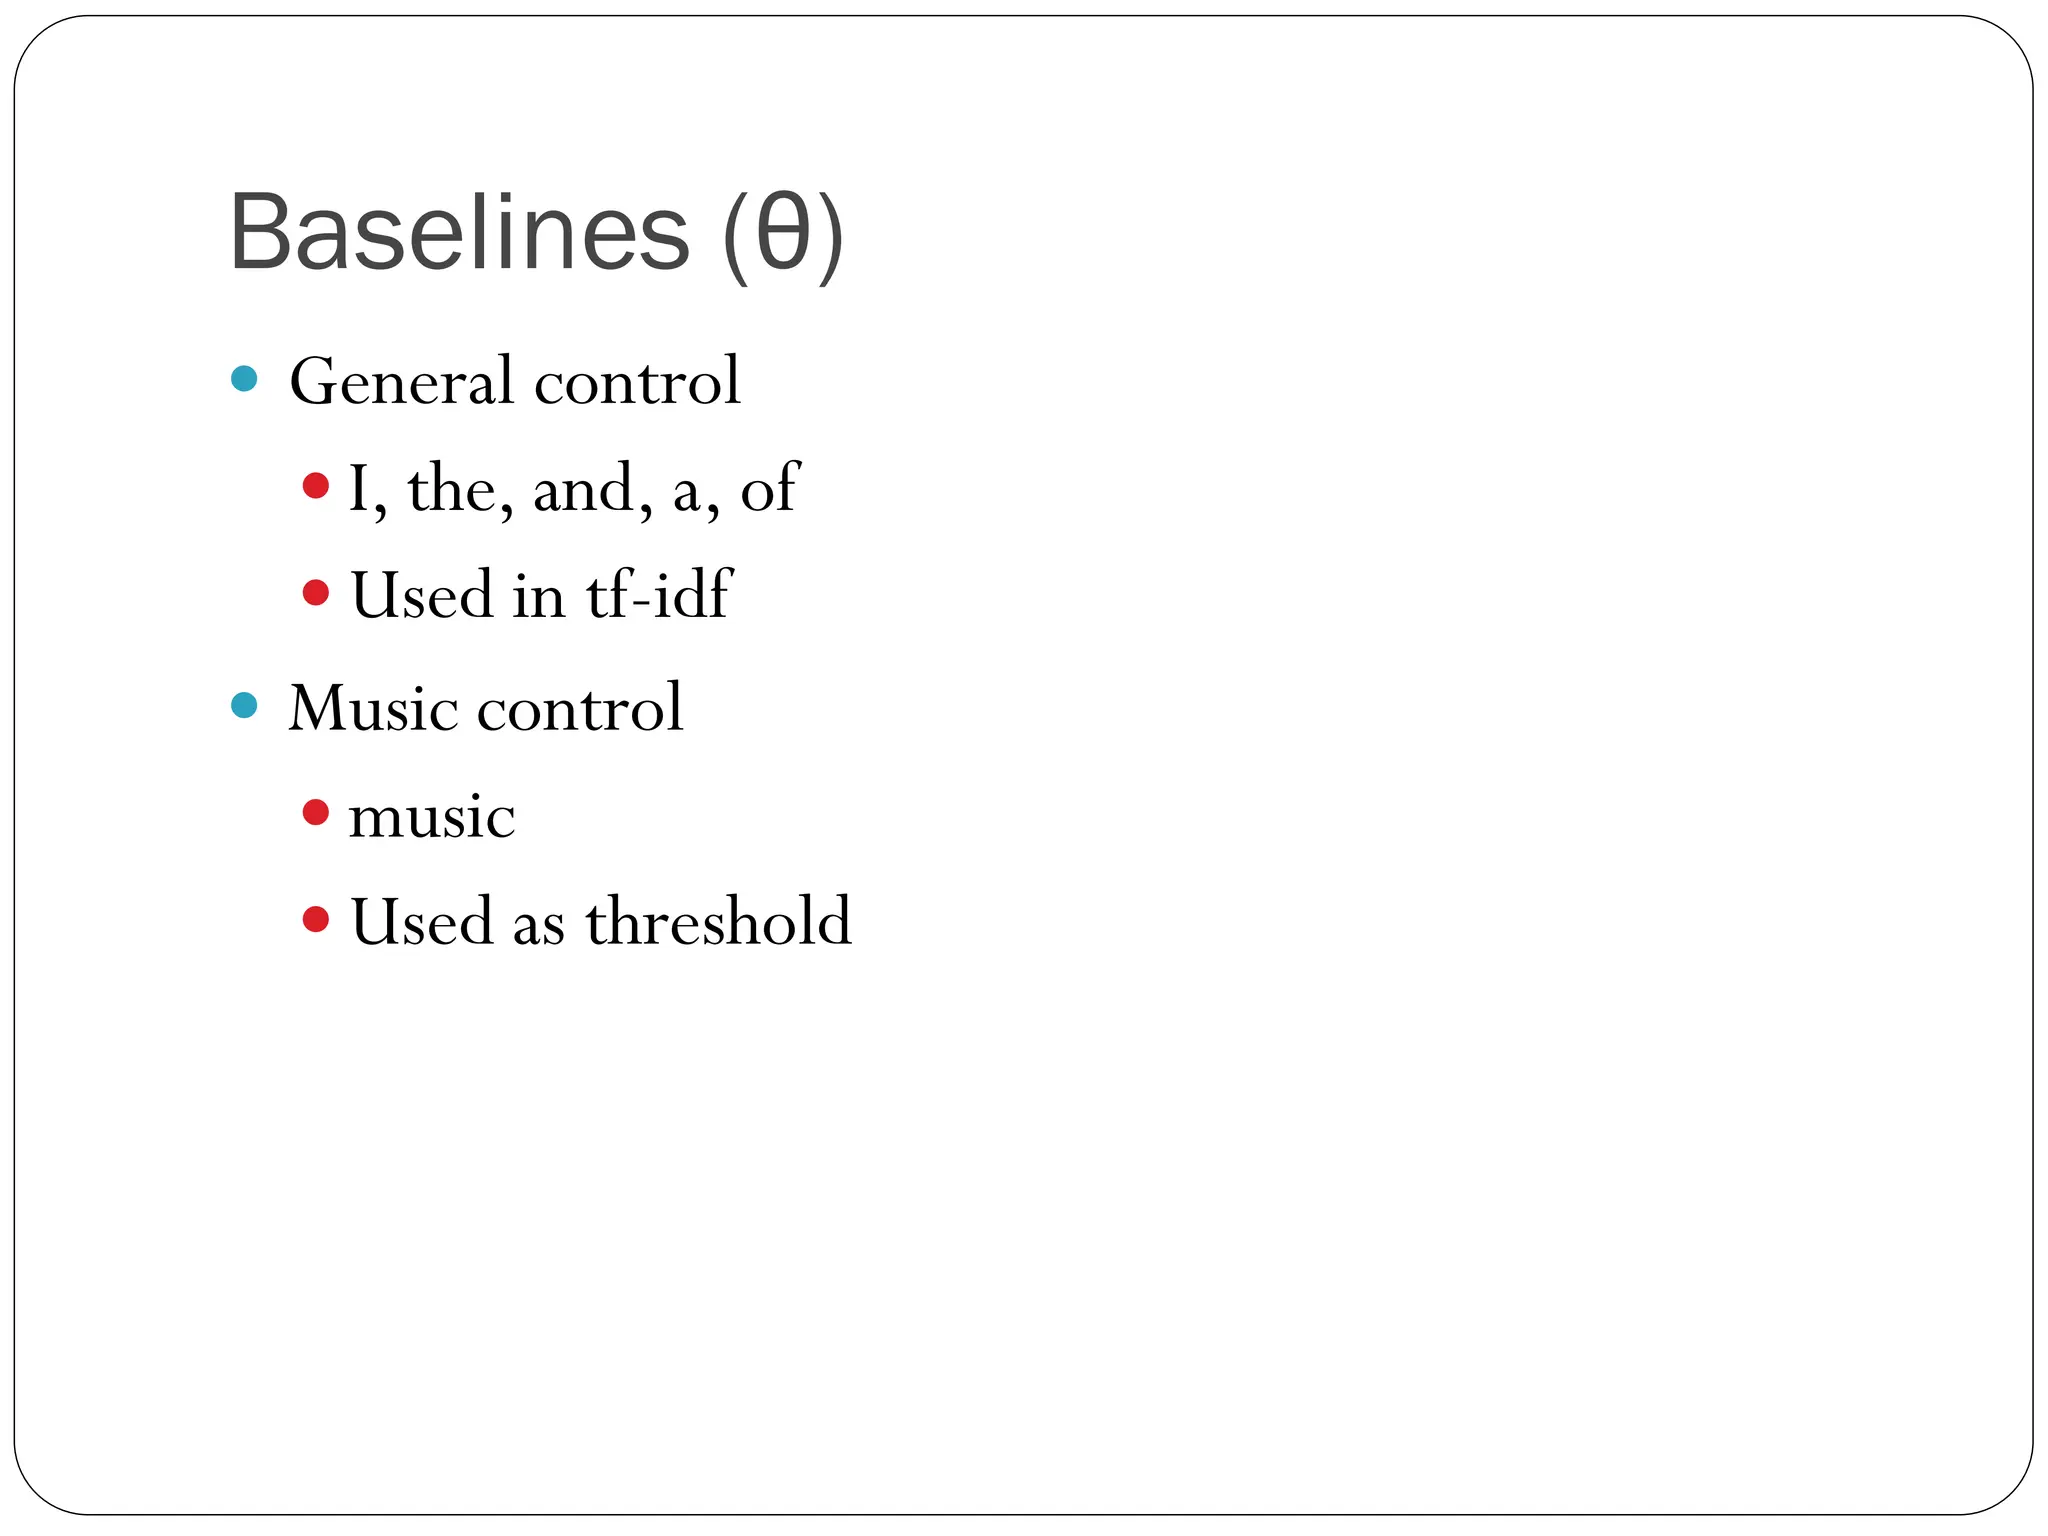
Baselines (θ)
Generalcontrol
I, the, and, a, of
Used in tf-idf
Music control
music
Used as threshold
5.
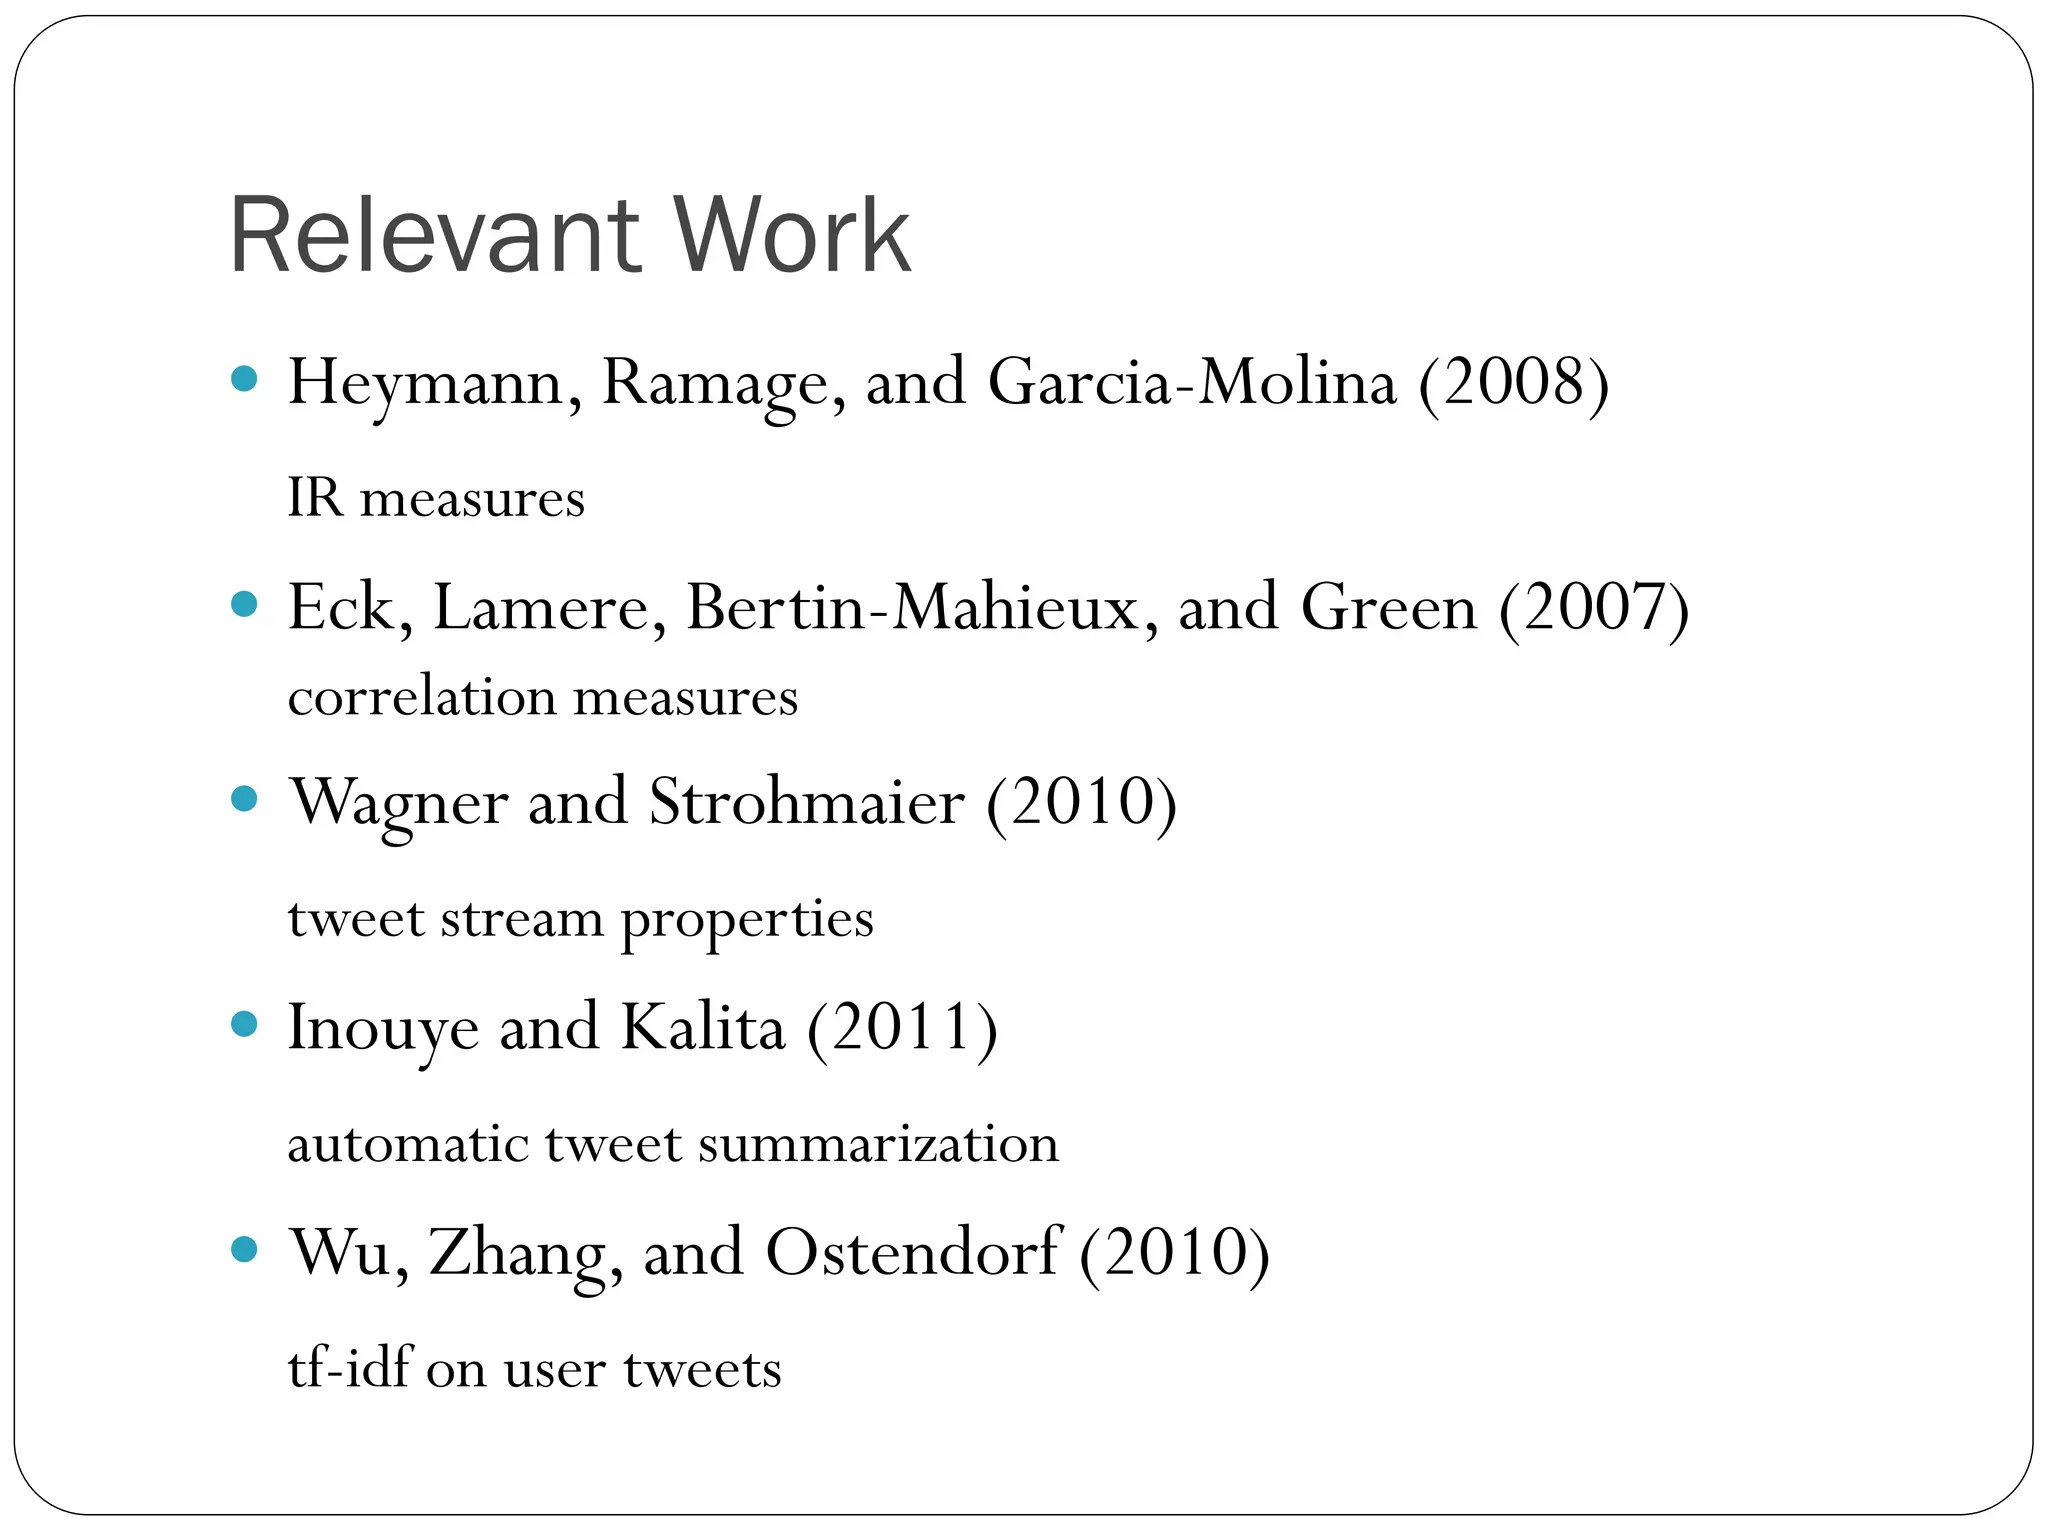
Relevant Work
Heymann,Ramage, and Garcia-Molina (2008)
IR measures
Eck, Lamere, Bertin-Mahieux, and Green (2007)
correlation measures
Wagner and Strohmaier (2010)
tweet stream properties
Inouye and Kalita (2011)
automatic tweet summarization
Wu, Zhang, and Ostendorf (2010)
tf-idf on user tweets
6.
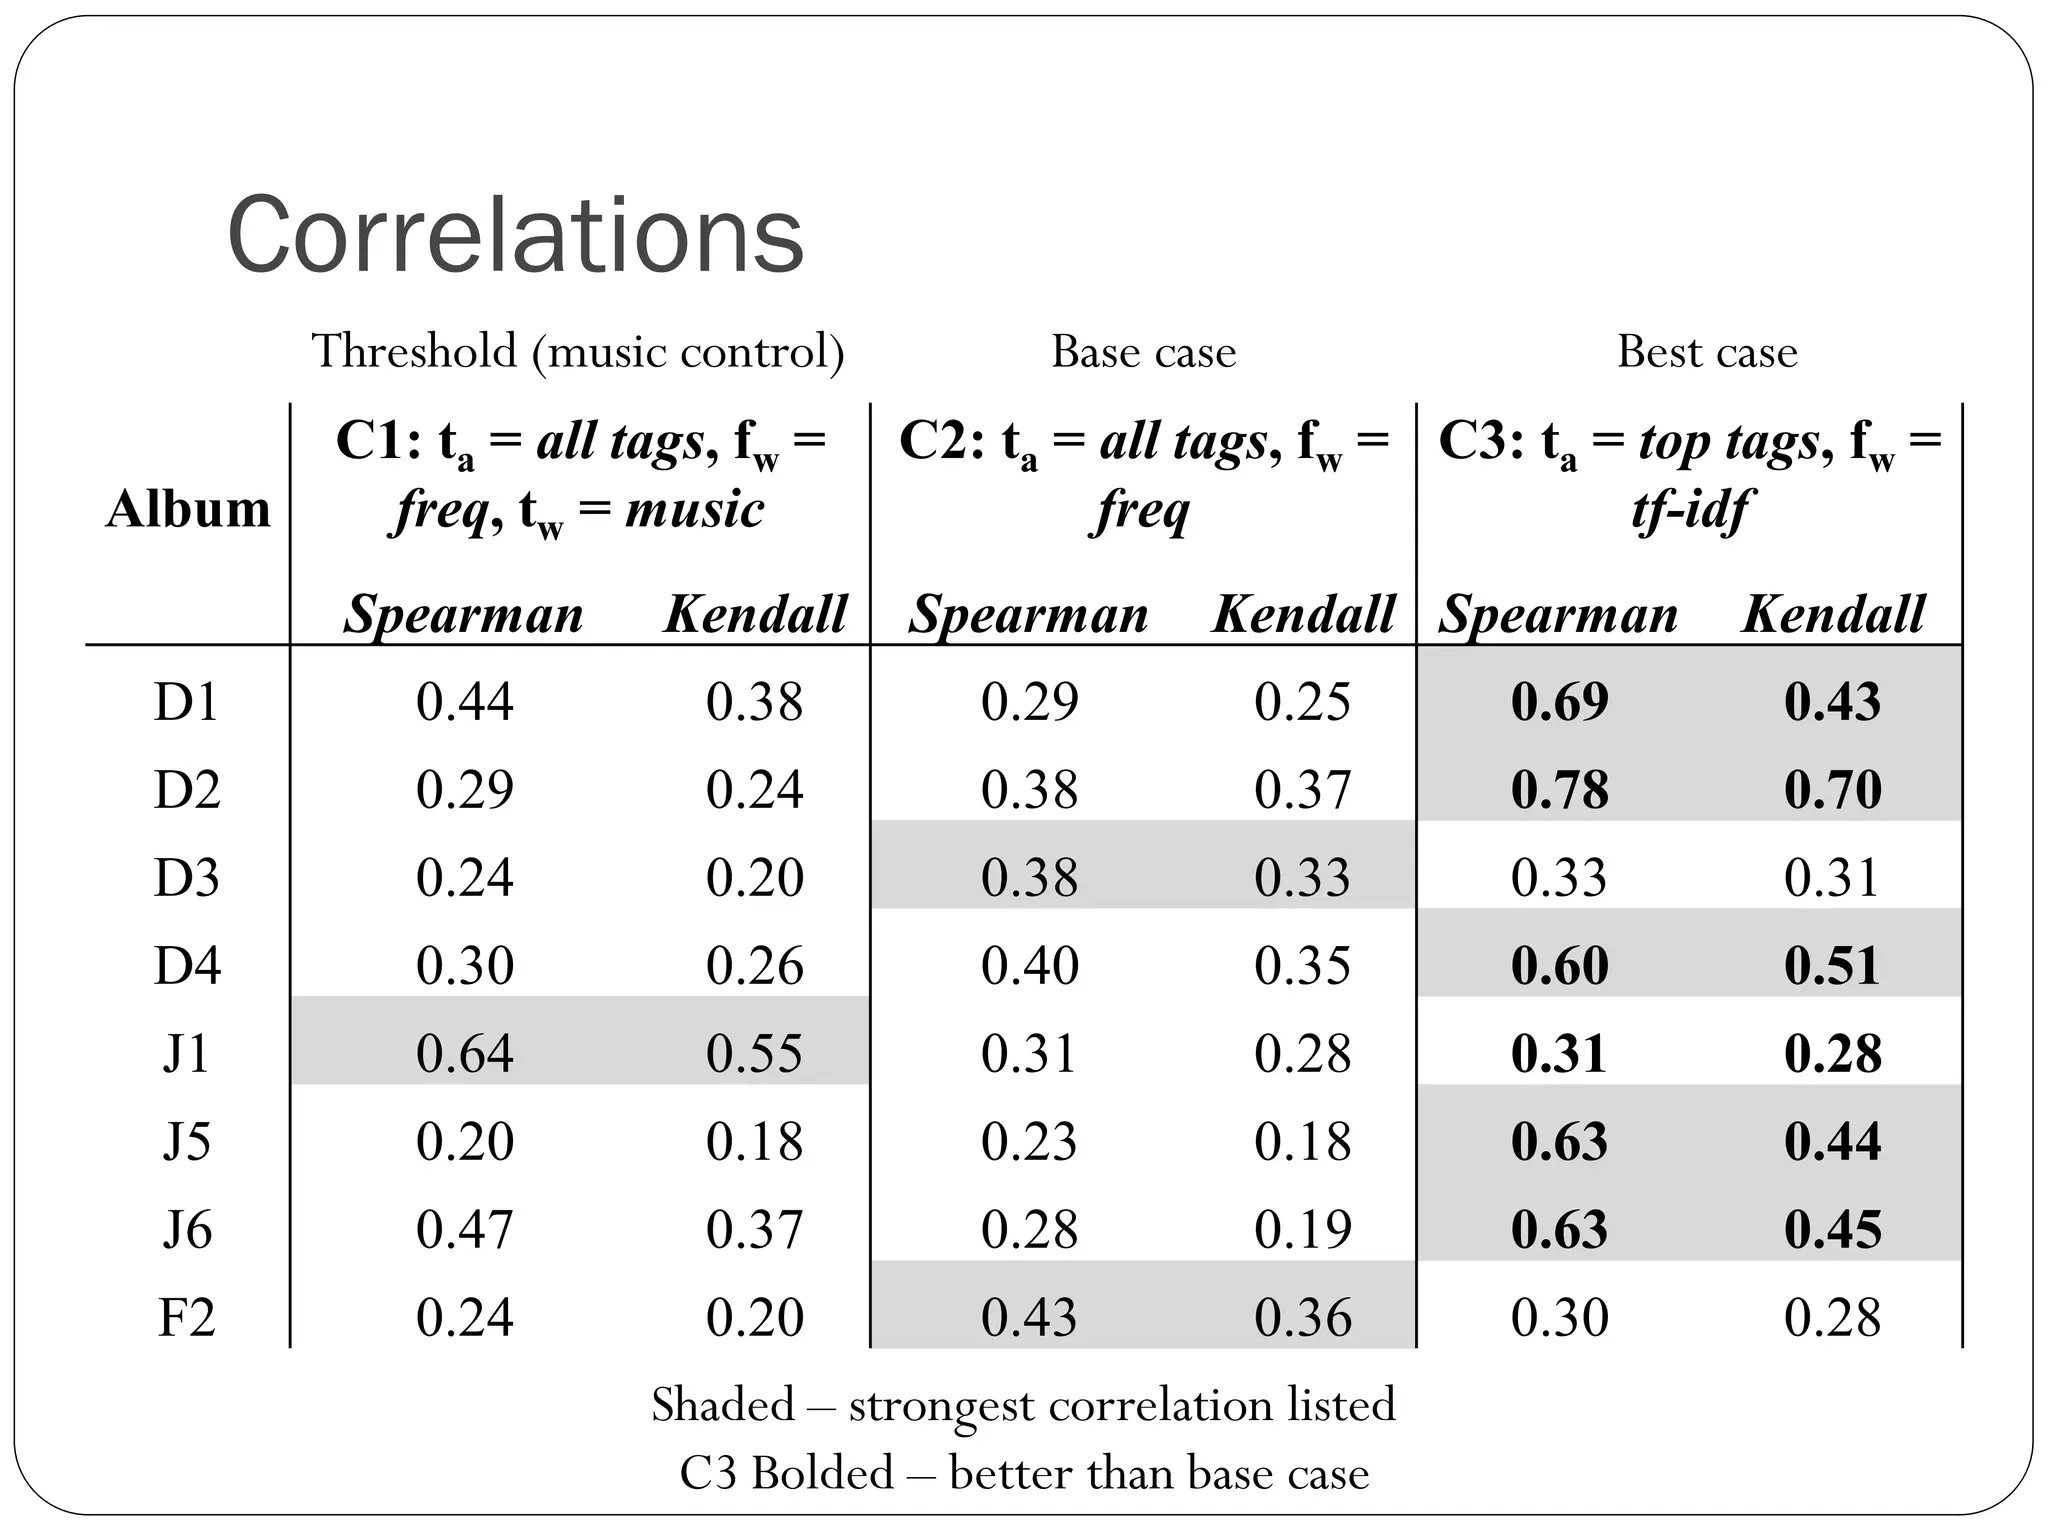
Correlations
Threshold (music control) Base case Best case
C1: ta = all tags, fw = C2: ta = all tags, fw = C3: ta = top tags, fw =
Album freq, tw = music freq tf-idf
Spearman Kendall Spearman Kendall Spearman Kendall
D1 0.44 0.38 0.29 0.25 0.69 0.43
D2 0.29 0.24 0.38 0.37 0.78 0.70
D3 0.24 0.20 0.38 0.33 0.33 0.31
D4 0.30 0.26 0.40 0.35 0.60 0.51
J1 0.64 0.55 0.31 0.28 0.31 0.28
J5 0.20 0.18 0.23 0.18 0.63 0.44
J6 0.47 0.37 0.28 0.19 0.63 0.45
F2 0.24 0.20 0.43 0.36 0.30 0.28
Shaded – strongest correlation listed
C3 Bolded – better than base case
Conclusions
Good proxyfor top content when sufficient Twitter activity
More relevant tags are higher in tweet keyword rankings
TF-IDF is effective
Next Steps
Larger dataset
Analysis over time
Other sources like LastFM
Linguistic analysis (clustering, stemming)
Other user-generated data (e.g. user reviews)