WheelTug PLC Pitch Deck | Investor Insights | April 2024
research report
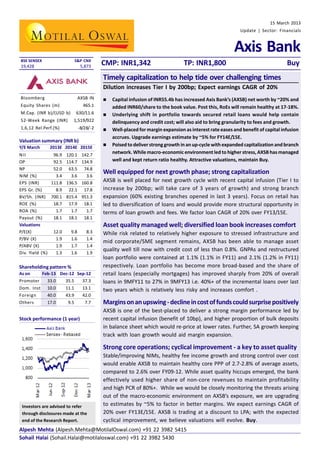
1. 15 March 2013
Update | Sector: Financials
Axis Bank
BSE SENSEX
S&P CNX
19,428
5,873
CMP: INR1,342
TP: INR1,800
Buy
Timely capitalization to help tide over challenging times
Dilution increases Tier I by 200bp; Expect earnings CAGR of 20%
Bloomberg
AXSB IN
Equity Shares (m)
465.1
M.Cap. (INR b)/(USD b)
630/11.6
52-Week Range (INR)
1,519/922
1,6,12 Rel.Perf.(%)
-8/28/-2
Valuation summary (INR b)
Y/E March
2013E 2014E 2015E
NII
96.9 120.1
OP
92.5 114.7
NP
52.0 63.5
NIM (%)
3.4
3.6
EPS (INR)
111.8 136.5
EPS Gr. (%)
8.9 22.1
BV/Sh. (INR) 700.1 815.4
ROE (%)
18.7 17.9
ROA (%)
1.7
1.7
Payout (%)
18.1 18.1
Valuations
P/E(X)
12.0
9.8
P/BV (X)
1.9
1.6
P/ABV (X)
1.9
1.7
Div. Yield (%)
1.3
1.6
142.7
134.9
74.8
3.6
160.8
17.8
951.3
18.1
1.7
18.1
Capital infusion of INR55.4b has increased Axis Bank’s (AXSB) net worth by ~20% and
added INR60/share to the book value. Post this, RoEs will remain healthy at 17-18%.
Underlying shift in portfolio towards secured retail loans would help contain
delinquency and credit cost; will also aid to bring granularity to fees and growth.
Well-placed for margin expansion as interest rate eases and benefit of capital infusion
accrues. Upgrade earnings estimate by ~5% for FY14E/15E.
Poised to deliver strong growth in an up-cycle with expanded capitalization and branch
network. While macro-economic environment led to higher stress, AXSB has managed
well and kept return ratio healthy. Attractive valuations, maintain Buy.
Well equipped for next growth phase; strong capitalization
AXSB is well placed for next growth cycle with recent capital infusion (Tier I to
increase by 200bp; will take care of 3 years of growth) and strong branch
expansion (60% existing branches opened in last 3 years). Focus on retail has
led to diversification of loans and would provide more structural opportunity in
terms of loan growth and fees. We factor loan CAGR of 20% over FY13/15E.
Asset quality managed well; diversified loan book increases comfort
8.3
1.4
1.4
1.9
Shareholding pattern %
As on
Feb-13 Dec-12 Sep-12
Promoter
33.0
35.5
37.3
Dom. Inst 10.0
11.1
13.1
Foreign
40.0
43.9
42.0
Others
17.0
9.5
7.7
Stock performance (1 year)
While risk related to relatively higher exposure to stressed infrastructure and
mid corporate/SME segment remains, AXSB has been able to manage asset
quality well till now with credit cost of less than 0.8%. GNPAs and restructured
loan portfolio were contained at 1.1% (1.1% in FY11) and 2.1% (1.2% in FY11)
respectively. Loan portfolio has become more broad-based and the share of
retail loans (especially mortgages) has improved sharply from 20% of overall
loans in 9MFY11 to 27% in 9MFY13 i.e. 40%+ of the incremental loans over last
two years which is relatively less risky and increases comfort .
Margins on an upswing - decline in cost of funds could surprise positively
AXSB is one of the best-placed to deliver a strong margin performance led by
recent capital infusion (benefit of 10bp), and higher proportion of bulk deposits
in balance sheet which would re-price at lower rates. Further, SA growth keeping
track with loan growth would aid margin expansion.
Strong core operations; cyclical improvement - a key to asset quality
Investors are advised to refer
through disclosures made at the
end of the Research Report.
Stable/improving NIMs, healthy fee income growth and strong control over cost
would enable AXSB to maintain healthy core PPP of 2.7-2.8% of average assets,
compared to 2.6% over FY09-12. While asset quality hiccups emerged, the bank
effectively used higher share of non-core revenues to maintain profitability
and high PCR of 80%+. While we would be closely monitoring the threats arising
out of the macro-economic environment on AXSB’s exposure, we are upgrading
to estimates by ~5% to factor in better margins. We expect earnings CAGR of
20% over FY13E/15E. AXSB is trading at a discount to LPA; with the expected
cyclical improvement, we believe valuations will evolve. Buy.
Alpesh Mehta (Alpesh.Mehta@MotilalOswal.com) +91 22 3982 5415
Sohail Halai (Sohail.Halai@motilaloswal.com) +91 22 3982 5430
2. Axis Bank
Well-equipped for next growth phase
Adequately capitalized
for next phase of growth
AXSB’s capital adequacy ratio (including 9M PAT) at end-9MFY13 was at 15.2%, with
Tier I at 10.3%. AXSB is well placed for next growth cycle with recent capital infusion
(Tier I to increase by 200bp; will take care of 3 years of growth; the deal adds INR60/
share to book value.) and strong branch expansion (60% existing branches opened in
last 3 years). We factor loan CAGR of 20% over FY13E/15E. With lower leverage, near
term RoEs would moderate by ~200bp but remain healthy at ~18%.
Well-capitalized - no need for dilution for at least the next three years (%)
Raised INR55.4b of
capital, implying a post
dilution P/BV of 2x; deal
adds INR60 to BV. Tier I
ratio would be 11%+ even
at end-FY15E, post
assumption of 20%
loan CAGR
Return ratios to remain healthy (%)
RoAs to be at
historical highs led by
improvement in core
operations; however,
reduction in leverage
would lead to a
moderation in
RoEs to 18%
Shifting loan mix in favor of secured retail loans - relatively better in terms
of asset quality outlook
40% of incremental loans
in the last two years has
come from the retail
segment
15 March 2013
Notwithstanding relatively high exposure to power segment, loan portfolio has
become more broad-based and the share of retail loans (especially mortgages) has
improved sharply from 20% of overall loans in 9MFY11 to 27% in 9MFY13 i.e. ~40% of
the incremental loans over last two years. Further, in SME segment, bank has been
very conservative and not only reduced the exposure (now 14% v/s 20% in FY09) but
mix has also shifted in favor of high rated borrowers (SME-4 and below at 18% v/s 26%
in 3QFY10). This would help AXSB contain slippages and credit cost, going forward.
2
3. Axis Bank
Mix shifting in favor of retail loans (%)…
Retail loan CAGR at 38%+ in last two years and its
contribution to incremental loans stood at 40%
Conservative lending in SME segment (%)...
…led by growth in secured products (%)
Key driver for growth in the retail loan was housing loan,
lower spreads but incremental risk would lower as well
... and mix has shifted to high rated borrowers (%)
Moderation in SME loan growth coupled with improving customer profile reduces the risk on balance sheet
Asset quality managed well; loan book becomes granular
Despite the challenging macro-environment, AXSB has been able to manage assert
quality fairly well and well within the guidance. GNPAs and restructured loan portfolio
were contained at 1.1% (1.1% in FY11) and 2.1% (1.2% in FY11) respectively.
While risk related to relatively higher exposure to stressed infrastructure and mid
corporate/SME segment remains, AXSB has been able to contain credit cost to less
than 0.8%.Further, the bank effectively used higher share of non-core revenues to
maintain high PCR of 80%+.
While the structural change in asset profile is positive, we have built in conservative
assumptions of 1.4% slippage ratio and 0.8% credit cost. In our view, asset quality
risks are embedded in valuations and improvement in economic growth may lead to
positive surprise.
15 March 2013
3
4. Axis Bank
Asset quality maintained well despite a challenging environment
AXSB's GNPAs and NNPAs
have been contained in a
narrow range through
different phases of
economic cycles
Restructured portfolio increased over last few quarters
Though restructuring has increased in last two to three quarters,
overall restructured loan portfolio remains under check
Barring couple of years,
bank has been able to
maintain the asset
quality fairly well.
Building slippages and
credit cost of 1.4% and
0.8% respectively
through FY13E-15E; this is
despite the economic
environment expected to
improve in 2HFY14E
Stress additions within management guidance
Management guidance for stress additions of INR10-11b
per quarter; however, performance better than guided
Asset quality remains manageable (%)
Demonstrating value of its liability franchise; CASA growth remains strong
AXSB’s strength has been its ability to grow CASA deposits (CAGR of 34% over FY0612). SA deposit CAGR has been the fastest among peers and further in terms of branch
productivity, SA/branch is highest for AXSB, demonstrating the strength of branch
network.CA deposits, strong corporate relationship and transaction banking
capabilities offering wide range of products for various business segments helped
the bank to post 19% CAGR in CA deposits over FY08-12. We expect the traction in
CASA to continue led by reversal of interest rate, continued branch expansion and
deepening of customer relationship. Expect CASA ratio to remain stable at ~39%.
15 March 2013
4
5. Axis Bank
Strong expansion and coverage over last 5 years
CASA ratio remains strong despite a challenging environment
(%)
AXSB's branches, centers covered and SA client base have
posted a CAGR of 24%, 26%, 20% in last five years
CASA CAGR highest among peers (%)
Strong expansion and increasing customer base have
helped AXSB to maintain the CASA ratio at 40%+
CA and SA market share over FY05-12 (%)
Strong CASA growth over past 6 years; demonstrates strength of liability franchise built over the years; AXSB continues to gain
market share
CA and SA per branch compared to peers (INR m)
CASA/branch declined in FY11-12 due to branch additions
(INR m)
CASA per branch is highest among peers even though CASA per branch moderated over past two years; expect improvement
as new branches mature and systemic interest rate declines
15 March 2013
5
6. Axis Bank
Margins on an upswing - decline in cost of funds could surprise positively
Benefit of capital raising
(10bp) and favorable ALM
in the falling interest rate
scenario to help margins
AXSB consistently delivered margins of 3.5%+, despite liquidity condition being tight,
thus reflecting its strong ALM management and benefit of liability franchise that it
has built over the years. In the current environment, AXSB is one of the best-placed
banks to deliver a strong margin performance led by recent capital infusion (benefit
of 10bp), and higher proportion of bulk deposits in balance sheet which would reprice at lower rates. While the proportion of bulk deposits declined from 41% in FY11,
it still remains high at 36%.
With a decline in deposit rates (at a faster pace for bulk deposits) and further expected
fall in bulk deposit rates, cost of funds is likely to come down at a faster pace. Further,
SA growth keeping track with loan growth would aid margin expansion. In FY14E, we
expect NII growth of 24% v/s loan growth of 20%, as margins are likely to improve due
to the benefit of capital raising (10bp) and favorable ALM in the falling interest rate
scenario.
Proportion of bulk deposits decline but still high at 36%
Consistently delivers NIMs of 3.3-3.5%+
Bulk deposit rates have cooled off by ~120bp YTD and 50bp
Fall in CD rates and equity infusion to benefit margins;
on an average YTD period compared to last year. With further
easing on the monetary front, cost of deposits to decline
however, growth in low yielding housing segment and
pressure on overall yield would act as a constraint
AXSB would be a key
beneficiary of falling
interest rate; but we built
in a margin improvement
of 20bp as we expect
pressure on yield and
AXSB's focus to grow
secured retail products
will lead to a decline in
yields as well
15 March 2013
Margins are expected to improve (%)
6
7. Axis Bank
Diversified fee income streams - Building strength via retail fees
Retail fees
as a proportion of overall
fees have increased to
31% at end-9MFY13
v/s 26 % in FY11
AXSB’s key strength and one of the driving force for its strong RoA has been superior
performance of fee income over the years. Notably, fee income CAGR of 40% and fee
income to average assets of 1.8% is one of the highest among peers. While fees from
corporate and capital market have slowed down, buoyancy in retail banking fees is
keeping overall fee income growth healthy at 15%.
With the falling share of lumpy corporate fees and increasing share of granular retail
fees, confidence on contribution of fees to average assets has increased. With
expected improvement in macro-economic environment and capital market, fee
income growth could surprise positively in FY14E and lead to an improvement in core
operating profitability.
Diversified fee income streams… (%)
…helped AXSB to maintain overall fee income growth (%)
CM: Capital market, LMC: Large and Mid-corporate,
BB: Business Banking, TF: Treasury fees,
S&A: SME and Agri Banking
Retail fees growth was impressive in the last two years and helped AXSB maintain a overall fee income growth of 15%, even
as fees from corporate and capital market slowed down considerably
Strong growth in wealth management and card fees (INR b)
Fees from wealth management and card business reported
a CAGR of 40% each over FY10-12, thus driving retail fees
15 March 2013
Fee income to average assets best among peers (%)
AXSB's fee income CAGR over FY07-12 was at 40% - best
among peers; fee income growth expected to be in line
with balance sheet growth, going forward
7
8. Axis Bank
Core operations to remain healthy; valuations below LPA...
Stable/improving NIMs, healthy fee income growth and strong control over cost would
enable AXSB to maintain healthy core PPP 2.7-2.8% of average assets, compared to
2.6% over FY09-12. Further, while asset quality hiccups emerged, the bank effectively
used higher share of non-core revenues to maintain profitability and high PCR of
~80%. While we would be closely monitoring the threats arising out of the macroeconomic environment on AXSB’s exposure, we are upgrading to estimates by ~5%
to factor in better margins (largely on back of capital infusion).
…improving macros and strong capitalization, thus re-rating on the cards
We expect earnings CAGR of 20% over FY13E/15E. RoAs are likely to remain healthy at
~1.6% and ~18% over FY14E/15E. With the expected cyclical improvement, we believe
valuations will evolve. Maintain Buy with a target price of INR1,800.
We upgrade earnings estimates by ~5% to factor benefit of capital raising (INR b)
Old Estimates
Net Interest Income
Other Income
Total Income
Operating Expenses
Operating Profits
Provisions
PBT
Tax
PAT
Margins (%)
Credit Cost (%)
RoA (%)
RoE (%)
FY13
96.0
65.0
161.0
69.4
91.6
15.5
76.1
24.7
51.4
3.34
0.80
1.7
20.5
FY14
115.9
76.8
192.6
82.2
110.4
20.6
89.8
29.2
60.6
3.42
0.80
1.7
20.4
FY15
137.9
89.7
227.6
97.4
130.1
24.1
106.1
34.5
71.6
3.44
0.80
1.7
20.3
Revised Estimates
FY13
96.9
65.0
162.0
69.4
92.5
15.5
77.0
25.0
52.0
3.37
0.80
1.7
18.7
FY14
120.1
76.8
196.9
82.2
114.7
20.6
94.0
30.6
63.5
3.55
0.80
1.7
17.9
FY15
142.7
89.7
232.3
97.4
134.9
24.1
110.8
36.0
74.8
3.56
0.80
1.7
18.1
Change (%)
FY13
1.0
0.0
0.6
0.0
1.0
0.0
1.2
1.2
1.2
FY14
3.7
0.0
2.2
0.0
3.8
0.0
4.7
4.7
4.7
FY15
3.5
0.0
2.1
0.0
3.7
0.0
4.5
4.5
4.5
Source: Company/MOSL
Axis Bank one-year forward P/E
Axis Bank one-year forward P/BV
2.1
15 March 2013
8
10. Axis Bank
Key exhibits from QIP document
Share of working capital finance has increased (%)
Growth moderates both in terms of loans and W.C. loans (%)
YTD
slowdown seen in loans towards term loans led by
Sharp slowdown seen in loans towards term loans led by economic slowdown and bank's have moved in favor of share of
share of non-retail loans cautious stance. Hence, working
economic slowdown and bank's cautious stance. Hence,
non-retail loans has moved in favor of working capital financecapital finance
Proportion of credit substitutes in customer assets increased
(INR b)
Corporate bond portfolio - largely top rated (%)
Credit Substitutes
Maturity profile of loans and deposits (%)
(1HFY13)
Higher share of term loans leading to higher maturities for
more than five years
15 March 2013
Proportion of assets and liabilities maturing in each bucket (%)
(1HFY13)
Less
than one year bucket shows higher maturity
mismatches
10
11. Axis Bank
Weighted average duration moves up (%)
Higher proportion of variable rate loan in balance sheet (%)
Interest rate by maturity
Loans
Variable Rates
Fixed Rates
Credit Subsitutes
Variable Rates
Fixed Rates
Loans and Credit subsitutes
Variable Rates
Fixed Rates
Weighted average duration for loans continues to be higher
than deposits
1 year 1-5 year
5 year+
Overall
80.7
19.3
91.1
8.9
98.4
1.6
92.3
7.7
4.8
95.2
1.9
98.1
1.9
98.1
2.5
97.5
72.3
27.7
78.9
89.1
82.0
21.1
10.9
18.0
Source: Company/MOSL
Of the overall customer assets, 82% loans are variable rate
assets; however, those maturing within a year have 28% of
loans that are fixed in nature
Average term deposits up 170bp since FY11 (%)
Yield on loans up 210bp since FY11 (%)
Deposits
Overall cost of funds increased led by higher term deposit
rates and increase in SA deposit rates
Strong traction in fees from life insurance business (INR m)
While yield on loan increased significantly, yield on
investments was up 70bp since FY11, thus restricting overall
improvement in yield on funds
Debt syndication volumes slow down (INR b)
(USD b)
Contribution of fees from third party sales increase
significantly and it formed 27%+ of retail fees in FY12,
compared to 20% in FY11
15 March 2013
In line with the moderation in economic activity, debt
syndication business slows down
11
12. Axis Bank
Break-up of customer assets: Retail loans increasing at a faster pace (INR b)
Sep 2012
Retail Loans
445.6
Infrastructure
166.3
Agriculture
126.6
Financial Institution other than HFCs
123.9
Metal & Metal products
117.2
Power
108.6
Engineering
79.4
Real Estate
78.9
Food Processing
74.3
HFCs
63.7
Auto ancillaries
55.5
Trading
51.9
Textiles
47.4
Transportation & Logistics
46.5
IT & ITES
27.9
Chemical & chemical products
27.7
Telecom
26.8
Gems & Jewellery
25.8
Drugs & Pharma
22.0
Cement
20.4
Petro and Petro Products
18.4
Entertainment & Media
15.1
Sugar
11.8
Paper & paper prods
9.3
Others
171.9
Gross loans & credit substitues
1,963.0
GNPAs in
corporate segment
have risen by ~50%
since FY11, whereas
retail NPAs have
declined in line with
industry trend
Growth (%)
FY11
FY12
FY10
% of funded exposure
FY11
FY12
33.2
34.9
42.1
35.5
54.7
25.2
66.3
31.1
-10.1
104.2
51.0
-3.3
25.1
12.7
2.7
57.0
150.5
127.7
32.0
0.0
-4.5
24.9
50.7
-42.8
31.0
34.5
18.1
5.9
10.0
7.9
4.6
5.1
2.1
4.5
4.4
2.9
2.0
4.4
3.1
2.7
1.6
2.0
1.9
1.4
1.3
1.8
2.3
1.0
0.6
1.4
6.9
100.0
17.9
5.9
10.6
8.0
5.3
4.8
2.7
4.3
2.9
4.4
2.3
3.2
2.9
2.3
1.3
2.3
3.5
2.4
1.3
1.3
1.6
0.9
0.6
0.6
6.7
100.0
34.6
49.8
6.8
51.2
2.7
34.4
43.1
18.8
55.2
23.4
50.2
11.2
3.6
30.2
31.2
-15.3
-45.7
-33.7
11.4
1.6
-14.9
15.1
54.6
12.4
2.1
20.9
1HFY13
20.0
22.7
7.3
8.5
9.4
6.5
10.0
6.3
4.5
6.0
5.3
5.5
3.1
4.0
4.3
4.0
3.7
3.8
4.5
3.2
2.8
2.8
2.9
2.6
2.5
2.4
2.5
2.4
1.4
1.4
1.6
1.4
1.6
1.4
1.3
1.3
1.2
1.1
1.1
1.0
1.2
0.9
0.9
0.8
0.8
0.6
0.6
0.5
5.7
8.8
100.0
100.0
Source: Company/MOSL
Slippages in corporate segment increase, while delinquency in retail segment remains low
(INR m)
Break-up of NPA
FY10
FY11
Corporate GNPA
Corporate NNPA
Retail GNPA
Retail NNPA
9,027
2,932
3,927
1,194
11,691
3,380
4,179
747
FY12 1HFY13
13,992
4,011
3,210
642
17,545
5,575
3,609
920
% of Segmental Loans
FY10
FY11
FY12 1HFY13
1.1
0.3
1.9
0.6
1.0
0.3
1.5
0.3
1.0
0.3
0.8
0.2
1.4
0.4
0.8
0.2
Top 10 corporate accounts form 41% of overall GNPAs and 50%+ of corporate GNPAs (INR m)
Adequate
provisions and
security cover
held by AXSB on
top corporate
GNPAs
15 March 2013
1HFY13
Entertainment & Media
Transportaion
Financial Institutions - Other than HFC
Pharma
Hotels
Engineering
Texti les
Gems & Jewelry
Drugs & Pharma
Paper & Paper Products
0/S Loans
Multiple
Multiple
Multiple
Consortium
Consortium
Consortium
Multiple
Consortium
Consortium
Consortium
4,093
1,941
657
513
431
413
350
291
237
217
Provisions
Security
4,093
6,215
291
913
562
127
77
818
65
1,256
62
520
350
430
291
49
237
424
188
140
Source: Company, MOSL
12
13. Axis Bank
Sector-wise GNPAs report healthy trend except for few sectors
(INR b)
1HFY13
GNPAs in
entertainment and
media increased
significantly led by a
large account;
however, bank has
adequately provided
for the same; GNPAs in
transportation
segment increased in
FY12
15 March 2013
FY11
Retail
446
Infrastructure
135
Agri
127
Metals
88
Power
86
Food Processing
74
Other Finan. Intemediaries 71
Real estate
66
Engineering
60
HFC
51
Trading
49
Transportation
46
Texti les
45
Auto ancilliary
44
IT & ITES
28
Chemicals
28
Telecom
27
Gems & Jewelry
25
Pharma
21
Cement
19
Ent. & Media
15
Sugar
11
Paper
9
Petro
8
Other Loans
158
19.6
5.6
11.6
5.6
4.3
3.2
6.3
3.5
2.9
4.8
3.5
2.4
2.9
1.8
1.4
2.5
3.8
2.6
1.3
1.3
0.7
0.7
0.7
1.6
5.6
% of Loans
FY12 1HFY13*
22.1
5.8
10.4
4.3
4.7
4.1
8.4
4.0
3.4
4.3
3.2
2.7
2.6
2.6
1.5
1.8
1.7
1.4
1.2
1.1
1.0
0.9
0.6
0.9
5.3
25.6
7.8
7.3
5.1
5.0
4.3
4.1
3.8
3.5
2.9
2.8
2.7
2.6
2.5
1.6
1.6
1.5
1.5
1.2
1.1
0.9
0.6
0.5
0.5
9.1
FY11
1.5
1.2
2.4
0.0
0.0
0.5
0.0
0.0
0.2
0.0
1.0
0.0
2.3
1.3
0.6
0.2
0.0
0.5
2.2
1.7
0.3
0.0
3.0
0.6
3.9
GNPA (%)
FY12 1HFY13
0.9
0.1
2.7
0.0
0.0
0.1
0.0
0.0
0.1
0.0
1.2
4.2
1.8
0.0
0.0
0.0
0.0
2.5
1.8
1.0
0.0
0.0
2.6
0.1
4.0
0.8
0.1
4.3
0.0
0.0
0.2
1.4
0.0
0.9
0.0
1.2
4.3
1.8
0.0
0.2
0.0
0.1
1.2
4.3
1.0
27.1
0.0
2.8
0.1
0.7
13
14. Axis Bank
Financials and Valuation
Income Statement
NII CAGR of 20%+ over FY13-15,
led by healthy loan CAGR of 20%
and improvement in NIM
Fee income growth to largely
track balance-sheet growth
Factored credit cost of 80bp over
FY14/15; strong provision
coverage ratio to provide cushion
On a high base of 27% CAGR over
FY10-12, AXSB is expected to
deliver earnings CAGR of 20%+
in next two years
(INR Million)
Y/E March
2010
Interest Income
116,380
Interest Expense
66,335
Net Interest Income
50,045
Change (%)
35.8
Non Interest Income
39,458
Net Income
89,503
Change (%)
36.0
Operating Expenses
37,097
Pre Provision Profits
52,406
Change (%)
40.7
Provisions (excl tax)
13,892
PBT
38,514
Tax
13,368
Tax Rate (%)
34.7
PAT
25,145
Change (%)
38.5
Equity Dividend (Incl tax)
5,674
Core PPP*
43,299
Change (%)
28.4
*Core PPP is (NII+Fee income-Opex)
2011
151,548
85,918
65,630
31.1
46,321
111,951
25.1
47,794
64,157
22.4
12,800
51,357
17,472
34.0
33,885
34.8
6,704
57,241
32.2
2012
219,946
139,769
80,177
22.2
54,202
134,380
20.0
60,071
74,309
15.8
11,430
62,878
20,456
32.5
42,422
25.2
7,701
70,662
23.4
2013E
273,353
176,420
96,933
20.9
65,026
161,959
20.5
69,414
92,546
24.5
15,531
77,015
25,030
32.5
51,985
22.5
9,427
85,149
20.5
Balance Sheet
Strong traction in CASA to
continue led by strong CAGR of
22% in SA deposits
Impressive traction in retail loans
expected to be a key driver of
growth in near term; Structurally
moving towards making the
portfolio granular
Y/E March
Equity Share Capital
Reserves & Surplus
Net Worth
Deposits
Change (%)
of which CASA Dep
Change (%)
Borrowings
Other Liabilities & Prov.
Total Liabilities
Current Assets
Investments
Change (%)
Loans
Change (%)
Fixed Assets
Other Assets
Total Assets
2014E
306,552
186,448
120,104
23.9
76,780
196,884
21.6
82,206
114,677
23.9
20,631
94,046
30,565
32.5
63,481
22.1
11,512
106,281
24.8
(INR Million)
2010
4,052
156,393
160,444
1,413,002
20.4
660,295
30.4
171,696
61,336
1,806,479
152,064
559,748
20.8
1,043,431
27.9
12,225
39,011
1,806,479
2011
4,105
185,883
189,988
1,892,378
33.9
777,674
17.8
262,679
82,089
2,427,134
214,087
719,916
28.6
1,424,078
36.5
22,731
46,321
2,427,134
2012
2013E
4,132
4,651
223,953
322,857
228,085
327,508
2,201,043 2,575,220
16.3
17.0
914,220 1,011,599
17.6
10.7
340,717
366,804
86,433
93,892
2,856,278 3,363,425
139,339
212,488
931,921 1,043,751
29.4
12.0
1,697,595 2,003,163
19.2
18.0
22,593
22,986
64,829
81,037
2,856,278 3,363,425
2014E
4,651
376,499
381,150
3,064,512
19.0
1,204,932
19.1
403,448
110,780
3,959,890
230,974
1,200,314
15.0
2,403,795
20.0
23,511
101,296
3,959,890
Asset Quality
Factored slippage ratio of 1.4%;
Asset quality to remain
manageable; PCR to remain
strong
15 March 2013
GNPA (INR m)
NNPA (INR m)
GNPA Ratio
NNPA Ratio
PCR (Excl Tech. write off)
PCR (Incl Tech. Write off)
E: MOSL Estimates
2015E
363,514
220,840
142,674
18.8
89,662
232,336
18.0
97,449
134,888
17.6
24,057
110,830
36,020
32.5
74,810
17.8
13,567
125,491
18.1
2015E
4,651
439,714
444,365
3,677,415
20.0
1,436,415
19.2
445,063
129,426
4,696,269
280,103
1,380,361
15.0
2,884,554
20.0
24,631
126,620
4,696,269
(%)
13,180
4,190
1.25
0.40
68.2
72.4
15,994
4,104
1.11
0.29
74.3
80.9
18,063
4,726
1.06
0.28
73.8
80.9
25,800
7,819
1.28
0.39
69.7
81.7
33,406
9,206
1.38
0.38
72.4
85.1
42,708
10,013
1.46
0.35
76.6
88.0
14
15. Axis Bank
Financials and Valuation
Ratios
Expect margin to improve led by
benefit of recent capital infusion
and re-pricing of wholesale
deposit at lower rates
Decadal high RoA's led by strong
core income and healthy asset
quality performance
Y/E March
Spreads Analysis (%)
Avg. Yield-Earning Assets
Avg. Yield on loans
Avg. Yield on Investments
Avg. Cost-Int. Bear. Liab.
Avg. Cost of Deposits
Interest Spread
Net Interest Margin
Profitability Ratios (%)
RoE
RoA
Int. Expense/Int.Income
Fee Income/Net Income
Non Int. Inc./Net Income
2010
2011
2012
2013E
2014E
2015E
7.8
8.6
6.7
4.6
4.4
3.2
3.3
7.8
8.4
6.9
4.6
4.5
3.2
3.4
9.0
9.9
7.7
6.0
6.0
3.1
3.3
9.5
10.5
7.9
6.4
6.5
3.1
3.4
9.1
9.9
7.6
5.8
5.7
3.2
3.6
9.1
9.9
7.6
5.8
5.6
3.2
3.6
19.2
1.5
57.0
27.3
44.1
19.3
1.6
56.7
26.1
41.4
20.3
1.6
63.5
28.2
40.3
18.7
1.7
64.5
29.2
40.1
17.9
1.7
60.8
28.0
39.0
18.1
1.7
60.8
28.1
38.6
45.5
45.9
33.8
34.6
120.1
124.0
1.4
1.5
off accounts
44.9
35.4
124.5
1.5
43.6
35.8
128.5
1.6
41.9
36.3
133.8
1.7
Efficiency Ratios (%)
Cost/Income*
46.1
Empl. Cost/Op. Exps.
33.9
Busi. per Empl. (INR m)
105.2
NP per Empl. (INR lac)
1.2
* ex treasury and Recoveries from written
Strong capitalization to ensure
dilution free growth for next
three years
Asset-Liability Profile (%)
Loans/Deposit Ratio
CASA Ratio
Investment/Deposit Ratio
G-Sec/Investment Ratio
CAR
Tier 1
Valuation
Book Value (INR)
Change (%)
Price-BV (x)
Adjusted BV (INR)
Price-ABV (x)
EPS (INR)
Change (%)
Price-Earnings (x)
Dividend Per Share (INR)
Dividend Yield (%)
E: MOSL Estimates
15 March 2013
73.8
46.7
39.6
61.1
15.8
11.2
75.3
41.1
38.0
61.3
12.7
9.4
77.1
41.5
42.3
62.7
13.7
9.5
77.8
39.3
40.5
61.7
15.3
11.6
78.4
39.3
39.2
63.8
14.6
11.4
78.4
39.1
37.5
66.6
13.8
11.1
396.2
39.3
463.1
16.9
389.5
62.1
22.7
456.6
2.9
82.5
33.0
12.0
0.9
14.0
1.0
547.4
18.2
2.5
540.0
2.5
102.7
24.4
13.1
16.0
1.2
700.1
27.9
1.9
689.2
1.9
111.8
8.9
12.0
17.3
1.3
815.4
16.5
1.6
802.5
1.7
136.5
22.1
9.8
21.2
1.6
951.3
16.7
1.4
937.3
1.4
160.8
17.8
8.3
24.9
1.9
15
16. Disclosures
This report is for personal information of the authorized recipient and does not construe to be any investment, legal or taxation advice to you. This research report does not constitute an offer, invitation or inducement
to invest in securities or other investments and Motilal Oswal Securities Limited (hereinafter referred as MOSt) is not soliciting any action based upon it. This report is not for public distribution and has been
furnished to you solely for your information and should not be reproduced or redistributed to any other person in any form.
Unauthorized disclosure, use, dissemination or copying (either whole or partial) of this information, is prohibited. The person accessing this information specifically agrees to exempt MOSt or any of its affiliates
or employees from, any and all responsibility/liability arising from such misuse and agrees not to hold MOSt or any of its affiliates or employees responsible for any such misuse and further agrees to hold MOSt
or any of its affiliates or employees free and harmless from all losses, costs, damages, expenses that may be suffered by the person accessing this information due to any errors and delays.
The information contained herein is based on publicly available data or other sources believed to be reliable. While we would endeavour to update the information herein on reasonable basis, MOSt and/or its
affiliates are under no obligation to update the information. Also there may be regulatory, compliance, or other reasons that may prevent MOSt and/or its affiliates from doing so. MOSt or any of its affiliates or
employees shall not be in any way responsible and liable for any loss or damage that may arise to any person from any inadvertent error in the information contained in this report . MOSt or any of its affiliates
or employees do not provide, at any time, any express or implied warranty of any kind, regarding any matter pertaining to this report, including without limitation the implied warranties of merchantability, fitness
for a particular purpose, and non-infringement. The recipients of this report should rely on their own investigations.
This report is intended for distribution to institutional investors. Recipients who are not institutional investors should seek advice of their independent financial advisor prior to taking any investment decision
based on this report or for any necessary explanation of its contents.
MOSt and/or its affiliates and/or employees may have interests/positions, financial or otherwise in the securities mentioned in this report. To enhance transparency, MOSt has incorporated a Disclosure of Interest
Statement in this document. This should, however, not be treated as endorsement of the views expressed in the report.
Disclosure of Interest Statement
1. Analyst ownership of the stock
2. Group/Directors ownership of the stock
3. Broking relationship with company covered
4. Investment Banking relationship with company covered
Axis Bank
No
No
No
No
Analyst Certification
The views expressed in this research report accurately reflect the personal views of the analyst(s) about the subject securities or issues, and no part of the compensation of the research analyst(s) was, is, or
will be directly or indirectly related to the specific recommendations and views expressed by research analyst(s) in this report. The research analysts, strategists, or research associates principally responsible
for preparation of MOSt research receive compensation based upon various factors, including quality of research, investor client feedback, stock picking, competitive factors and firm revenues.
Regional Disclosures (outside India)
This report is not directed or intended for distribution to or use by any person or entity resident in a state, country or any jurisdiction, where such distribution, publication, availability or use would be contrary to
law, regulation or which would subject MOSt & its group companies to registration or licensing requirements within such jurisdictions.
For U.K.
This report is intended for distribution only to persons having professional experience in matters relating to investments as described in Article 19 of the Financial Services and Markets Act 2000 (Financial
Promotion) Order 2005 (referred to as "investment professionals"). This document must not be acted on or relied on by persons who are not investment professionals. Any investment or investment activity to
which this document relates is only available to investment professionals and will be engaged in only with such persons.
For U.S.
Motilal Oswal Securities Limited (MOSL) is not a registered broker - dealer under the U.S. Securities Exchange Act of 1934, as amended (the"1934 act") and under applicable state laws in the United States.
In addition MOSL is not a registered investment adviser under the U.S. Investment Advisers Act of 1940, as amended (the "Advisers Act" and together with the 1934 Act, the "Acts), and under applicable state
laws in the United States. Accordingly, in the absence of specific exemption under the Acts, any brokerage and investment services provided by MOSL, including the products and services described herein
are not available to or intended for U.S. persons.
This report is intended for distribution only to "Major Institutional Investors" as defined by Rule 15a-6(b)(4) of the Exchange Act and interpretations thereof by SEC (henceforth referred to as "major institutional
investors"). This document must not be acted on or relied on by persons who are not major institutional investors. Any investment or investment activity to which this document relates is only available to major
institutional investors and will be engaged in only with major institutional investors. In reliance on the exemption from registration provided by Rule 15a-6 of the U.S. Securities Exchange Act of 1934, as amended
(the "Exchange Act") and interpretations thereof by the U.S. Securities and Exchange Commission ("SEC") in order to conduct business with Institutional Investors based in the U.S., MOSL has entered into
a chaperoning agreement with a U.S. registered broker-dealer, Motilal Oswal Securities International Private Limited. ("MOSIPL"). Any business interaction pursuant to this report will have to be executed within
the provisions of this chaperoning agreement.
The Research Analysts contributing to the report may not be registered /qualified as research analyst with FINRA. Such research analyst may not be associated persons of the U.S. registered broker-dealer,
MOSIPL, and therefore, may not be subject to NASD rule 2711 and NYSE Rule 472 restrictions on communication with a subject company, public appearances and trading securities held by a research analyst
account.
For Singapore
Motilal Oswal Capital Markets Singapore Pte Limited is acting as an exempt financial advisor under section 23(1)(f) of the Financial Advisers Act(FAA) read with regulation 17(1)(d) of the Financial Advisors
Regulations and is a subsidiary of Motilal Oswal Securities Limited in India. This research is distributed in Singapore by Motilal Oswal Capital Markets Singapore Pte Limited and it is only directed in Singapore
to accredited investors, as defined in the Financial Advisers Regulations and the Securities and Futures Act (Chapter 289), as amended from time to time.
In respect of any matter arising from or in connection with the research you could contact the following representatives of Motilal Oswal Capital Markets Singapore Pte Limited:
Nihar Oza
Kadambari Balachandran
Email: niharoza.sg@motilaloswal.com
Email : kadambari.balachandran@motilaloswal.com
Contact: (+65) 68189232
Contact: (+65) 68189233 / 65249115
Office address: 21 (Suite 31), 16 Collyer Quay, Singapore 049318
Motilal Oswal Securities Ltd
Motilal Oswal Tower, Level 9, Sayani Road, Prabhadevi, Mumbai 400 025
Phone: +91 22 3982 5500 E-mail: reports@motilaloswal.com