SlideShare a Scribd company logo
1 of 1
Download to read offline
Leading, preparing & supporting
the tourism industry
for success & sustainability
A collaboration of the University of Minnesota Extension &
College of Food, Agricultural & Natural Resource Sciences
Perceived Bicycle Safety in Minnesota
Rebecca Brown, MURP, Tian Guo, MS, & Ingrid Schneider, PhD
Introduction & Purpose
A bike renaissance may be occurring1. Increased biking is of interest for a
number of reasons. Biking has physical health benefits, mental health benefits
& is a major promotion for Minnesota tourism in 2012. Between 2000 and
2009, participation in bicycle commuting in Minnesota increased 88%2.
Perceived safety can be a major factor on the decision to bicycle, whether for
function or fun3. Constraints to leisure and transportation, like perceived safety,
are important to understand and manage to ensure the potential benefits are
maximized. Perceived safety can have an impact on physical activity as people
are more likely to walk or bike if they perceive safety from traffic4. Finally, high
perceived safety is important for communities interested in promoting their
area as a biking tourism destination.
However, the majority of biking research is urban in focus with few regional
comparisons available. As such, the purpose of this project was to determine
perceived bicycle safety among Minnesotans and compare differences in
perceived safety by regional residence and cycling participation.
Methods
Sample: A representative sample of 7,488 MN residents
Instrument: 12 page mail questionnaire, included questions on
perceived biking safety, residence
Analysis: Descriptive, correlation, & comparative with a
perceived bicycle safety scale ( = 0.76)
Results: Perceived Safety
Overall Perceived Bicycle Safety:
Respondents throughout Minnesota considered their community somewhat
safe to bicycle. Average perceived bicycle safety was 4.77 on a 7 point scale
(Table 1).
Regional Differences
Respondents in the South perceived higher bicycling safety than Metro, Central,
and Northeast regional residents. Southern respondents perceived greater
safety on 4 of the 5 safety items:
•• Community bike safety: South > Metro & Northeast
•• Traffic & speed: South > Metro & Central
•• Roadway design: South > Central & Northeast
•• Amount of traffic: South > Central & Northeast
Discussion
Overall Safety & Regional Differences: While Minnesotans rate their
communities as somewhat safe for cycling, there is room to improve and
increase perceived safety. Given the lower scores for traffic & design, greater
attention to these areas in public campaigns for biking and actual
development may be warranted. The concern with traffic mirrors some other
research, although traffic’’s impact on biking participation is inconsistent,
Overall and among non-cyclists, Southern MN residents rated their
communities as safer for biking than did other Minnesotans. Further research
regarding the reasons for this greater perceived safety are of interest. Despite
the bicycle infrastructure and bicycling opportunities in the Metro region, the
region was not perceived as significantly more safe for bicycling than the other
regions. In a related vein, findings from a Center of Transportation Studies
report indicated no difference in participation in non-motorized transportation
after investments in bicycle infrastructure in the Twin Cities Metro Region5.
Cyclists vs. Non-Cyclists: Perceived safety between cyclists and non-
cyclists differed only in the Metro region. Given the higher traffic densities in
the Metro, this may not be surprising. Campaigns to encourage biking should
consider these safety concerns. Perceived safety increases with increased
biking6, so as biking participation increases in the Metro, these perceptions
may change. Future research should consider the type and intensity of biking
to further differentiate these perceptions.
Figure 1: Perceived bicycle safety between cyclists and non-cyclists in Minnesota regions.
*Significant at p<.05
Safety items Mean SD
How safe is your community for bicyclists? 5.11 1.59
It is safe to ride a bike, considering traffic and speeds 4.71 1.78
Buses drive too fast in my area & make it unsafe for bikers &
pedestrians*
4.67 1.59
It is safe to ride a bike considering the design of the roadway (e.g.
shoulder width, edge lines, rumble strips)
4.63 1.79
There is so much traffic along nearby streets that it makes it difficult
or unpleasant to bike*
4.62 1.9
Scale ( = 0.76) 4.77 1.23
Differences by participation: Cyclists vs. Non-Cyclists
Two regional differences emerged when examining perceived safety by biking
participation: 1) cyclists in the Metro region perceived significantly greater
safety than non-cyclists (Figure 1), and 2) non-cyclists from the South region
rated bicycle safety higher than non-cyclists from Metro, Central, and
Northeast regions.
Table 1: Mean response scores and standard deviations for perceived safety items
References
1Pucher, J., Buehler, R., & Seinen, M. (2011). Bicycling renaissance in North America? an update and re-
appraisal of cycling trends and policies. Transportation Research Part A, 45, 451-475.
2Swanson, K. (2012). Bicycling and Walking in the United States 2012 Benchmarking Report. Washington, DC:
Alliance for Biking & Walking.
3Heinen, E., Maat, K., & Wee, B. (2010). Commuting by bicycle: an overview of the literature. Transport Reviews,
30(1), 59-96.
4Jacobsen, P. L., Racioppi, F., & Rutter, H. (2009). Who owns the roads? How motorised traffic discourages
walking and bicycling. Injury Prevention, 15(6), 369-373.
5Gotschi, T., Krizek, K. J., McGinnis, L., Lucke, J., & Barbeau, J. (2011). Nonmotorized Transportation Pilot
Program Evaluation Study, Phase 2. Minneapolis: Center for Transportation Studies, University of Minnesota.
6Xing, Y., Handy, S. L., & Mokhtarian, P. L. (2010). Factors associated with proportions and miles of bicycling for
transportation and recreation in six small US cities. Transportation Research Part D, 15(2), 73-81.
Results: Demographics
Response Rate: 45% response rate (3,308); 53.2% from Twin Cites
Age range: 18-98 years
Cycling participation: 45% report bicycling outside in last 12 months
Limitations: The Twin Cities Metro area is treated as a homogenous study
region yet it represents a spectrum of environments, from highly urbanized
areas to suburban neighborhoods and rural communities. Future research can
examine differences within the metro region and perhaps among differing
levels of urbanization. The number of responses received from the survey did
not allow comparisons between bicycle commuters and recreation bicyclists.
Differentiating by cycling frequency & tourist status may be of interest as well.
EMT EMT
EMT EMT
4.3
4.4
4.5
4.6
4.7
4.8
4.9
5
Metro* Central NE NW South
Mean Perceived
Safety Scale
Region
Cyclists
Non-cyclists
Metro cyclists perceived significantly greater safety than non-cyclists on
3 of the 5 safety items:
•• Bus speed: metro cyclist > non cyclist
•• Roadway design: metro cyclist > non cyclist
•• Amount of traffic: metro cyclist > non cyclist
Note: 7 = greater safety; * = items reverse coded
Thanks to MnDOT for project support!

More Related Content

Similar to Perceived Bicycle Safety in Minnesota

Differentiating Commuters on Perceived Bike Safety & Transportation Attributes
Differentiating Commuters on Perceived Bike Safety & Transportation AttributesDifferentiating Commuters on Perceived Bike Safety & Transportation Attributes
Differentiating Commuters on Perceived Bike Safety & Transportation AttributesUniversity of Minnesota Tourism Center
 
Cycling safety in number
Cycling safety in numberCycling safety in number
Cycling safety in numberJumpingJaq
 
Public Bicycle Share Programs and Their Impact on Cyclist-Involved Injury
Public Bicycle Share Programs and Their Impact on Cyclist-Involved InjuryPublic Bicycle Share Programs and Their Impact on Cyclist-Involved Injury
Public Bicycle Share Programs and Their Impact on Cyclist-Involved InjuryTyler Rosen
 
ATS-16: Making Data Count, Miguel Figliozzi
ATS-16: Making Data Count, Miguel FigliozziATS-16: Making Data Count, Miguel Figliozzi
ATS-16: Making Data Count, Miguel FigliozziBTAOregon
 
Cycling-as-an-active-mode-of-transport-literature-review-FINAL-28-July-2014
Cycling-as-an-active-mode-of-transport-literature-review-FINAL-28-July-2014Cycling-as-an-active-mode-of-transport-literature-review-FINAL-28-July-2014
Cycling-as-an-active-mode-of-transport-literature-review-FINAL-28-July-2014Rina Douglas
 
Active transportation
Active transportationActive transportation
Active transportationSachaSmart1
 
Awareness on Road Signs and Markings of Drivers and Passengers along Maharlik...
Awareness on Road Signs and Markings of Drivers and Passengers along Maharlik...Awareness on Road Signs and Markings of Drivers and Passengers along Maharlik...
Awareness on Road Signs and Markings of Drivers and Passengers along Maharlik...IJAEMSJORNAL
 
N_Anderson Capstone Final Document_ word
N_Anderson Capstone Final Document_ wordN_Anderson Capstone Final Document_ word
N_Anderson Capstone Final Document_ wordNicole Anderson
 
Cost-Benefit Analysis of Greenways
Cost-Benefit Analysis of GreenwaysCost-Benefit Analysis of Greenways
Cost-Benefit Analysis of GreenwaysJessie Baker
 
Transportation Ecoefficiency: Quantitative Measurement of Urban Transportatio...
Transportation Ecoefficiency: Quantitative Measurement of Urban Transportatio...Transportation Ecoefficiency: Quantitative Measurement of Urban Transportatio...
Transportation Ecoefficiency: Quantitative Measurement of Urban Transportatio...Anna McCreery
 
Manatee County APHA Power of Policy Application
Manatee County APHA Power of Policy ApplicationManatee County APHA Power of Policy Application
Manatee County APHA Power of Policy ApplicationMegan Jourdan
 
Opportunities for soft mobility issues, walking and cycling in urban and subu...
Opportunities for soft mobility issues, walking and cycling in urban and subu...Opportunities for soft mobility issues, walking and cycling in urban and subu...
Opportunities for soft mobility issues, walking and cycling in urban and subu...Abebe Dress Beza
 
2013 Good To Go Impact Survey Report
2013 Good To Go Impact Survey Report2013 Good To Go Impact Survey Report
2013 Good To Go Impact Survey ReportTyler Curtis
 
Safe States Slide Master
Safe States Slide MasterSafe States Slide Master
Safe States Slide MasterHeather Gramp
 
Ward 30 bike reportv3
Ward 30 bike reportv3Ward 30 bike reportv3
Ward 30 bike reportv3bikingtoronto
 
MS Thesis- Professional Women Active Commuters- Apparel Design Criteria
MS Thesis- Professional Women Active Commuters- Apparel Design CriteriaMS Thesis- Professional Women Active Commuters- Apparel Design Criteria
MS Thesis- Professional Women Active Commuters- Apparel Design CriteriaTheresa Lastovich
 

Similar to Perceived Bicycle Safety in Minnesota (20)

Differentiating Commuters on Perceived Bike Safety & Transportation Attributes
Differentiating Commuters on Perceived Bike Safety & Transportation AttributesDifferentiating Commuters on Perceived Bike Safety & Transportation Attributes
Differentiating Commuters on Perceived Bike Safety & Transportation Attributes
 
Cycling safety in number
Cycling safety in numberCycling safety in number
Cycling safety in number
 
VolatileEndeavors-SmithVu
VolatileEndeavors-SmithVuVolatileEndeavors-SmithVu
VolatileEndeavors-SmithVu
 
Public Bicycle Share Programs and Their Impact on Cyclist-Involved Injury
Public Bicycle Share Programs and Their Impact on Cyclist-Involved InjuryPublic Bicycle Share Programs and Their Impact on Cyclist-Involved Injury
Public Bicycle Share Programs and Their Impact on Cyclist-Involved Injury
 
198 Presentation
198 Presentation198 Presentation
198 Presentation
 
ATS-16: Making Data Count, Miguel Figliozzi
ATS-16: Making Data Count, Miguel FigliozziATS-16: Making Data Count, Miguel Figliozzi
ATS-16: Making Data Count, Miguel Figliozzi
 
Cycling-as-an-active-mode-of-transport-literature-review-FINAL-28-July-2014
Cycling-as-an-active-mode-of-transport-literature-review-FINAL-28-July-2014Cycling-as-an-active-mode-of-transport-literature-review-FINAL-28-July-2014
Cycling-as-an-active-mode-of-transport-literature-review-FINAL-28-July-2014
 
Active transportation
Active transportationActive transportation
Active transportation
 
Awareness on Road Signs and Markings of Drivers and Passengers along Maharlik...
Awareness on Road Signs and Markings of Drivers and Passengers along Maharlik...Awareness on Road Signs and Markings of Drivers and Passengers along Maharlik...
Awareness on Road Signs and Markings of Drivers and Passengers along Maharlik...
 
N_Anderson Capstone Final Document_ word
N_Anderson Capstone Final Document_ wordN_Anderson Capstone Final Document_ word
N_Anderson Capstone Final Document_ word
 
Cost-Benefit Analysis of Greenways
Cost-Benefit Analysis of GreenwaysCost-Benefit Analysis of Greenways
Cost-Benefit Analysis of Greenways
 
Transportation Ecoefficiency: Quantitative Measurement of Urban Transportatio...
Transportation Ecoefficiency: Quantitative Measurement of Urban Transportatio...Transportation Ecoefficiency: Quantitative Measurement of Urban Transportatio...
Transportation Ecoefficiency: Quantitative Measurement of Urban Transportatio...
 
Manatee County APHA Power of Policy Application
Manatee County APHA Power of Policy ApplicationManatee County APHA Power of Policy Application
Manatee County APHA Power of Policy Application
 
Opportunities for soft mobility issues, walking and cycling in urban and subu...
Opportunities for soft mobility issues, walking and cycling in urban and subu...Opportunities for soft mobility issues, walking and cycling in urban and subu...
Opportunities for soft mobility issues, walking and cycling in urban and subu...
 
2013 Good To Go Impact Survey Report
2013 Good To Go Impact Survey Report2013 Good To Go Impact Survey Report
2013 Good To Go Impact Survey Report
 
Safe States Slide Master
Safe States Slide MasterSafe States Slide Master
Safe States Slide Master
 
Ward 30 bike reportv3
Ward 30 bike reportv3Ward 30 bike reportv3
Ward 30 bike reportv3
 
Austin Vision Zero
Austin Vision ZeroAustin Vision Zero
Austin Vision Zero
 
Quality of Life: Assessment for Transportation Performance Measures
Quality of Life: Assessment for Transportation Performance MeasuresQuality of Life: Assessment for Transportation Performance Measures
Quality of Life: Assessment for Transportation Performance Measures
 
MS Thesis- Professional Women Active Commuters- Apparel Design Criteria
MS Thesis- Professional Women Active Commuters- Apparel Design CriteriaMS Thesis- Professional Women Active Commuters- Apparel Design Criteria
MS Thesis- Professional Women Active Commuters- Apparel Design Criteria
 

More from University of Minnesota Tourism Center

The Benefits & Difficulties of Adopting Sustainable Practices Among the MN To...
The Benefits & Difficulties of Adopting Sustainable Practices Among the MN To...The Benefits & Difficulties of Adopting Sustainable Practices Among the MN To...
The Benefits & Difficulties of Adopting Sustainable Practices Among the MN To...University of Minnesota Tourism Center
 
TAPPING into Community Tourism Potential in Rural Minnesota's Communities
TAPPING into Community Tourism Potential in Rural Minnesota's Communities TAPPING into Community Tourism Potential in Rural Minnesota's Communities
TAPPING into Community Tourism Potential in Rural Minnesota's Communities University of Minnesota Tourism Center
 
Perceptions of Invasive Species & Their Control Among the MN Tourism Industry
Perceptions of Invasive Species & Their Control Among the MN Tourism IndustryPerceptions of Invasive Species & Their Control Among the MN Tourism Industry
Perceptions of Invasive Species & Their Control Among the MN Tourism IndustryUniversity of Minnesota Tourism Center
 
State of Sustainable Tourism: Assessing waste minimization practices among to...
State of Sustainable Tourism: Assessing waste minimization practices among to...State of Sustainable Tourism: Assessing waste minimization practices among to...
State of Sustainable Tourism: Assessing waste minimization practices among to...University of Minnesota Tourism Center
 
Are Tourism Businesses Using the Internet? An Initial Assessment of Digital P...
Are Tourism Businesses Using the Internet? An Initial Assessment of Digital P...Are Tourism Businesses Using the Internet? An Initial Assessment of Digital P...
Are Tourism Businesses Using the Internet? An Initial Assessment of Digital P...University of Minnesota Tourism Center
 
Waste, water, and energy benchmarking and conservation opportunities for Minn...
Waste, water, and energy benchmarking and conservation opportunities for Minn...Waste, water, and energy benchmarking and conservation opportunities for Minn...
Waste, water, and energy benchmarking and conservation opportunities for Minn...University of Minnesota Tourism Center
 
State of Sustainable Tourism in Minnesota 2013 Initial Assessment of Water an...
State of Sustainable Tourism in Minnesota 2013 Initial Assessment of Water an...State of Sustainable Tourism in Minnesota 2013 Initial Assessment of Water an...
State of Sustainable Tourism in Minnesota 2013 Initial Assessment of Water an...University of Minnesota Tourism Center
 
Nature as Impression for Dao: A Theory of Spiritual Tourism Development in Da...
Nature as Impression for Dao: A Theory of Spiritual Tourism Development in Da...Nature as Impression for Dao: A Theory of Spiritual Tourism Development in Da...
Nature as Impression for Dao: A Theory of Spiritual Tourism Development in Da...University of Minnesota Tourism Center
 

More from University of Minnesota Tourism Center (20)

Dr. Schneider MRCA Keynote
Dr. Schneider MRCA KeynoteDr. Schneider MRCA Keynote
Dr. Schneider MRCA Keynote
 
Seasonal Residents and Economic Development
Seasonal Residents and Economic DevelopmentSeasonal Residents and Economic Development
Seasonal Residents and Economic Development
 
Quality of life & opportunities to position parks & recreation
Quality of life & opportunities to position parks & recreationQuality of life & opportunities to position parks & recreation
Quality of life & opportunities to position parks & recreation
 
Minnesota Museums Help Communities Grow Factsheet
Minnesota Museums Help Communities Grow Factsheet Minnesota Museums Help Communities Grow Factsheet
Minnesota Museums Help Communities Grow Factsheet
 
Profiling Festivals & Events in Minnesota: Select Results
Profiling Festivals & Events in Minnesota: Select ResultsProfiling Festivals & Events in Minnesota: Select Results
Profiling Festivals & Events in Minnesota: Select Results
 
The Benefits & Difficulties of Adopting Sustainable Practices Among the MN To...
The Benefits & Difficulties of Adopting Sustainable Practices Among the MN To...The Benefits & Difficulties of Adopting Sustainable Practices Among the MN To...
The Benefits & Difficulties of Adopting Sustainable Practices Among the MN To...
 
TAPPING into Community Tourism Potential in Rural Minnesota's Communities
TAPPING into Community Tourism Potential in Rural Minnesota's Communities TAPPING into Community Tourism Potential in Rural Minnesota's Communities
TAPPING into Community Tourism Potential in Rural Minnesota's Communities
 
Ripple Effect Mapping of the Tourism Assessment Program
Ripple Effect Mapping of the Tourism Assessment ProgramRipple Effect Mapping of the Tourism Assessment Program
Ripple Effect Mapping of the Tourism Assessment Program
 
Emerald Ash Borer Interviews
Emerald Ash Borer InterviewsEmerald Ash Borer Interviews
Emerald Ash Borer Interviews
 
Emerald Ash Borer Interviews
Emerald Ash Borer Interviews Emerald Ash Borer Interviews
Emerald Ash Borer Interviews
 
Perceptions of Invasive Species & Their Control Among the MN Tourism Industry
Perceptions of Invasive Species & Their Control Among the MN Tourism IndustryPerceptions of Invasive Species & Their Control Among the MN Tourism Industry
Perceptions of Invasive Species & Their Control Among the MN Tourism Industry
 
State of Sustainable Tourism: Assessing waste minimization practices among to...
State of Sustainable Tourism: Assessing waste minimization practices among to...State of Sustainable Tourism: Assessing waste minimization practices among to...
State of Sustainable Tourism: Assessing waste minimization practices among to...
 
Welcome to the New Tradition: Where we are & Where we are heading to
Welcome to the New Tradition: Where we are & Where we are heading toWelcome to the New Tradition: Where we are & Where we are heading to
Welcome to the New Tradition: Where we are & Where we are heading to
 
Economic Impact of the 3M Championship Golf Tournament
Economic Impact of the 3M Championship Golf TournamentEconomic Impact of the 3M Championship Golf Tournament
Economic Impact of the 3M Championship Golf Tournament
 
Are Tourism Businesses Using the Internet? An Initial Assessment of Digital P...
Are Tourism Businesses Using the Internet? An Initial Assessment of Digital P...Are Tourism Businesses Using the Internet? An Initial Assessment of Digital P...
Are Tourism Businesses Using the Internet? An Initial Assessment of Digital P...
 
Chisago Lakes Area: Tourism Assessment Program Case Study 2008-2011
Chisago Lakes Area: Tourism Assessment Program Case Study 2008-2011Chisago Lakes Area: Tourism Assessment Program Case Study 2008-2011
Chisago Lakes Area: Tourism Assessment Program Case Study 2008-2011
 
Understanding & Aligning Transportation with Quality of Life
Understanding & Aligning Transportation with Quality of LifeUnderstanding & Aligning Transportation with Quality of Life
Understanding & Aligning Transportation with Quality of Life
 
Waste, water, and energy benchmarking and conservation opportunities for Minn...
Waste, water, and energy benchmarking and conservation opportunities for Minn...Waste, water, and energy benchmarking and conservation opportunities for Minn...
Waste, water, and energy benchmarking and conservation opportunities for Minn...
 
State of Sustainable Tourism in Minnesota 2013 Initial Assessment of Water an...
State of Sustainable Tourism in Minnesota 2013 Initial Assessment of Water an...State of Sustainable Tourism in Minnesota 2013 Initial Assessment of Water an...
State of Sustainable Tourism in Minnesota 2013 Initial Assessment of Water an...
 
Nature as Impression for Dao: A Theory of Spiritual Tourism Development in Da...
Nature as Impression for Dao: A Theory of Spiritual Tourism Development in Da...Nature as Impression for Dao: A Theory of Spiritual Tourism Development in Da...
Nature as Impression for Dao: A Theory of Spiritual Tourism Development in Da...
 

Perceived Bicycle Safety in Minnesota

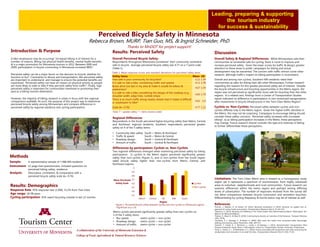
  • 1. Leading, preparing & supporting the tourism industry for success & sustainability A collaboration of the University of Minnesota Extension & College of Food, Agricultural & Natural Resource Sciences Perceived Bicycle Safety in Minnesota Rebecca Brown, MURP, Tian Guo, MS, & Ingrid Schneider, PhD Introduction & Purpose A bike renaissance may be occurring1. Increased biking is of interest for a number of reasons. Biking has physical health benefits, mental health benefits & is a major promotion for Minnesota tourism in 2012. Between 2000 and 2009, participation in bicycle commuting in Minnesota increased 88%2. Perceived safety can be a major factor on the decision to bicycle, whether for function or fun3. Constraints to leisure and transportation, like perceived safety, are important to understand and manage to ensure the potential benefits are maximized. Perceived safety can have an impact on physical activity as people are more likely to walk or bike if they perceive safety from traffic4. Finally, high perceived safety is important for communities interested in promoting their area as a biking tourism destination. However, the majority of biking research is urban in focus with few regional comparisons available. As such, the purpose of this project was to determine perceived bicycle safety among Minnesotans and compare differences in perceived safety by regional residence and cycling participation. Methods Sample: A representative sample of 7,488 MN residents Instrument: 12 page mail questionnaire, included questions on perceived biking safety, residence Analysis: Descriptive, correlation, & comparative with a perceived bicycle safety scale ( = 0.76) Results: Perceived Safety Overall Perceived Bicycle Safety: Respondents throughout Minnesota considered their community somewhat safe to bicycle. Average perceived bicycle safety was 4.77 on a 7 point scale (Table 1). Regional Differences Respondents in the South perceived higher bicycling safety than Metro, Central, and Northeast regional residents. Southern respondents perceived greater safety on 4 of the 5 safety items: •• Community bike safety: South > Metro & Northeast •• Traffic & speed: South > Metro & Central •• Roadway design: South > Central & Northeast •• Amount of traffic: South > Central & Northeast Discussion Overall Safety & Regional Differences: While Minnesotans rate their communities as somewhat safe for cycling, there is room to improve and increase perceived safety. Given the lower scores for traffic & design, greater attention to these areas in public campaigns for biking and actual development may be warranted. The concern with traffic mirrors some other research, although traffic’’s impact on biking participation is inconsistent, Overall and among non-cyclists, Southern MN residents rated their communities as safer for biking than did other Minnesotans. Further research regarding the reasons for this greater perceived safety are of interest. Despite the bicycle infrastructure and bicycling opportunities in the Metro region, the region was not perceived as significantly more safe for bicycling than the other regions. In a related vein, findings from a Center of Transportation Studies report indicated no difference in participation in non-motorized transportation after investments in bicycle infrastructure in the Twin Cities Metro Region5. Cyclists vs. Non-Cyclists: Perceived safety between cyclists and non- cyclists differed only in the Metro region. Given the higher traffic densities in the Metro, this may not be surprising. Campaigns to encourage biking should consider these safety concerns. Perceived safety increases with increased biking6, so as biking participation increases in the Metro, these perceptions may change. Future research should consider the type and intensity of biking to further differentiate these perceptions. Figure 1: Perceived bicycle safety between cyclists and non-cyclists in Minnesota regions. *Significant at p<.05 Safety items Mean SD How safe is your community for bicyclists? 5.11 1.59 It is safe to ride a bike, considering traffic and speeds 4.71 1.78 Buses drive too fast in my area & make it unsafe for bikers & pedestrians* 4.67 1.59 It is safe to ride a bike considering the design of the roadway (e.g. shoulder width, edge lines, rumble strips) 4.63 1.79 There is so much traffic along nearby streets that it makes it difficult or unpleasant to bike* 4.62 1.9 Scale ( = 0.76) 4.77 1.23 Differences by participation: Cyclists vs. Non-Cyclists Two regional differences emerged when examining perceived safety by biking participation: 1) cyclists in the Metro region perceived significantly greater safety than non-cyclists (Figure 1), and 2) non-cyclists from the South region rated bicycle safety higher than non-cyclists from Metro, Central, and Northeast regions. Table 1: Mean response scores and standard deviations for perceived safety items References 1Pucher, J., Buehler, R., & Seinen, M. (2011). Bicycling renaissance in North America? an update and re- appraisal of cycling trends and policies. Transportation Research Part A, 45, 451-475. 2Swanson, K. (2012). Bicycling and Walking in the United States 2012 Benchmarking Report. Washington, DC: Alliance for Biking & Walking. 3Heinen, E., Maat, K., & Wee, B. (2010). Commuting by bicycle: an overview of the literature. Transport Reviews, 30(1), 59-96. 4Jacobsen, P. L., Racioppi, F., & Rutter, H. (2009). Who owns the roads? How motorised traffic discourages walking and bicycling. Injury Prevention, 15(6), 369-373. 5Gotschi, T., Krizek, K. J., McGinnis, L., Lucke, J., & Barbeau, J. (2011). Nonmotorized Transportation Pilot Program Evaluation Study, Phase 2. Minneapolis: Center for Transportation Studies, University of Minnesota. 6Xing, Y., Handy, S. L., & Mokhtarian, P. L. (2010). Factors associated with proportions and miles of bicycling for transportation and recreation in six small US cities. Transportation Research Part D, 15(2), 73-81. Results: Demographics Response Rate: 45% response rate (3,308); 53.2% from Twin Cites Age range: 18-98 years Cycling participation: 45% report bicycling outside in last 12 months Limitations: The Twin Cities Metro area is treated as a homogenous study region yet it represents a spectrum of environments, from highly urbanized areas to suburban neighborhoods and rural communities. Future research can examine differences within the metro region and perhaps among differing levels of urbanization. The number of responses received from the survey did not allow comparisons between bicycle commuters and recreation bicyclists. Differentiating by cycling frequency & tourist status may be of interest as well. EMT EMT EMT EMT 4.3 4.4 4.5 4.6 4.7 4.8 4.9 5 Metro* Central NE NW South Mean Perceived Safety Scale Region Cyclists Non-cyclists Metro cyclists perceived significantly greater safety than non-cyclists on 3 of the 5 safety items: •• Bus speed: metro cyclist > non cyclist •• Roadway design: metro cyclist > non cyclist •• Amount of traffic: metro cyclist > non cyclist Note: 7 = greater safety; * = items reverse coded Thanks to MnDOT for project support!