1. 1 OnLine Testing: Semester 1
This year, in MAT1CNS, MAT1CPE and MAT1CFE, we introduced a set of 4 online tests called Survival
Skills Tests. The aim of the tests was to aid students in the transition to university mathematics by getting
them to review material from secondary college.
The tests were implemented on the Pearson Education MyMathTest website.
This interface was selected for a number of reasons:
• the interface is algebraic,
• it permits programming of customized problems using randomized constants,
• it permits randomization/pooling of questions,
• it has extensive record keeping and reviewing capabilities,
• it is available to students 24 hours a day,
• it has been used in the US for many years and is very stable,
• it is cheap!
The rˆole of the tests is to provide student with a self-diagnostic tool to help them identify knowledge
gaps and self remediate with the help of our Survival Skills text &/or VCE texts.
There are four tests that:
• are done sequentially,
• are each repeated until mastery (80%) is achieved,
• can be done by the students at any time and (the carrot)
• provide the students with a full 10% of their assessment upon successful completion of all four.
1.1 What the Student Sees
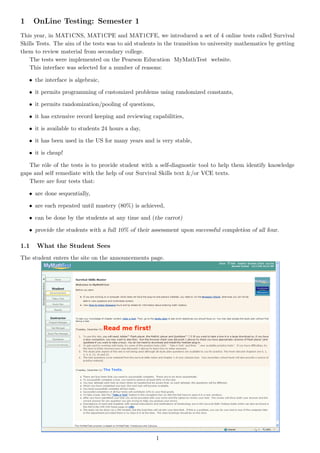
The student enters the site on the announcements page.
1
2. Clicking the take a test link opens a page with the available tests. These tests can be scheduled with
start and finish date/times and also prerequisites. Flagged tests have prerequisites that are not yet met and
cannot be accessed.
Clicking on a test takes the student to a confirmation page:
Clicking “I am ready to start” opens the test.
Note that the test has a configurable symbol palette for each question. The student can use the palette
or standard keyboard sequences to enter their answer (lower frame-right). The tests had a time limit of 45
minutes and the time remaining can be displayed.
2
3. The current question is highlighted in yellow and completed/attempted questions are highlighted in
green. Questions may be done in any order and may be reviewed and altered before submission.
The answer in the next frame is deliberately wrong!
We will do one more question and then submit the test.
3
4. Once submitted, the students receive immediate feedback on their performance. Note that (x) indicates
a question for which no marks were scored because it wasn’t attempted. Also note that questions may be
assigned any (positive) integer mark and that, in questions with multiple parts, the system can be set to
award proportional partial marks.
The student can then review their test.
4
5. By selecting questions they got wrong, the student can hold the mouse arrow over the answer and
compare their answer to the correct one to help them determine the nature of the error..
5
6. 1.2 What the Instructor Sees
The instructor has access to an array of tools. They can create announcements and tests using a substantial
online bank of questions or by writing their own questions using a web-based interface. These aspects are
not relevant to this report and so will not be covered here. We will restrict ourselves to the record keeping
and tools associated with the gradebook.
At the first level, the gradebook provides an overview of the best result on each test for each student
together with data on the number of students who have attempted a test and the class average and median.
(Of course, in the following view, the names of students have been omitted.)
6
7. 2 The Happy Ending?
3 Analysis...
The units involved covered the same topics using the same materials and taken by the same staff in both
2008 and 2009, so this presented a unique opportunity to make a comparison and find the benefit of the
only change in delivery. As there was a change in the non-exam assessment, it was decided to consider only
the effect on exam results.
We could make a comparison of the exam results distribution,
2008 Distribution
2009 Distribution
7
8. but this would be subjective,so we won’t.
Using the Maths Methods scores (as a percentage of total) as a baseline measure and the exam mark
(as a percentage of total) we get the following results:
Year No of Exam Methods Difference
students Average Average
2008 145 54.4 57.4 −3
2009 100 66.4 62.4 4
which appear significant.
3.1 Epilogue
203 students were asked to respond (Always=5 Usually=4 Sometimes=3 Rarely=2 Never=1 ) to the following
questions:
1. The tests helped me to find the skills that I needed to practice.
Mean 4.22 Standard deviation 0.94
2. The tests improved my mathematical competency.
Mean 4.03 Standard deviation 1.02
3. The level of difficulty of the tests was appropriate.
Mean 3.99 Standard deviation 0.89
4. 45minutes was sufficient time to work through each test.
Mean 4.36 Standard deviation 0.94
5. I would prefer to do the tests before semester begins.
Mean 2.92 Standard deviation 1.49
The most common positive comments related to the opportunity to practice skills and improve compe-
tency as well as the ability to do the tests at flexible times.
The most common negative comments related to issues of syntax and (the perception) that some correct
answers were marked as incorrect.
8