SlideShare a Scribd company logo
1 of 10
Table 1 shows the tally table for the different colours
                  of cars in UBD
 Colours                                                                  Tally Marks                                                                Total
                                                                                                                                                    Amount
  Black    IIII IIII IIII IIII IIII IIII IIII IIII IIII IIII IIII IIII IIII IIII IIII IIII IIII IIII IIII IIII IIII IIII IIII                         114

  White    IIII IIII IIII IIII IIII IIII IIII IIII IIII IIII IIII IIII IIII IIII IIII IIII IIII IIII IIII IIII IIII IIII IIII IIII IIII II           127

  Silver   IIII IIII IIII IIII IIII IIII IIII IIII IIII IIII IIII IIII IIII IIII IIII IIII IIII IIII IIII IIII IIII IIII IIII IIII IIII IIII IIII    135
  Red      IIII IIII IIII IIII IIII IIII IIII IIII IIII IIII I                                                                                        51
  Blue     IIII IIII IIII IIII IIII IIII IIII IIII                                                                                                    40
 Green     IIII IIII IIII IIII IIII I                                                                                                                 26
 Brown     IIII IIII IIII IIII IIII                                                                                                                   24
 Orange    IIII IIII I                                                                                                                                11
 Yellow    IIII III                                                                                                                                   8
 Purple    III                                                                                                                                        3
  Pink     II                                                                                                                                         2
Table 2 shows the tally table for different brands of cars
                         in UBD
                                                                     Tally Marks                                           Total Amount
     Brands
      Toyota      IIII IIII IIII IIII IIII IIII IIII IIII IIII IIII IIII IIII IIII IIII IIII IIII IIII IIII IIII IIII II       102
      Suzuki      IIII IIII IIII IIII IIII IIII IIII IIII IIII IIII IIII                                                       55
    Mitsubishi    IIII IIII IIII IIII IIII IIII IIII IIII                                                                      40
      Mazda       IIII IIII IIII IIII IIII IIII IIII IIII                                                                      39
      Nissan      IIII IIII IIII IIII IIII IIII IIII IIII IIII IIII IIII IIII IIII                                             64
    Volkswagen    IIII IIII II                                                                                                 12
     Mercedez     IIII IIII                                                                                                    10
      BMW         IIII III                                                                                                     8
     Daihatsu     IIII IIII IIII IIII IIII IIII IIII IIII II                                                                   42
    Mini Copper   IIII                                                                                                         4
       Ford       IIII IIII IIII                                                                                               15
      Subaru      IIII IIII II                                                                                                 12
     Renault      IIII                                                                                                         4
      Volvo       IIII                                                                                                         5
      Dodge                                                                                                                    0
        Kia       IIII IIII IIII IIII IIII IIII I                                                                              31
     Hyundai      IIII IIII IIII IIII IIII                                                                                     24
    Landrover     IIII IIII II                                                                                                 12
      Honda       IIII IIII IIII IIII                                                                                          19
     Peugeot      IIII IIII IIII                                                                                               14
     Chevrolet    IIII IIII II                                                                                                 12
      Proton      IIII III                                                                                                     8
      Lexus       IIII IIII                                                                                                    9
QUESTIONNAIRES’ GRAPHS AND
          CHARTS
 A total of 150 questionnaires were given out among the UBDians. 87 out of
150 are male participants and the rest (63) are female participants. The age
                            range is shown below:


                          9%
                                    26%
                                                       Below 19
                                                       20-23
                                                       Above 23
                      65%
We also want to find out whether they own driving licenses or not that are
included in the questionnaires. Out of 150 participants, 133 own driving licenses
 while 17 participants still do not own driving licenses. In addition, the bar graph
      below shows how many of the total UBDians are driving to school by
        themselves, being sent by their parents and others; such as using
                 buses, motorcycles or walking (hostel students)

  140
  120
             123
  100
   80                                                        Drive by
                                                             yourself
   60                                                        Sent by your
   40                                                        parents
                                                             Others
   20
                             22              5
    0
           Drive by     Sent by your      Others
           yourself       parents
Next we want to find out where UBDians usually park. The results
                        are shown below:
45

40
                                       40
35

30                               32
                                                    Chancellor Hall
25                                                  FASS
                  23                                FBEPS
20
                                                    FOS
15                        17                        SC
                                                    ICTC
10                                          11
 5
         0
 0
     Chancellor   FASS   FBEPS   FOS   SC   ICTC
       Hall
Lastly, we want to find out what they think about the car-parks in
UBD. Are they safe? Are they convenient? Are the parking spaces
enough? The results to the questions are shown on the bar graph
                               below:
70

60

50

40                                                          Convenient
                                                            Too far from my Faculty
30                                                          Not enough space
                                                            Insecure
20
                                                            Others
10

 0
     Convenient Too far from Not enough Insecure   Others
                my Faculty     space

More Related Content

Viewers also liked

Estrategias para el desarrollo de formacion en ambientes virtuales de aprend...
Estrategias para el desarrollo  de formacion en ambientes virtuales de aprend...Estrategias para el desarrollo  de formacion en ambientes virtuales de aprend...
Estrategias para el desarrollo de formacion en ambientes virtuales de aprend...
Lina Rios
 
Estrategias para el desarrollo de formacion en ambientes virtuales de aprend...
Estrategias para el desarrollo  de formacion en ambientes virtuales de aprend...Estrategias para el desarrollo  de formacion en ambientes virtuales de aprend...
Estrategias para el desarrollo de formacion en ambientes virtuales de aprend...
Lina Rios
 

Viewers also liked (14)

Leveraging Drupal, Alfresco and CMIS
Leveraging Drupal, Alfresco and CMISLeveraging Drupal, Alfresco and CMIS
Leveraging Drupal, Alfresco and CMIS
 
Artvaark show and-tell may 2014
Artvaark show and-tell may 2014Artvaark show and-tell may 2014
Artvaark show and-tell may 2014
 
Ayam2
Ayam2Ayam2
Ayam2
 
Introduction
IntroductionIntroduction
Introduction
 
Ayam2
Ayam2Ayam2
Ayam2
 
Arts techcymru
Arts techcymruArts techcymru
Arts techcymru
 
Findings
FindingsFindings
Findings
 
Our story
Our storyOur story
Our story
 
3T Questionnaire
3T Questionnaire3T Questionnaire
3T Questionnaire
 
AMA Mobile Pop-up
AMA Mobile Pop-upAMA Mobile Pop-up
AMA Mobile Pop-up
 
Cars1
Cars1Cars1
Cars1
 
Estrategias para el desarrollo de formacion en ambientes virtuales de aprend...
Estrategias para el desarrollo  de formacion en ambientes virtuales de aprend...Estrategias para el desarrollo  de formacion en ambientes virtuales de aprend...
Estrategias para el desarrollo de formacion en ambientes virtuales de aprend...
 
Estrategias para el desarrollo de formacion en ambientes virtuales de aprend...
Estrategias para el desarrollo  de formacion en ambientes virtuales de aprend...Estrategias para el desarrollo  de formacion en ambientes virtuales de aprend...
Estrategias para el desarrollo de formacion en ambientes virtuales de aprend...
 
Lancering vostok 6
Lancering vostok 6Lancering vostok 6
Lancering vostok 6
 

More from triplethreat (9)

Lovechem
LovechemLovechem
Lovechem
 
Recommendations
RecommendationsRecommendations
Recommendations
 
Objectives
ObjectivesObjectives
Objectives
 
Cars1
Cars1Cars1
Cars1
 
Cars1
Cars1Cars1
Cars1
 
Conclusion
ConclusionConclusion
Conclusion
 
Analyze
AnalyzeAnalyze
Analyze
 
Questionnaire
QuestionnaireQuestionnaire
Questionnaire
 
Ayam2
Ayam2Ayam2
Ayam2
 

Analyze

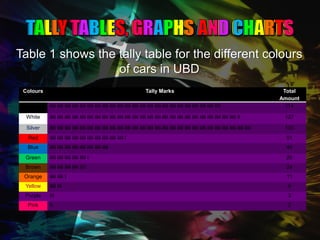
  • 1. Table 1 shows the tally table for the different colours of cars in UBD Colours Tally Marks Total Amount Black IIII IIII IIII IIII IIII IIII IIII IIII IIII IIII IIII IIII IIII IIII IIII IIII IIII IIII IIII IIII IIII IIII IIII 114 White IIII IIII IIII IIII IIII IIII IIII IIII IIII IIII IIII IIII IIII IIII IIII IIII IIII IIII IIII IIII IIII IIII IIII IIII IIII II 127 Silver IIII IIII IIII IIII IIII IIII IIII IIII IIII IIII IIII IIII IIII IIII IIII IIII IIII IIII IIII IIII IIII IIII IIII IIII IIII IIII IIII 135 Red IIII IIII IIII IIII IIII IIII IIII IIII IIII IIII I 51 Blue IIII IIII IIII IIII IIII IIII IIII IIII 40 Green IIII IIII IIII IIII IIII I 26 Brown IIII IIII IIII IIII IIII 24 Orange IIII IIII I 11 Yellow IIII III 8 Purple III 3 Pink II 2
  • 2. Table 2 shows the tally table for different brands of cars in UBD Tally Marks Total Amount Brands Toyota IIII IIII IIII IIII IIII IIII IIII IIII IIII IIII IIII IIII IIII IIII IIII IIII IIII IIII IIII IIII II 102 Suzuki IIII IIII IIII IIII IIII IIII IIII IIII IIII IIII IIII 55 Mitsubishi IIII IIII IIII IIII IIII IIII IIII IIII 40 Mazda IIII IIII IIII IIII IIII IIII IIII IIII 39 Nissan IIII IIII IIII IIII IIII IIII IIII IIII IIII IIII IIII IIII IIII 64 Volkswagen IIII IIII II 12 Mercedez IIII IIII 10 BMW IIII III 8 Daihatsu IIII IIII IIII IIII IIII IIII IIII IIII II 42 Mini Copper IIII 4 Ford IIII IIII IIII 15 Subaru IIII IIII II 12 Renault IIII 4 Volvo IIII 5 Dodge 0 Kia IIII IIII IIII IIII IIII IIII I 31 Hyundai IIII IIII IIII IIII IIII 24 Landrover IIII IIII II 12 Honda IIII IIII IIII IIII 19 Peugeot IIII IIII IIII 14 Chevrolet IIII IIII II 12 Proton IIII III 8 Lexus IIII IIII 9
  • 3.
  • 4.
  • 5.
  • 6.
  • 7. QUESTIONNAIRES’ GRAPHS AND CHARTS A total of 150 questionnaires were given out among the UBDians. 87 out of 150 are male participants and the rest (63) are female participants. The age range is shown below: 9% 26% Below 19 20-23 Above 23 65%
  • 8. We also want to find out whether they own driving licenses or not that are included in the questionnaires. Out of 150 participants, 133 own driving licenses while 17 participants still do not own driving licenses. In addition, the bar graph below shows how many of the total UBDians are driving to school by themselves, being sent by their parents and others; such as using buses, motorcycles or walking (hostel students) 140 120 123 100 80 Drive by yourself 60 Sent by your 40 parents Others 20 22 5 0 Drive by Sent by your Others yourself parents
  • 9. Next we want to find out where UBDians usually park. The results are shown below: 45 40 40 35 30 32 Chancellor Hall 25 FASS 23 FBEPS 20 FOS 15 17 SC ICTC 10 11 5 0 0 Chancellor FASS FBEPS FOS SC ICTC Hall
  • 10. Lastly, we want to find out what they think about the car-parks in UBD. Are they safe? Are they convenient? Are the parking spaces enough? The results to the questions are shown on the bar graph below: 70 60 50 40 Convenient Too far from my Faculty 30 Not enough space Insecure 20 Others 10 0 Convenient Too far from Not enough Insecure Others my Faculty space