
Recommended
More Related Content
What's hot
What's hot (20)
Viewers also liked
Similar to Greensboro Housing Report 2010.1
Similar to Greensboro Housing Report 2010.1 (19)
Recently uploaded
Recently uploaded (20)
Greensboro Housing Report 2010.1
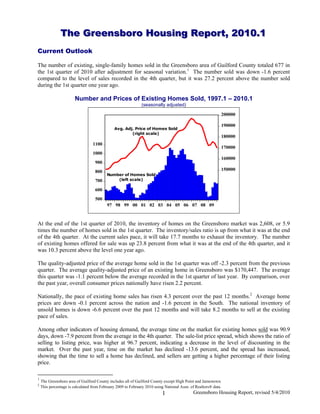
- 1. The Greensboro Housing Report, 2010.1 The Greensboro Housing Report, 2010.1 Current Outlook The number of existing, single-family homes sold in the Greensboro area of Guilford County totaled 677 in the 1st quarter of 2010 after adjustment for seasonal variation.1 The number sold was down -1.6 percent compared to the level of sales recorded in the 4th quarter, but it was 27.2 percent above the number sold during the 1st quarter one year ago. Number and Prices of Existing Homes Sold, 1997.1 – 2010.1 (seasonally adjusted) 200000 190000 Avg. Adj. Price of Homes Sold (right scale) 180000 1100 170000 1000 160000 900 800 150000 Number of Homes Sold 700 (left scale) 600 500 97 98 99 00 01 02 03 04 05 06 07 08 09 At the end of the 1st quarter of 2010, the inventory of homes on the Greensboro market was 2,608, or 5.9 times the number of homes sold in the 1st quarter. The inventory/sales ratio is up from what it was at the end of the 4th quarter. At the current sales pace, it will take 17.7 months to exhaust the inventory. The number of existing homes offered for sale was up 23.8 percent from what it was at the end of the 4th quarter, and it was 10.3 percent above the level one year ago. The quality-adjusted price of the average home sold in the 1st quarter was off -2.3 percent from the previous quarter. The average quality-adjusted price of an existing home in Greensboro was $170,447. The average this quarter was -1.1 percent below the average recorded in the 1st quarter of last year. By comparison, over the past year, overall consumer prices nationally have risen 2.2 percent. Nationally, the pace of existing home sales has risen 4.3 percent over the past 12 months.2 Average home prices are down -0.1 percent across the nation and -1.6 percent in the South. The national inventory of unsold homes is down -6.6 percent over the past 12 months and will take 8.2 months to sell at the existing pace of sales. Among other indicators of housing demand, the average time on the market for existing homes sold was 90.9 days, down -7.9 percent from the average in the 4th quarter. The sale-list price spread, which shows the ratio of selling to listing price, was higher at 96.7 percent, indicating a decrease in the level of discounting in the market. Over the past year, time on the market has declined -13.6 percent, and the spread has increased, showing that the time to sell a home has declined, and sellers are getting a higher percentage of their listing price. 1 The Greensboro area of Guilford County includes all of Guilford County except High Point and Jamestown. 2 This percentage is calculated from February 2009 to February 2010 using National Assn. of Realtors® data. 1 Greensboro Housing Report, revised 5/4/2010
- 2. Time on the market (TOM) is higher for the highest priced homes (see the bar graph shown directly below). Existing Homes, 1997.1 – 2010.1 Time on the Market by Price Category (seasonally adjusted) (in days) 98 250 96 195.4 200 Spread 94 (selling price/listing price) (right scale) 92 150 135.6 120 90 106.1 110 94.6 88 100 80.8 100 90 50 Time on the Market 80 (left scale) 0 70 < $75K $75K - $150K - $300K - $500K & 97 98 99 00 01 02 03 04 05 06 07 08 09 $149K $299K $499K Over Housing affordability is an important factor shaping housing demand. The affordability index gained 1.1 percent this quarter. Since the 1st quarter of 2009, the affordability index has risen 2.8 percent because of lower mortgage rates and housing prices. Existing Home Sales Data % Chg % Chg 2010.1 2009.4 2009.1 Last Qtr. Last Yr. Seasonally Adjusted Adj. Avg. Home Price $170,447 $174,431 $172,405 -2.3% -1.1% No. of Homes Sold 677 688 533 -1.6% 27.2% Time on Market (days) 90.9 98.6 105.1 -7.9% -13.6% Spread: (sale price/list price) 96.7 95.5 89.1 1.2% 8.5% Consumer Price Index (CPI-U) 216.7 216.2 212.0 0.3% 2.2% Not Seasonally Adjusted Avg. Home Price $173,479 $197,122 $181,988 -12.0% -4.7% No. of Homes Sold 440 629 416 -30.0% 5.8% < $75K 102 75 66 36.0% 54.5% $75K - $149K 151 223 146 -32.3% 3.4% $150K - $299K 130 231 140 -43.7% -7.1% $300K - $499K 37 71 49 -47.9% -24.5% $500K & Over 20 29 15 -31.0% 33.3% Inventory, end of qtr. 2,608 2,107 2,364 23.8% 10.3% Inventory/Sales 5.9 3.3 5.7 76.9% 4.3% Affordability Index 113.7 112.5 110.6 1.1% 2.8% 2 Greensboro Housing Report, revised 5/4/2010
- 3. The Neighborhood Distribution of Existing Home Sales During the 1st quarter, the largest number of sales of existing homes occurred in zip code 27406. This neighborhood in southeast Greensboro had a total of 65 sales. It was followed by zip code 27408, which encompasses the Irving Park area in the northern section of the city, with a total of 61 sales. The highest average price of homes sold was recorded in zip code 27284 (located on the western edge of the county subsuming Kernersville) where 4 sales averaging $460,693 were recorded. It was followed by the Summerfield area (zip 27358) with 18 sales averaging $355,044. The highest inventory to sales ratio was in zip code 27357 (the Stokesdale area northwest of the city), with a ratio of 32.3 mos. It was followed by zip codes 27233 (encompassing the Climax area south of the city) with a ratio of 30.0 months. The lowest ratio was in zip code 27313 (south of the city including Pleasant Garden) where at the existing pace of sales it will take 7.8 months to sell the listing in this area. The Neighborhood Distribution of Existing Home Sales, 2010.1 No. Avg. Inventory Zip Price Range Sales Price Spread TOM End of Qtr. Inv./Sales 27214 < $75K 0 n.a. n.a. n.a. 2 n.a. 27214 $75K - $149K 9 $114,433 99.0 77.8 18 2.0 27214 $150K - $299K 8 $241,731 95.9 216.0 42 5.3 27214 $300K - $499K 1 $335,000 97.1 129.0 30 30.0 27214 $500K & Over 0 n.a. n.a. n.a. 4 n.a. 27214 Total 18 $183,264 97.5 142.1 96 5.3 27215 < $75K 0 n.a. n.a. n.a. n.a. n.a. 27215 $75K - $149K 0 n.a. n.a. n.a. 2 n.a. 27215 $150K - $299K 1 $175,000 97.3 92.0 4 4.0 27215 $300K - $499K 0 n.a. n.a. n.a. 1 n.a. 27215 $500K & Over 0 n.a. n.a. n.a. 2 n.a. 27215 Total 1 $175,000 97.3 92.0 9 9.0 27233 < $75K 1 $53,000 88.5 176.0 n.a. n.a. 27233 $75K - $149K 0 n.a. n.a. n.a. 5 n.a. 27233 $150K - $299K 0 n.a. n.a. n.a. 3 n.a. 27233 $300K - $499K 0 n.a. n.a. n.a. 2 n.a. 27233 $500K & Over 0 n.a. n.a. n.a. n.a. n.a. 27233 Total 1 $53,000 88.5 176.0 10 10.0 27235 < $75K 0 n.a. n.a. n.a. n.a. n.a. 27235 $75K - $149K 0 n.a. n.a. n.a. 1 n.a. 27235 $150K - $299K 3 $214,457 99.1 221.0 14 4.7 27235 $300K - $499K 1 $332,000 96.3 144.0 12 12.0 27235 $500K & Over 0 n.a. n.a. n.a. 4 n.a. 27235 Total 4 $243,843 98.4 201.8 31 7.8 27249 < $75K 3 $26,133 93.1 67.0 3 1.0 27249 $75K - $149K 3 $120,167 98.2 31.7 10 3.3 27249 $150K - $299K 0 n.a. n.a. n.a. 15 n.a. 27249 $300K - $499K 0 n.a. n.a. n.a. 4 n.a. 27249 $500K & Over 0 n.a. n.a. n.a. 1 n.a. 27249 Total 6 $73,150 95.6 49.3 33 5.5 27263 < $75K 0 n.a. n.a. n.a. n.a. n.a. 27263 $75K - $149K 2 $130,000 92.5 200.0 3 1.5 27263 $150K - $299K 0 n.a. n.a. n.a. 3 n.a. 27263 $300K - $499K 0 n.a. n.a. n.a. n.a. n.a. 27263 $500K & Over 0 n.a. n.a. n.a. n.a. n.a. 27263 Total 2 $130,000 92.5 200.0 6 3.0 3 Greensboro Housing Report, revised 5/4/2010
- 4. The Neighborhood Distribution of Existing Home Sales, continued No. Avg. Inventory Zip Price Range Sales Price Spread TOM End of Qtr. Inv./Sales 27283 < $75K 0 n.a. n.a. n.a. 1 n.a. 27283 $75K - $149K 2 $93,200 103.4 98.0 4 2.0 27283 $150K - $299K 0 n.a. n.a. n.a. 2 n.a. 27283 $300K - $499K 0 n.a. n.a. n.a. 10 n.a. 27283 $500K & Over 0 n.a. n.a. n.a. n.a. n.a. 27283 Total 2 $93,200 103.4 98.0 17 8.5 27284 < $75K 0 n.a. n.a. n.a. n.a. n.a. 27284 $75K - $149K 0 n.a. n.a. n.a. 1 n.a. 27284 $150K - $299K 1 $232,800 100.4 61.0 2 2.0 27284 $300K - $499K 1 $350,000 97.4 394.0 12 12.0 27284 $500K & Over 2 $629,985 93.9 178.0 10 5.0 27284 Total 4 $460,693 96.4 202.8 25 6.3 27301 < $75K 0 n.a. n.a. n.a. n.a. n.a. 27301 $75K - $149K 5 $127,580 98.9 71.4 19 3.8 27301 $150K - $299K 5 $200,180 92.2 151.8 48 9.6 27301 $300K - $499K 0 n.a. n.a. n.a. 4 n.a. 27301 $500K & Over 0 n.a. n.a. n.a. n.a. n.a. 27301 Total 10 $163,880 95.6 111.6 71 7.1 27310 < $75K 0 n.a. n.a. n.a. n.a. n.a. 27310 $75K - $149K 1 $117,500 98.0 6.0 n.a. n.a. 27310 $150K - $299K 4 $193,875 95.1 46.8 19 4.8 27310 $300K - $499K 4 $365,625 99.0 83.8 41 10.3 27310 $500K & Over 3 $524,333 95.8 190.7 30 10.0 27310 Total 12 $327,375 96.8 91.7 90 7.5 27313 < $75K 0 n.a. n.a. n.a. n.a. n.a. 27313 $75K - $149K 4 $106,375 99.1 113.5 4 1.0 27313 $150K - $299K 1 $191,000 83.1 48.0 6 6.0 27313 $300K - $499K 0 n.a. n.a. n.a. 2 n.a. 27313 $500K & Over 0 n.a. n.a. n.a. 1 n.a. 27313 Total 5 $123,300 95.9 100.4 13 2.6 27357 < $75K 0 n.a. n.a. n.a. n.a. n.a. 27357 $75K - $149K 1 $104,200 103.2 1.0 5 5.0 27357 $150K - $299K 2 $265,500 98.4 73.5 17 8.5 27357 $300K - $499K 0 n.a. n.a. n.a. 14 n.a. 27357 $500K & Over 1 $576,500 87.4 161.0 7 7.0 27357 Total 4 $302,925 96.9 77.3 43 10.8 27358 < $75K 1 $50,000 58.9 50.0 n.a. n.a. 27358 $75K - $149K 1 $90,000 85.8 136.0 2 2.0 27358 $150K - $299K 6 $255,067 96.5 116.0 21 3.5 27358 $300K - $499K 8 $391,738 95.3 122.0 60 7.5 27358 $500K & Over 2 $793,250 89.9 194.5 62 31.0 27358 Total 18 $355,044 92.5 124.8 145 8.1 27377 < $75K 1 $57,500 96.0 120.0 n.a. n.a. 27377 $75K - $149K 2 $126,915 95.6 81.5 5 2.5 27377 $150K - $299K 4 $198,875 98.1 63.0 26 6.5 27377 $300K - $499K 3 $407,533 88.6 292.3 14 4.7 27377 $500K & Over 0 n.a. n.a. n.a. 5 n.a. 27377 Total 10 $232,943 94.5 141.2 50 5.0 27401 < $75K 16 $29,722 85.9 65.6 44 2.8 27401 $75K - $149K 5 $125,701 95.1 202.0 24 4.8 27401 $150K - $299K 1 $166,000 94.9 80.0 17 17.0 27401 $300K - $499K 1 $304,000 101.7 21.0 7 7.0 27401 $500K & Over 0 n.a. n.a. n.a. 2 n.a. 4 Greensboro Housing Report, revised 5/4/2010
- 5. 27401 Total 23 $68,437 89.0 93.9 94 4.1 The Neighborhood Distribution of Existing Home Sales, continued No. Avg. Inventory Zip Price Range Sales Price Spread TOM End of Qtr. Inv./Sales 27403 < $75K 12 $45,275 93.9 62.1 38 3.2 27403 $75K - $149K 3 $105,167 92.8 31.3 41 13.7 27403 $150K - $299K 7 $203,929 97.0 74.0 40 5.7 27403 $300K - $499K 0 n.a. n.a. n.a. 17 n.a. 27403 $500K & Over 0 n.a. n.a. n.a. n.a. n.a. 27403 Total 22 $103,923 94.7 61.7 136 6.2 27405 < $75K 31 $34,986 93.8 77.8 77 2.5 27405 $75K - $149K 25 $108,769 97.2 97.4 164 6.6 27405 $150K - $299K 3 $160,663 96.4 261.3 44 14.7 27405 $300K - $499K 0 n.a. n.a. n.a. 4 n.a. 27405 $500K & Over 0 n.a. n.a. n.a. 1 n.a. 27405 Total 59 $72,640 95.4 95.5 290 4.9 27406 < $75K 22 $42,336 91.8 86.4 61 2.8 27406 $75K - $149K 28 $110,976 96.0 77.4 119 4.3 27406 $150K - $299K 15 $215,702 96.8 67.1 92 6.1 27406 $300K - $499K 0 n.a. n.a. n.a. 17 n.a. 27406 $500K & Over 0 n.a. n.a. n.a. 2 n.a. 27406 Total 65 $111,912 94.7 78.0 291 4.5 27407 < $75K 9 $47,933 89.9 139.7 33 3.7 27407 $75K - $149K 18 $122,439 97.1 132.7 111 6.2 27407 $150K - $299K 9 $175,711 97.1 88.0 73 8.1 27407 $300K - $499K 4 $356,598 93.1 76.8 34 8.5 27407 $500K & Over 0 n.a. n.a. n.a. 32 n.a. 27407 Total 40 $141,077 95.1 118.6 283 7.1 27408 < $75K 2 $62,000 91.2 80.5 n.a. n.a. 27408 $75K - $149K 16 $118,019 96.4 84.1 46 2.9 27408 $150K - $299K 10 $189,690 95.5 85.9 60 6.0 27408 $300K - $499K 5 $344,390 94.2 108.4 21 4.2 27408 $500K & Over 8 $885,625 88.5 227.9 58 7.3 27408 Total 61 $241,945 97.5 122.0 275 4.5 27409 < $75K 0 n.a. n.a. n.a. 2 n.a. 27409 $75K - $149K 4 $129,000 96.0 127.5 10 2.5 27409 $150K - $299K 2 $183,750 95.1 49.5 19 9.5 27409 $300K - $499K 0 n.a. n.a. n.a. 2 n.a. 27409 $500K & Over 0 n.a. n.a. n.a. n.a. n.a. 27409 Total 6 $147,250 95.7 101.5 33 5.5 27410 < $75K 1 $47,000 80.3 19.0 1 1.0 27410 $75K - $149K 13 $130,338 97.0 89.8 16 1.2 27410 $150K - $299K 39 $201,951 96.8 99.0 200 5.1 27410 $300K - $499K 5 $387,100 95.4 106.4 64 12.8 27410 $500K & Over 1 $500,000 90.9 282.0 43 43.0 27410 Total 59 $204,288 96.3 99.3 324 5.5 27455 < $75K 3 $41,000 66.3 51.7 1 0.3 27455 $75K - $149K 8 $114,356 96.7 70.8 38 4.8 27455 $150K - $299K 9 $217,111 92.5 128.9 76 8.4 27455 $300K - $499K 4 $347,250 92.7 190.5 94 23.5 27455 $500K & Over 3 $588,333 94.3 108.0 58 19.3 27455 Total 27 $227,624 91.1 109.9 267 9.9 5 Greensboro Housing Report, revised 5/4/2010
- 6. Inventory-Sales Ratios by Zip Code 6 Greensboro Housing Report, revised 5/4/2010
- 7. Economic Trends in the Piedmont Triad Economic conditions in the eight-county Piedmont Triad region improved modestly during the 1st quarter.3 The Dixon Hughes Triad Business Index which tracks the pace of economic activity in the 8-county Triad region rose 0.3 percent in January.4 The Triad Economy 180 160 160 NC Business Index 140 (right scale) 140 120 120 Triad Business Index 100 100 (left scale) 80 80 90 92 94 96 98 00 02 04 06 08 Total nonagricultural wage and salary employment (employer survey) in the Piedmont Triad was off -0.3 percent in January. Over the past 12 months, employment has fallen -4.5 percent. For the nation as a whole, employment declined -3.0 percent during the same period. The number of persons in the Triad employed in the service-producing sector slipped -0.2 percent in January but higher employment was recorded in professional and business services. Residential building permits in the Triad, which reflect planned construction, declined -1.3 percent in January, but are up 8.0 percent over the past year. Single-Family Building Permits, 1990-2010 2400 2000 160000 National, right scale 1,000s of dollars 1600 1,000s of units 120000 1200 80000 800 Triad, left scale 400 40000 0 90 92 94 96 98 00 02 04 06 08 The number of real estate foreclosures in the Triad increased 1.3 percent in January and have risen 41.5 percent over the past 12 months. Nationally, foreclosures were down 9.7 percent lower in January but have risen 15 percent over the past 12 months. There were 9,509 reported foreclosures in the Triad over the past year. 3 The Triad is defined as the eight-county area that is composed of the Burlington MSA, the Greensboro/High Point MSA, and the Winston-Salem MSA. 4 See, http://www.triadbizindex.com/ 7 Greensboro Housing Report, revised 5/4/2010
- 8. Longer-Term Trends The population of the Triad totaled 1.39 million in 2008, growing at an average annual rate of 1.3 percent since 2000. Guilford County’s population was 472,216 in 2008, rising 1.4 percent annually since 2000. The pace of population growth in the Triad accelerated in 2008, with population growing 1.6 percent from 2007 to 2008. The rate of population growth in Guilford County also increased in 2008, growing more rapidly than the nation, but slower than the state. . Population Change in the Triad & the Nation, 2008-2000 Percent Percent Population Change Change Area 2008 2008-07 2008-00 Alamance County 148,053 2.25% 1.56% Davidson County 158,166 1.34% 0.90% Davie County 40,971 1.50% 2.05% Forsyth County 343,028 1.60% 1.44% Guilford County 472,216 1.76% 1.44% Randolph County 141,186 1.20% 0.99% Stokes County 46,171 0.51% 0.40% Yadkin County 37,954 0.74% 0.54% Triad 1,387,745 1.59% 1.30% North Carolina 9,222,414 2.00% 1.72% United States 304,059,724 0.92% 0.97% Source: Census Bureau Since the first quarter of 1997, existing home prices in Greensboro have risen at an average annual rate of 1.0 percent, lagging the consumer price index (CPI), which has increased an average of 2.4 percent annually. The appreciation of housing prices in Greensboro has lagged substantially the rise in housing prices nationally. For the nation as a whole, existing home prices have risen at a 5.5 percent annual rate from 1997.1 through the 1st quarter of 2010, according to the S&P Case-Shiller 10-City Home Price Index. Existing Housing Prices in Greensboro & the Nation (quality adjusted, index scale) 300 250 National (Case-Shiller) 200 150 Consumer Price Index (CPI) Greensboro 100 97 98 99 00 01 02 03 04 05 06 07 08 09 8 Greensboro Housing Report, revised 5/4/2010
- 9. In 2009, the average existing home that was sold had 2,105 square feet of floor space. It was 1.5 stories high, had 2.4 bathrooms, and 1.3 garage parking spaces. The average home had 0.86 fireplaces. The average age of existing homes sold was 24.8 years. Seventy-five percent of exiting homes sold were in the city limits of Greensboro, and 32 percent of all homes were in the northwest part of Guilford County. A total of 2,408 single-family homes were sold through Triad MLS in the Greensboro area of Guilford County. Characteristics of Existing Homes Sold, 2009 Square Footage 2,105 Floors 1.5 Baths 2.4 Garage Spaces 1.3 Fireplaces 0.86 Age 24.8 In the City 75% Northwest 32% Number Sold 2,408 Methodology The Greensboro Housing Report uses data from the Triad MLS to track the pace of housing activity in Guilford County, excluding High Point and Jamestown. Average home price numbers reflect quality- adjusted averages. These averages are constructed using the multiple regression approach. Among the independent variables in the analysis are: square footage, number of baths, age, and other amenities of the structure. This approach to calculating quality-adjusted prices is discussed in: G. D. Jud & T. G. Seaks, "Sample Selection Bias in Estimating Housing Sales Prices," Journal of Real Estate Research, Vol. 9, No. 3, (1994), pp. 289-298. The affordability index measures changes in the income-payment ratio. The loan payment is calculated as the monthly payment necessary to finance a 90 percent, 30-year loan on the average house price at prevailing interest rates. The income measure is average household income, as reported by the U.S. Department of Commerce, Bureau of Economic Analysis. The sales-list price spread is the ratio of selling price to listing price. The Greensboro Housing Report is compiled for the Triad MLS by: Dr. G. Donald Jud Jud & Associates, 722 Rollingwood Drive Greensboro, NC 27410 - 6165 Phone: 336-294-3655 Email: GDonaldJud@JudAssociates.com. 9 Greensboro Housing Report, revised 5/4/2010